In Wayne Byers speech yesterday – the one in which he said an 8% growth rate in residential home lending was “healthy (!)… he also covered the “stress testing”processes with the banks, and gave them a clean bill of health.
 We ran our own scenario on our Core Market Model, using their worst case baseline, and we get a result much closer to the LF Economics scenarios we posted early than the APRA outcome. In fact we think the LF Economics numbers may themselves be conservative.
In addition from APRA, we get no detail on their work, and no individual bank level disclosure (unlike the US version). So we do not find the APRA version very credible. Which is a worry. Clearly their strategy is “just trust us” – just as they did with the now revealed poor lending practice.
So to summarize the “tests” are:
- A downturn in China and a collapse in demand for commodities
- The subsequent downgrade in sovereign and bank debt ratings leads to a temporary closure of offshore funding markets
- A sell-off in the Australian dollar and widening in credit spreads.
- Australian GDP falls by 4 per cent
- Unemployment doubles to 11 per cent
- House prices decline by 35 per cent nationally over three years.
In addition, banks had to consider an operational risk loss event involving misconduct and mis‑selling in the origination of residential mortgages. The additional operational risk element served as an amplifier of the stress, adding a further shock to bank balance sheets.
The result is a reduction in bank capital and credit losses of around $40 billion on their residential mortgage books. What have they assumed about property sales in default we wonder, and what about claims on Lender Mortgage Insurers at an industry level?
In addition, APRA does not really give us much detail of the scenarios (compare this with the US version). Is it a short sharp shock, or a long grind? We suspect the former.
Now, if we run the same scenario through our Core Market Model, based on our household surveys, what happens?
Well, first if banks cannot fund their books from offshore markets, their ability to lend, in aggregate drops by ~30%, unless it can be supplemented by either more deposits, or local investors. Remember that a significant proportion of the non-deposit part of bank books are funded short-term, so the impact will be immediate.
Either way there will be a rationing of credit and a bid up the price of funds – so putting more pressure on margins and mortgage rates. The local markets ability to provide sufficient funding is suspect, and it is likely that the Government via the RBA would have to provide funding, perhaps by the purchase of existing loan portfolios. We doubt the lenders ability to access funding. Loans will be rationed.
Households who are unemployed will be unable to continue to pay their mortgages, and will likely default. We have to assume that specific segments of the market will be most impacted, and we can run analysis on this. In addition some households renting will be unable to pay their rents as they fall due, putting some investment property under pressure.
We estimate that around 15% of mortgage holders will default. We assume that banks will try to assist borrowers, via their hardship schemes, and capitalise interest for a period, rather than foreclose (selling in a falling market just creates more losses).
So over the scenario time frame, using our data, we think credit losses will be will north of $310 billion. This compared with the $40 billion in the APRA results and $298 billion from LF Economics.
So why the difference?
Well, first, we think bank funding costs will be higher, thanks to the network effect of all lenders trying to tap limited sources thus driving rates higher still. APRA appears to have looked at banks individually.
Second, we think more households will be exposed to default risk as unemployment bites. In addition, we think that those remaining employed will have less overtime, and no wage growth so more financial pressure.
Third, the LVR and DTI ratios in our date (based on up to date data) suggests that the risks in the portfolio are actually higher than those used in the APRA (bank sourced) modelling. Some of this is so called “liar-loans” and the rest is multiple debt exposures and changed circumstances. Currently banks are myopic on this.
Fourth, Lender Mortgage Insurers will not be able to meet all claims. Not sure what APRA or the banks assumed. LMI’s might well be one of the first points of failure.
With that in mind, this is what APRA said:
When the storm hits – APRA’s most recent industry stress test
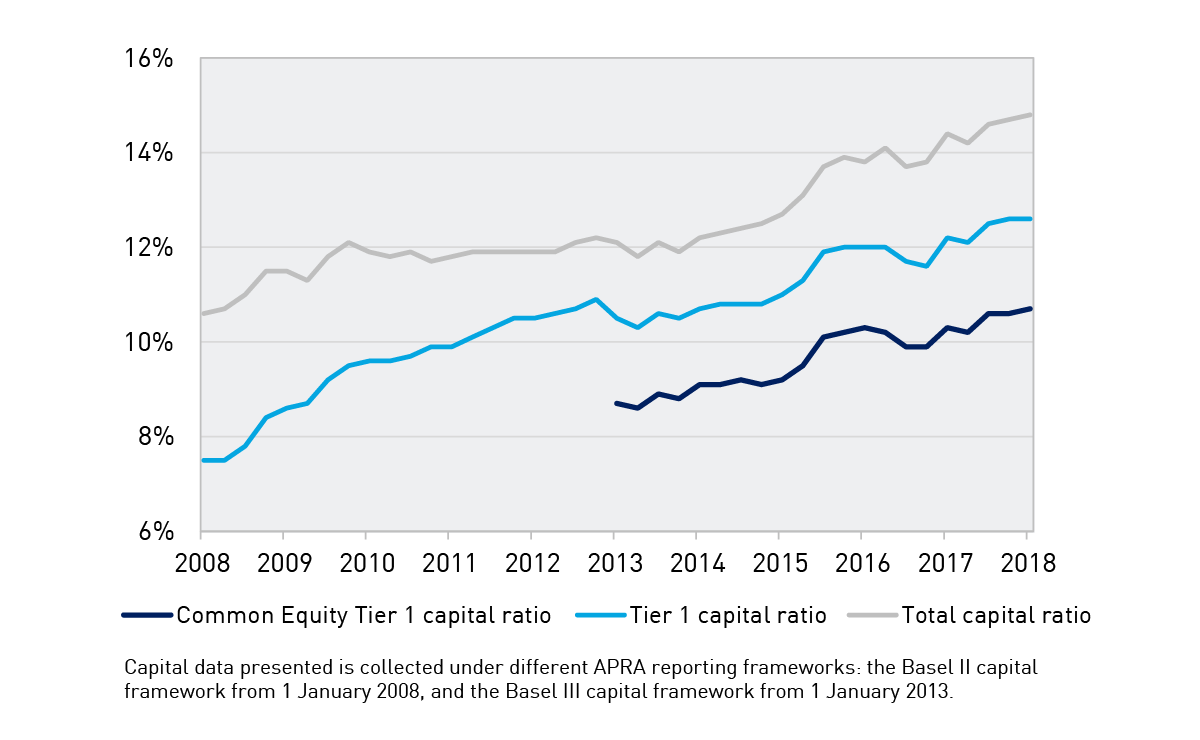
Alongside the gradual improvement in lending standards has been a significant increase in capital within the banking industry. This has been built first on the post-crisis Basel III reforms, and then on the recommendations of the 2014 Financial System Inquiry. As banks reach the “unquestionably strong” benchmarks that we announced last year, it will complete a decade-long build-up of capital strength.
ADI industry capital ratios
That capital exists today so that it can be called on in adversity. In 2017, we conducted our most recent test of banks’ resilience through an industry stress test. The aim of the stress test was not to set capital levels, and consistent with past practice it was not run as a pass or fail exercise. Rather, APRA utilises stress tests to examine the resilience of the largest banks, individually and collectively, and to explore the potential impacts of grim and challenging periods of stormy economic weather.
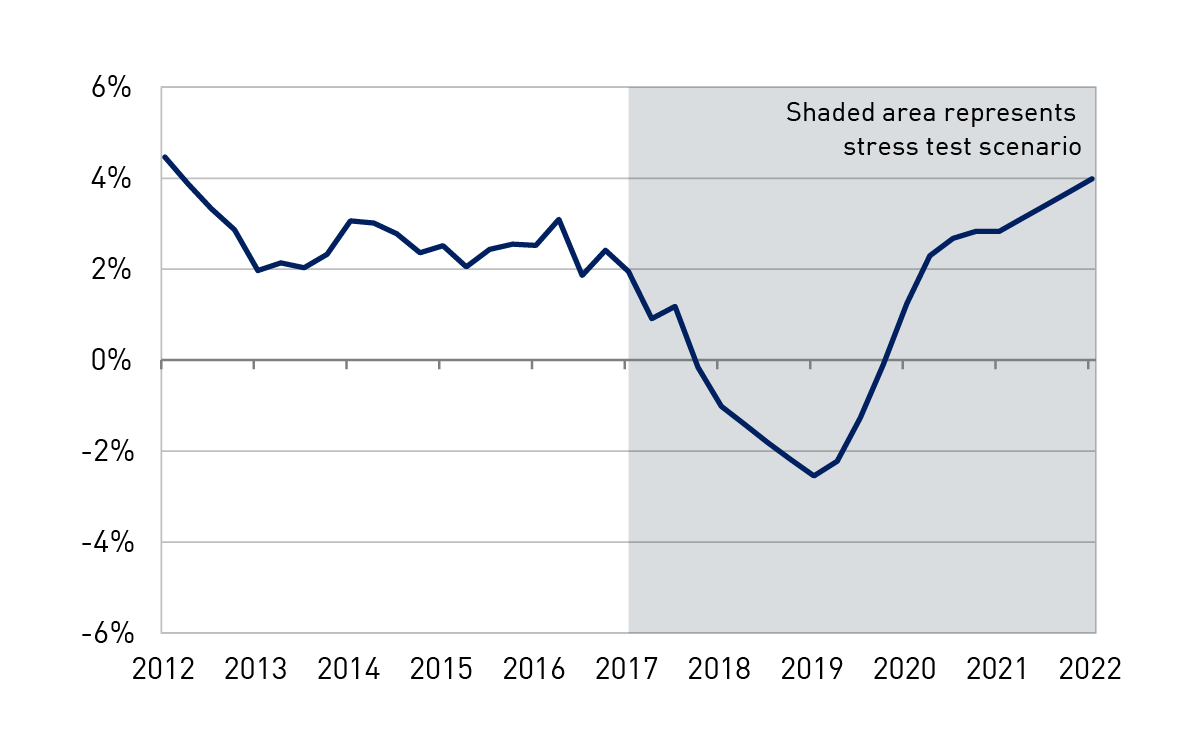
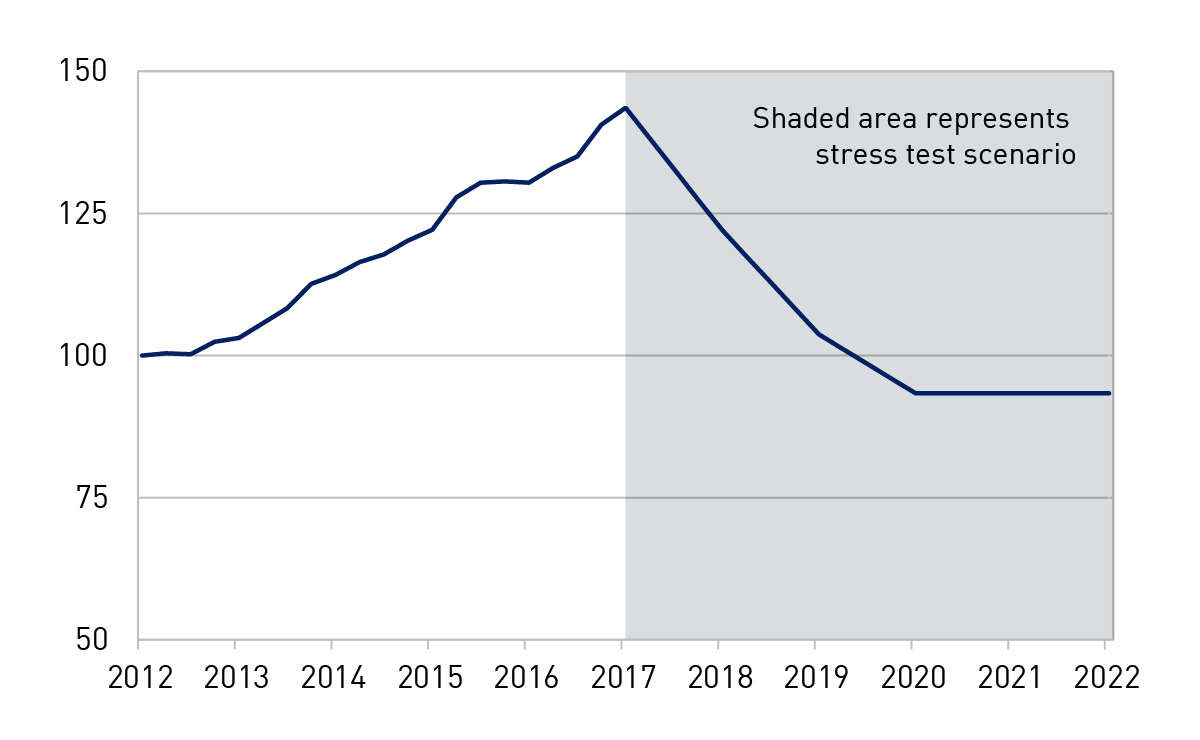
The scenario for the stress test was designed to be severe but plausible, and to target the key risks facing the industry. The basic scenario was a severe economic stress in Australia and New Zealand, with a significant downturn in the housing market at the epicentre. This was triggered by a downturn in China and a collapse in demand for commodities. The subsequent downgrade in sovereign and bank debt ratings leads to a temporary closure of offshore funding markets, a sell-off in the Australian dollar and widening in credit spreads. Australian GDP falls by 4 per cent, unemployment doubles to 11 per cent and house prices decline by 35 per cent nationally over three years.
Stress test – Real GDP growth
Stress test – House price index
To this traditional macro stress scenario we then added a twist. In addition to the sharp downturn in the economic environment, banks had to consider an operational risk loss event involving misconduct and mis‑selling in the origination of residential mortgages. The additional operational risk element served as an amplifier of the stress, adding a further shock to bank balance sheets.
Before sharing the results with you, I do need to note that these scenarios do not represent our official forecasts! They are obviously quite different from the base-case projections contained in most forecasts for the economy. But that is also why it is so important to test these severe but hopefully hypothetical scenarios – to avoid the risk of disaster myopia and a belief that we are somehow immune to tail risk events, given a benign track record and outlook.
The stress test involved 13 of the largest banks, and our approach was to generate the results in two phases. In the first, banks used their own models and parameters to estimate the impacts of the stress, subject to common guidelines and instructions to ensure a degree of consistency in the results. In the second phase, banks were asked to apply APRA estimates of the stress impacts, based on our own research, modelling, benchmarks and judgement.
While the phase 1 results were useful in shining a light on the banks’ modelling capabilities, and provided a view on what the banks themselves believe the impact of the scenarios would be, I’ll focus on the results from phase 2. These ironed out the kinks in modelling and, in our view, provided a more reliable and consistent set of results at a bank-specific and industry aggregate level.
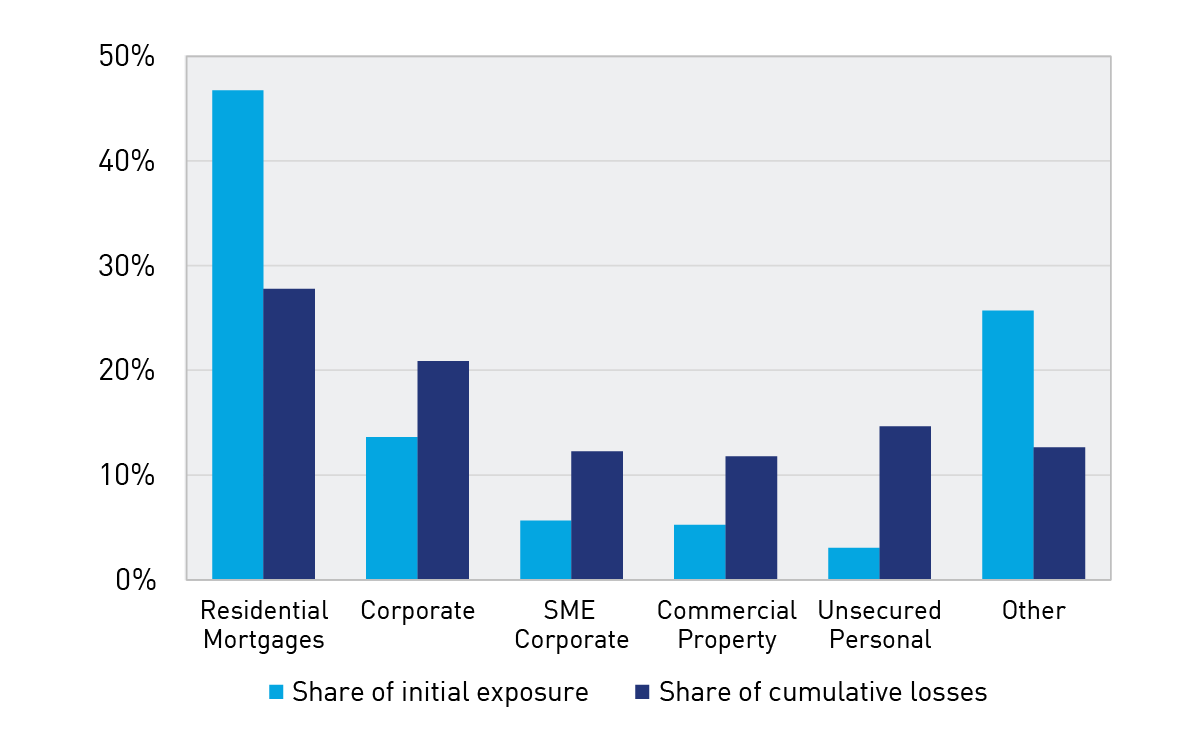
Chart 11: Proportion of cumulative credit losses
As you would expect given the severity of the macroeconomic scenario, banks incurred significant losses, producing a substantial reduction in capital. Projected losses on the residential mortgages portfolio were large, consistent with the depth of the fall in house prices and the rise in unemployment. Overall, banks projected credit losses of around $40 billion on their residential mortgage books, which was equivalent to a little over a quarter of overall projected loan losses. As a loss rate, this would be broadly consistent with the experience in the UK in the early 1990s, but lower than the losses seen in Ireland or the US during the global financial crisis. It also represented a slightly lower loss rate than in APRA’s previous industry stress test in 2014. Some of this is due to differences in the scenario and in modelling, but it was also arguably reflective of the improvement in asset quality in recent years.
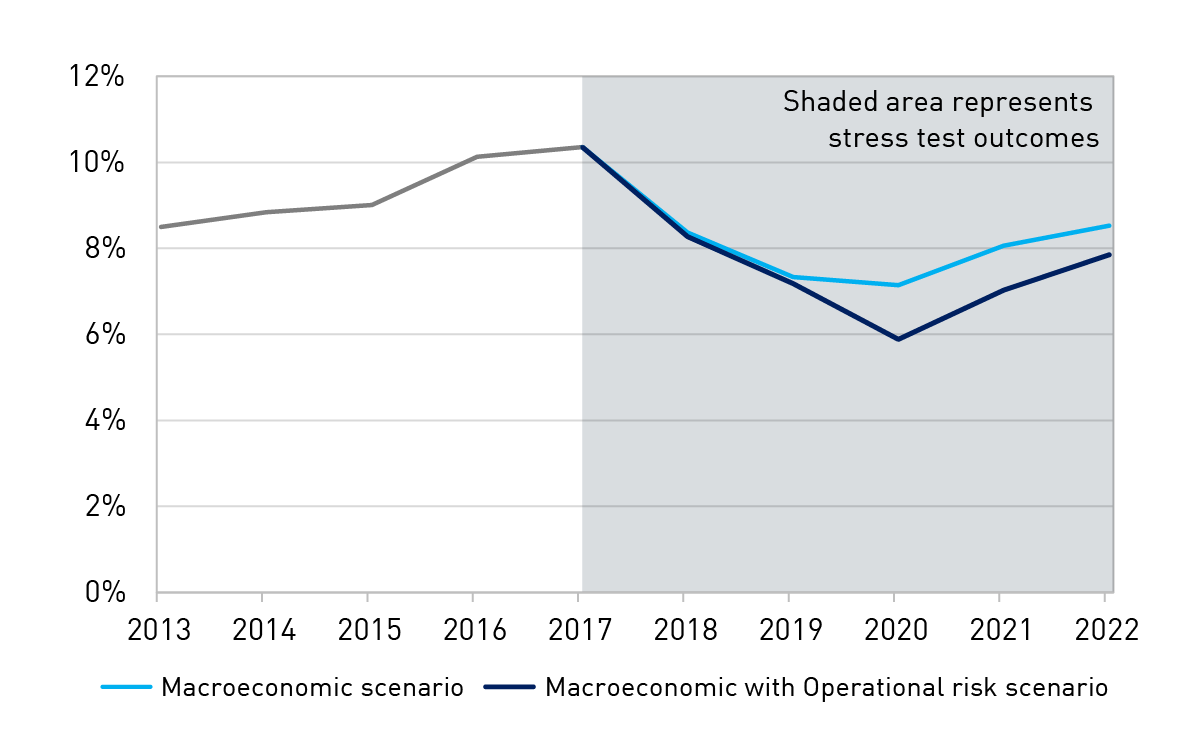
In aggregate, the common equity tier 1 (CET1) ratio of the industry fell from around 10.5 per cent at the start of the scenario to a little over 7 per cent by year three, a fall of more than 3 percentage points from peak to trough. This was driven by a combination of higher funding costs, significant credit losses and growth in risk weighted assets reflecting the deterioration in asset quality. Adding in the operational risk event, the aggregate CET1 ratio fell further to just below 6 per cent, driven by additional costs from customer compensation, redress, legal fees and fines.
CET1 capital ratio results Macroeconomic and operational risk scenario
Despite significant losses, these results nevertheless provide a degree of reassurance: banks remained above regulatory minimum levels in very severe stress scenarios. As importantly, these results have been estimated without assuming any management actions to respond to and mitigate the stress, such as equity raisings, repricing and cost cutting – all of which would occur in reality and lessen the impact. The results therefore represent if not a worst case scenario, then at least a scorecard towards one end of the spectrum of possible outcomes. Once we take into account expected (and plausible) management actions, the banks remain above the top of the capital conservation buffer throughout, and rebuild back towards unquestionably strong levels by the end of the recovery periods.
The funding and liquidity positions of the industry also stood up to the test. Despite difficulties accessing funding markets, most banks maintained their liquidity coverage ratios (LCRs) above 100 per cent through the crisis scenario. Some dropped below 100 per cent, but even then, those banks were able to initiate strategies to restore their position to good order within a reasonable timeframe. This is entirely consistent with how the LCR is intended to operate in severe conditions – liquidity is held in good times so it can be used when needed.
That general reassurance comes, however, with a note of caution. Like weather forecasting, stress testing is an inexact science. Modelling in Australia is complicated by a lack of experience of significant stress and periods of high loan defaults. This is a good problem to have, but it makes the stress testers’ task difficult, and widens the margin for error. That is particularly the case for the mortgages portfolio, and estimates of misconduct losses are of course necessarily judgement-based. In addition, the feedback loops from second order effects and competitor reactions are inherently difficult to model.
Given these challenges, stress testing needs to continue to evolve, and no one scenario can be relied upon for a definitive answer. In this vein, our 2016 exercise didn’t set a scenario at all, but instead asked the major banks to conduct a “reverse stress test”: to assume a fall in capital to minimum prudential levels, and estimate the scenarios that could have caused these outcomes.
The scenarios generated invariably included a macroeconomic downturn, compounded by a shock amplifier such as a cyber-security attack, mis-selling case or additional ratings downgrades. One bank assumed that it was last to market and couldn’t get an equity raising away, challenging a long-held belief that this cornerstone recovery action will always be available. The exercise was valuable primarily for broadening the stress testing imaginations of the participating banks, and reinforcing the importance of continuing to invest in capabilities.
This year, we will be assessing a range of banks’ stress testing capabilities through a review of internal capital adequacy processes (ICAAPs). Our review will focus on scenario development, internal governance and the use of stress testing to inform decision-making on appropriate capital buffers. In parallel, APRA and the industry will be subject to external examination: the IMF will be conducting a stress test of the Australian banking industry as part of its Financial Sector Assessment Programme (FSAP). We look forward to the results from this exercise, and to understanding what we can learn from their approach. Just as we expect banks to continue to invest in their modelling, data and capabilities, APRA will be reviewing its stress testing framework this year to identify areas for enhancement. We will also be preparing for the next industry stress test in our cycle, another opportunity to test resilience, explore vulnerabilities and challenge assumptions.

