Following yesterdays post on our latest Probability of Default Modelling, we received a number of requests for more detailed information, and especially where the risks of default are highest within the portfolio.
So today we provide some further analysis, cutting the probability of default metrics by some additional dimensions. We make the point that granular analysis is required to really understand what is going on, portfolio level analysis masks too many differences to be useful!
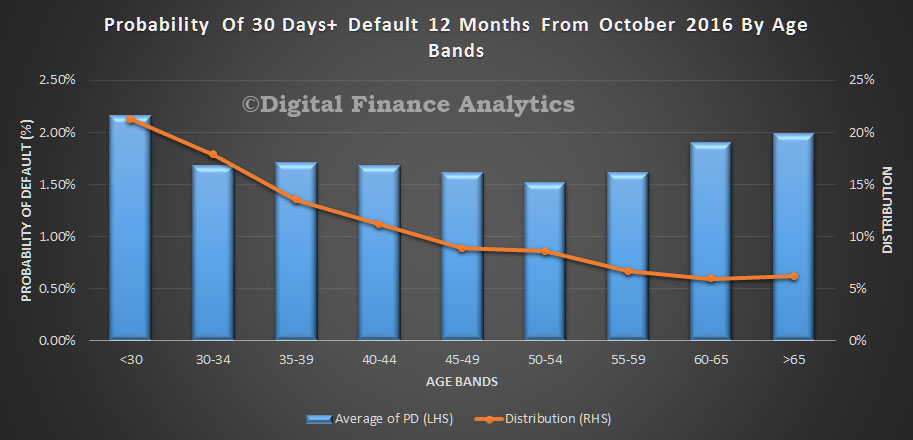
We start with age bands. This chart shows the relative distribution of owner occupied loans by age bands, (the red line) and the relative default probability as estimated by our models. More mature households are relatively better placed, but younger households, and those who are entering retirement still holding a mortgage have a higher risk score.
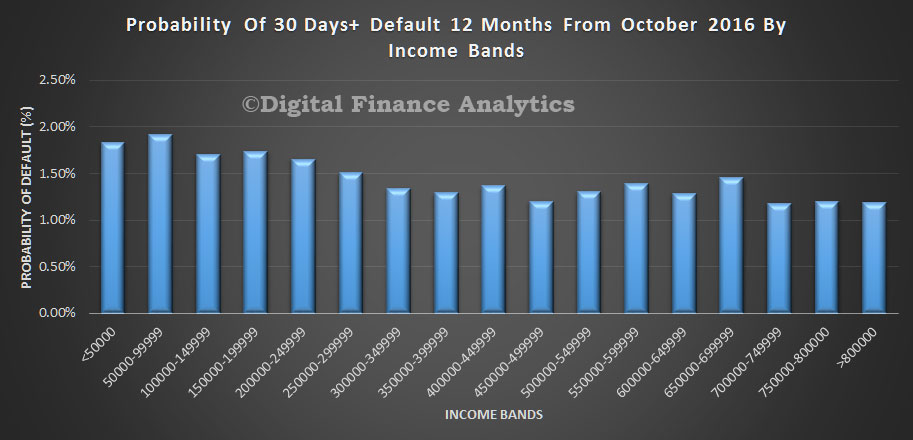
 Turning to household income, we see elevated risks of default among lower income bands, but it does not go away as we go up the income scale. This is because those households with larger incomes generally are more leveraged and are more likely to be holding interest only loans.
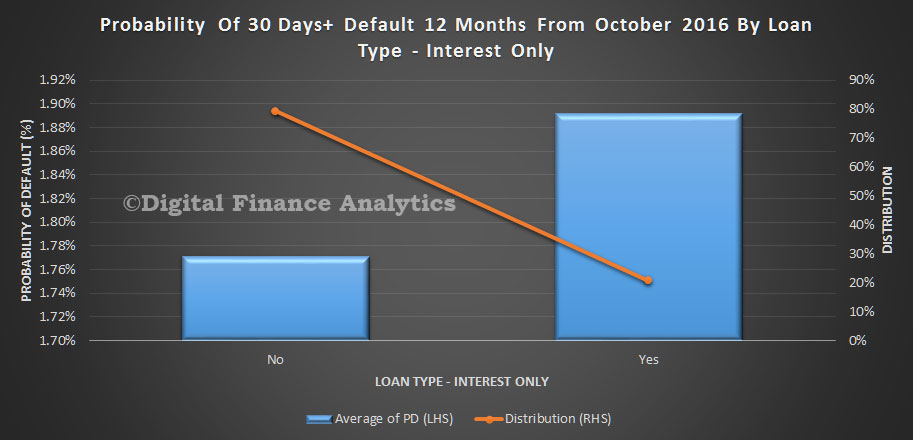
 We find that generally households with interest only loans are more likely to default, but the difference is relatively small, on average.
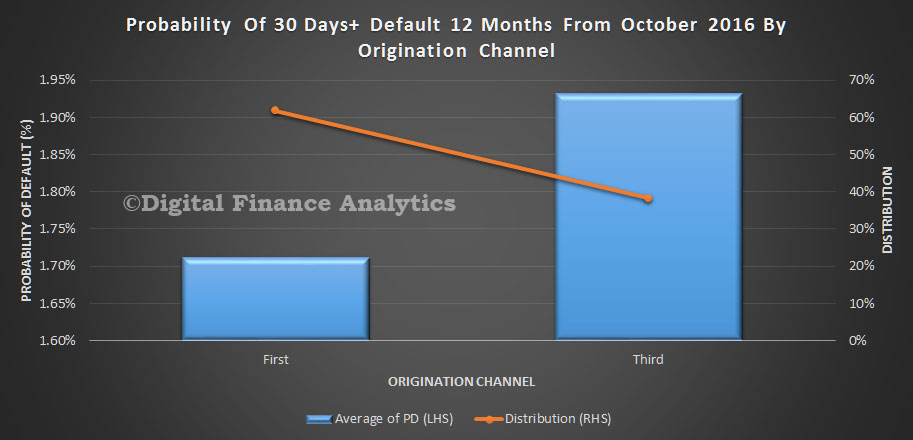
 Channel of origination does influence the probability of default, with those using a mortgage broker slightly more likely to default. We think there are a number of factors below the waterline here which explains the differences. For example brokers know where to look for the larger loan, can help position the application for approval, and households choosing to use brokers are often after a bigger loan on the same income, compared with those via a branch.
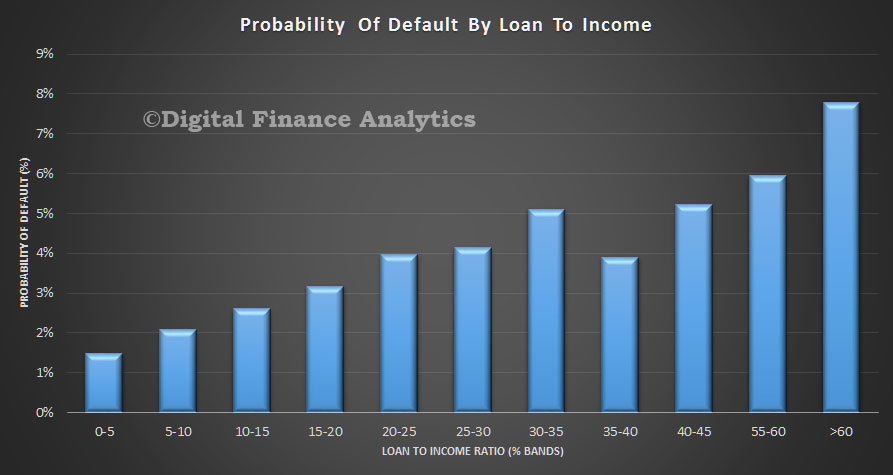
 Two other perspectives. Loan to income has a significant impact, with those putting more than 60% of their income to repay the mortgage most at risk. As the LTI reduces, so does the risk. We think the LTI and DSR ratios should become the cornerstone of mortgage underwriting. APRA please note!
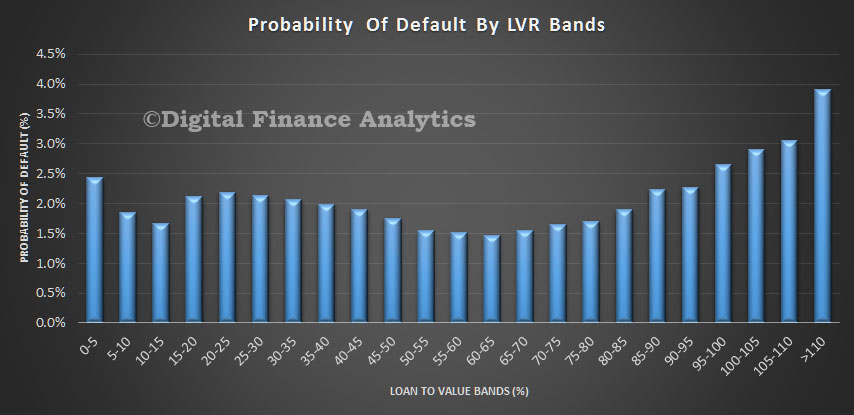
 Finally, Loan To Value ratios are linked to risk, but it is not a straight forward relationship. In fact some of the lower LVR loans are more likely to default than those in the 50-70% LVR range. This is simply a function of constrained incomes. At the upper end risk rises again, thanks to larger loans relative to income, and lower net assets held.