As American baseball legend Yogi Berra once supposedly quipped, “It’s déjà vu all over again.” Three years ago the crisis was in Greece, now it’s Turkey. Another European summer and another European economic crisis.
It’s tempting to say that being in Europe is all the two situations have in common. Greece’s population is a little over 10 million; Turkey’s is nearly 80 million. Greece’s troubles were triggered by out-of-control government debt; Turkey’s government debt-to-GDP ratio is quite low. The Greek government was on the loopy left; Turkey’s ruling Justice and Development Party is on the conservative right.
But the similarities between the Greek and Turkish crises are deeper than the differences.
Both were brought about by decades of ignorant, populist economics. When crisis hit, both countries had leaders who instantly made things worse. And in both cases the world’s global capital capital markets have proved to be an unforgiving judge.
This means Turkey is a large net borrower from the rest of the world.
President Recep Tayyip Erdogan has goosed GDP through cheap foreign credit and low real interest rates. But unlike tinpot strongmen who worry mainly about holding onto power tomorrow, global markets look far into the future.
And this year markets decided that Turkey’s economic future looked pretty bleak.
It is estimated that there is more than US$200 billion of dollar-denominated Turkish corporate debt. When the lira falls, foreign-denominated debt rises, making it hard to service, let alone repay.
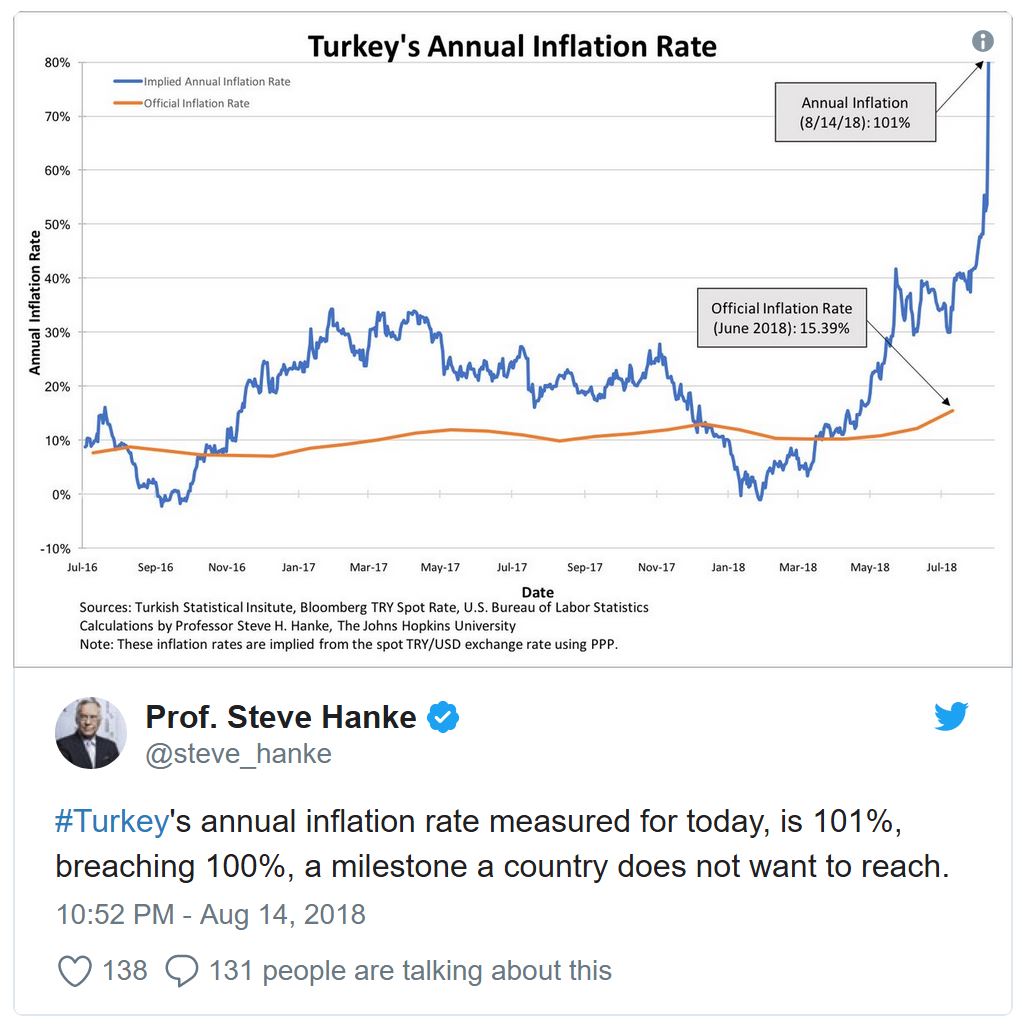
At the same time, the inflationary spiral this sets off does huge damage to the domestic economy. It is estimated that Turkey’s annual inflation rate is running at more than 100%.
Erdogan doesn’t want interest rates to rise – and he has bullied the central bank into doing so later and less than the bank otherwise might have. He is on record as saying that higher interest rates increase inflation, rather than the opposite, as every first-year economics student knows.
To Erdogan, black is white, night is day, up is down.
US President Donald Trump announced last week that “Aluminum will now be 20% and steel 50%. Our relations with Turkey are not good at this time!” Erdogan’s response has been to call for a boycott of iPhones and enact retaliatory tariffs of as much as 140% on a range of US goods.
Erdogan did secure US$15 billion in foreign investment from Qatar, after meeting Emir Sheikh Tamim Bin Hamad Bin Al Thani in Ankara on Wednesday. That might stop some of the bleeding for now, but this gives Qatar tremendous leverage.
The real cost of this support won’t be measured in basis points.
Global contagion?
The big risk here is that the foreign holders of all this dollar-denominated Turkish debt get into trouble as Turkey struggles to repay or defaults. Even the Bank of International Settlements doesn’t easily know who all these debt holders are, but banks in Spain and France appear to be significantly exposed – especially Spain.
A run on the Turkish currency could turn into damage to balance sheets of banks across Europe, triggering a potential debt crisis in countries like Spain.
That’s some distance off for now. But it looms.
All this will likely end in some kind of International Monetary Fund assistance package – but that’s going to come with conditions. Folks who like to use the term “neoliberal” will dub such conditions as brutal austerity.
Others will consider the conditions the cost of stabilising an economy pushed to the brink by a financially illiterate megalomaniac.
Economics in a world of democratic backsliding
Turkey may be at the centre of the crisis du jour, but Erdogan is but one of a cast of nasty, illiberal characters. Although they occupy varying positions on the ideological spectrum, from Poland to Hungary to Latin America, there has been significant democratic backsliding in recent years.
These strongmen do violence to principles of liberal democracy – often literally. They also damage their economies and, as a consequence, their people.
Institutions like the International Monetary Fund will probably handle the problem in Turkey, although it would be a lot simpler if Erdogan just allowed interest rates to increase and solve the problem directly.
But sadly we can expect more illiberal and nonsensical economics from these illiberal strongmen. It is contagious populist ideology more than financial contagion that should scare us right now.
Author: Richard Holden Professor of Economics and PLuS Alliance Fellow, UNSW
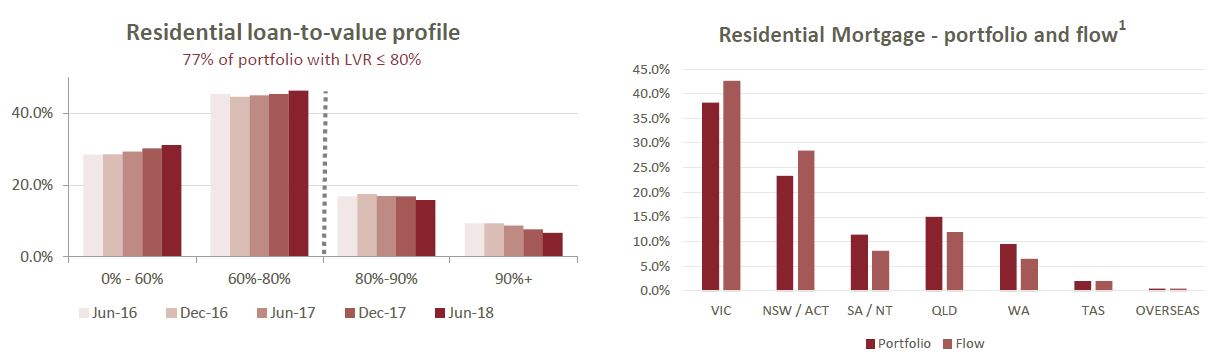
S&P Global Ratings has maintained its low risk insurance industry and country risk assessment (IICRA) for Australia’s mortgage insurance sector, awarding the second strongest rating on a six point scale.
According to a release from the ratings agency, “In our opinion, product risks for mortgage insurers remain elevated, reflecting the recent history of sustained house price appreciation across the Australian housing market.
“House prices in Australia’s major cities of Melbourne and Sydney have declined in the past 12 months, easing some risk attributes. We expect the house price declines in Australia’s largest cities to be orderly, while risks associated with slow wage growth and relatively high debt to income levels remain,” the statement continued.
Responding to the results, QBE chief executive officer Phil White says the low risk is due to the Australian market’s high diversification.
Speaking to Australian Broker, he said the diversification in borrower profiles, geographic distribution of mortgages, and the range of banks with LMI in the marketplace enhances strength.
“Diversification is one of the fundamental things that underpins Australia. The second part is how LMI was designed to meet the needs of our market. The regulatory regime here is extremely good and that is underpinned also by a very disciplined underwriting environment.
“I’m not too worried about some of the scare mongering there might be around the forecast for house prices or the economy more broadly. LMI has been designed to suit the Australian market and the future for it right now is quite positive,” he continued.
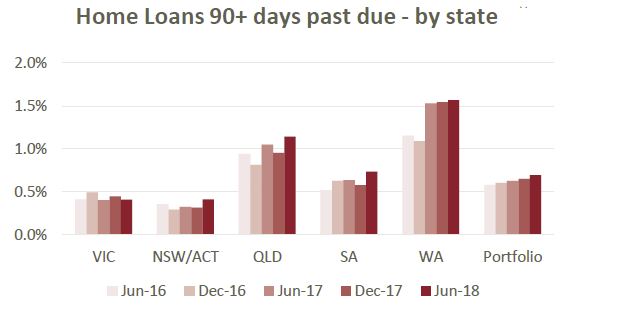
However, Martin North, principal of Digital Finance Analytics, says the current environment is “risk on” and, noting rising delinquencies in WA and other areas, those risks are set to rise.
“Generally it is risk on for the insurers and the majors. The banks that have released their financial results this reporting season are showing slightly higher 90 day plus delinquency rates and that was also true in the most recent Moody’s report. It’s not a huge increase but the trend is definitely up.”
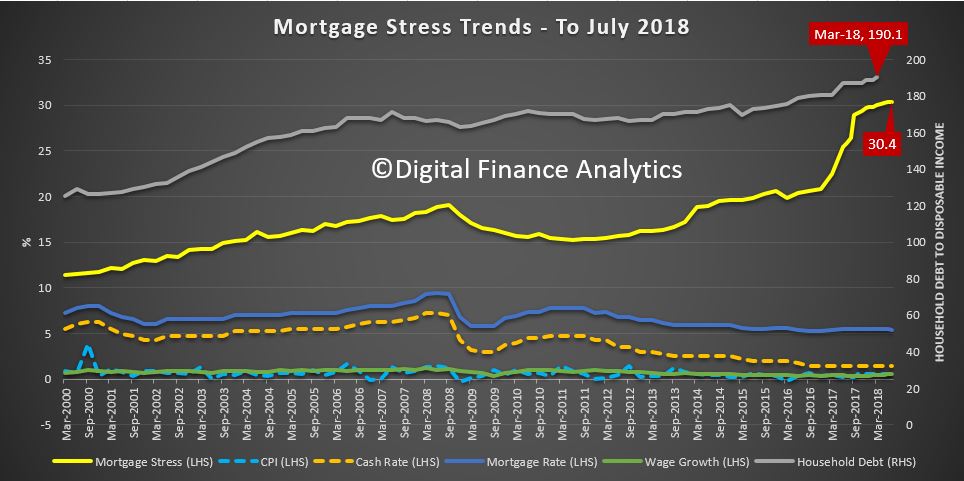
Drawing on independently collated data, North says 30.4% of owner occupied borrowing households are finding it difficult to manage repayments currently. This equates to 970,000 households, of which more than 23,000 are in severe stress.
“They’re making the payments but it’s difficult and this is the highest that number has ever been,” he commented.
In contrast to S&P’s outlook, North concluded, “Mortgage rates will rise slightly because of international funding pressures. Of course the US will put its rate up once or twice more this year and that will flow through. It’s risk on rather than risk off and I think we need to watch this very closely.”
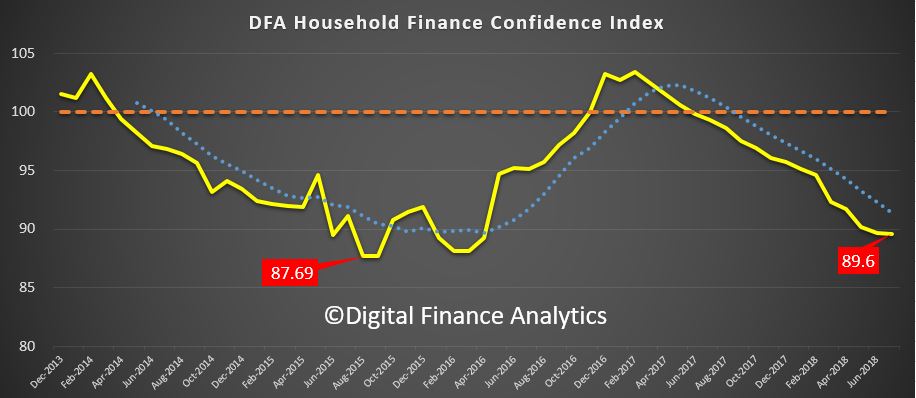
The latest edition of the DFA Household Financial Confidence Index to end July 2018 remains in below average territory, coming in at 89.6, compared with 89.7 last month. We had expected a bounce this month, in fact the rate of decline did slow, thanks to small pay rises for some in the new financial year, and refinancing of some mortgage loans to the “special” rates on offer currently. However, the index at this level is associated with households keeping their discretionary spending firmly under control. And the property grind is still impacting severely.
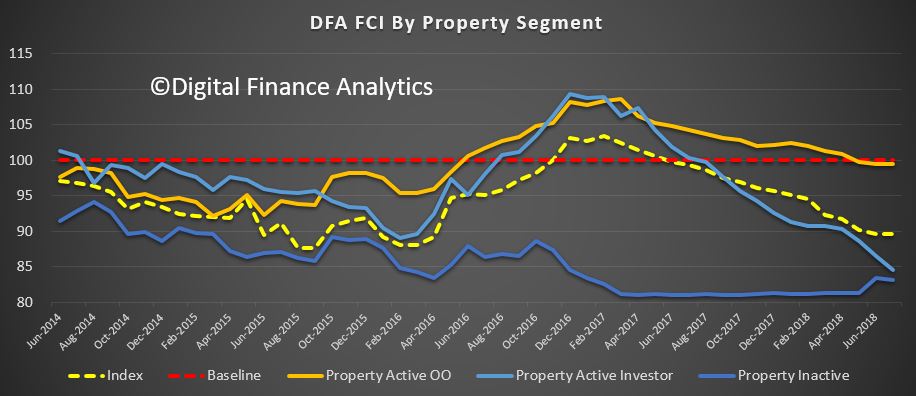
Looking at the results by our property segmentation, owner occupied households overall remain around the neutral reading, while property investor confidence continues to fall, into territory normally associated with those who are renting or living with family. This signals significant risks in the property investment sector ahead.
Owner occupied property owners who have been able to refinance (lower LVR loans) have been able to shave their monthly repayments, while for some in rented accommodation they have found it easier to find a rental at a lower rent. Investment property holders reported continued concerns about servicing their loans, and of potentially higher interest rates ahead. Those on interest only loans were particularly concerned about their next reset review, given the tighter underwriting standards now in play. The peak of the resets however is well more than a year away.
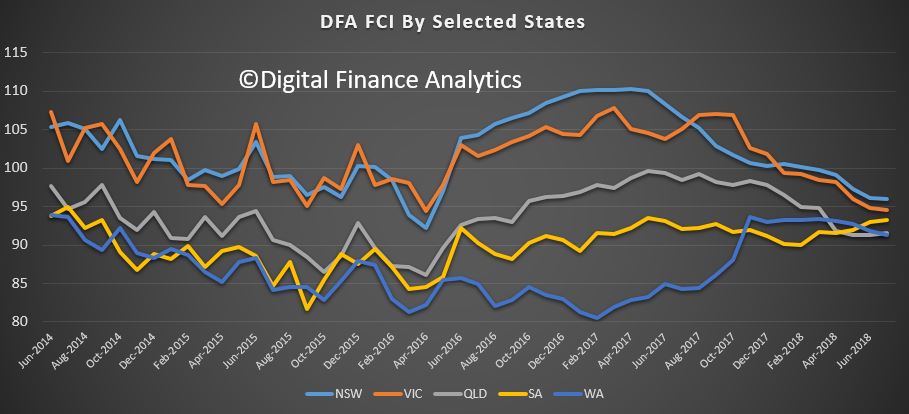
The spread of scores across the states continues to bunch, as NSW and VIC households react to lower home prices. WA continues to show little real recovery in household finance (despite the hype) although there was a small rise in Queensland, thanks to recent pay lifts for some.
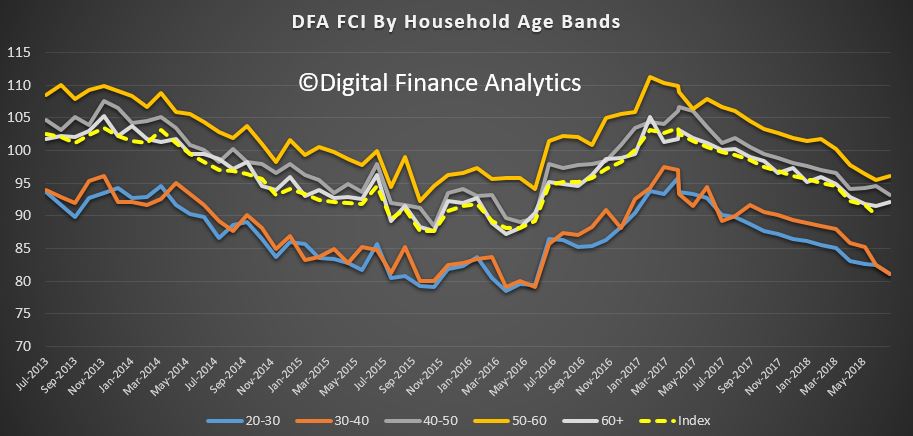
Across the age bands, younger households remain the least confident, while those aged 50-60 were more bullish, thanks to recent stock market lifts, and access to lower rate refinance mortgages. The inter-generational dynamic is in full force, with younger households not in the property market seemingly unable to access the market (despite the recent incentives in NSW and VIC) and those with a property, and mortgage wrestling with the repayments.
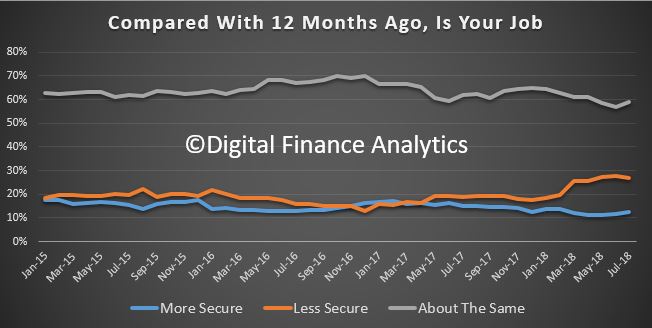
Looking in more detail at the index components, job security improved a little this month, with 12.5% feeling more secure, up 0.67%, 27% less secure, down 0.92% and those about the same at 58.8%, up 2%. However, we see many households in multiple part-time jobs, and around 20% of households are actively seeking more work/hours.
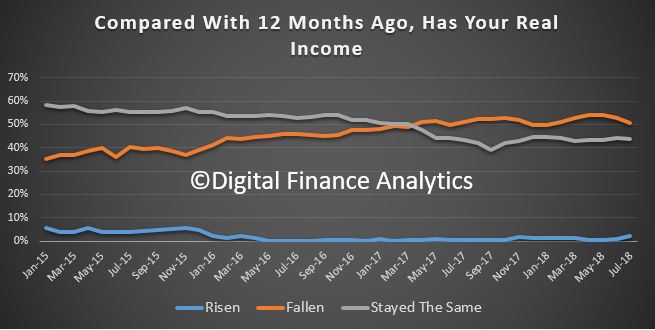
There was a small rise in those reporting an income improvement, thanks to changes which kicked in from July. 2.3% said their income has improved, up 1.5% from last month, while 43.7% stayed the same, and there was a drop of 2.2% of those reporting a fall in income, to 50.5%.
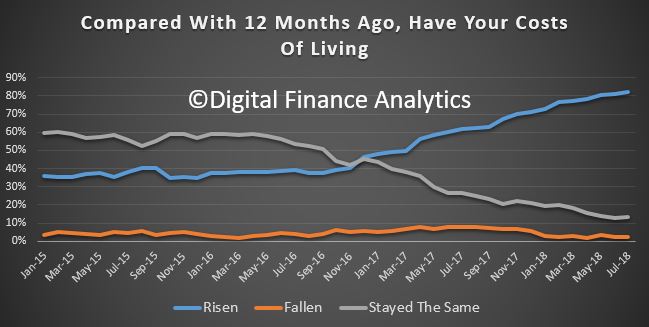
Households continue to see the costs of living rising, with 82.3% reporting higher costs, up 1%, 13% reporting no change, and 2.5% falling. The usual suspects included power bills, child care costs, the price of fuel, plus health care costs and the latest rounds of council rate demands. The reported CPI appears to continue to under report the real experience of many households. Many continue to dip into savings to pay the bills.
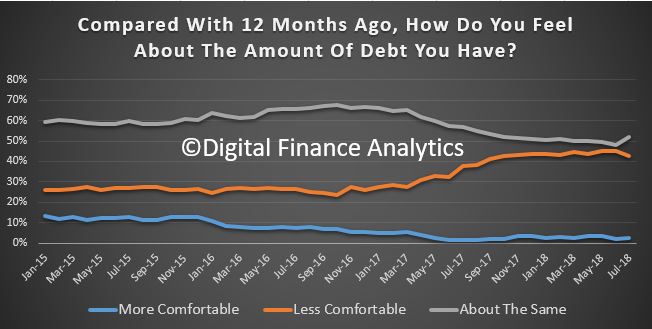
In terms of debts outstanding, there was a small fall in those reporting they were less comfortable, with 42% reporting compared with 44% last month. This is attributable to changes in interest rates, and refinancing, especially for owner occupied households with a lower Loan to Income ratio. Many with large mortgages also have other debts, including credit cards and personal loans which also require servicing. Around 52% reported no change in their debt, up 3.5%. Property Investors were more concerned overall.
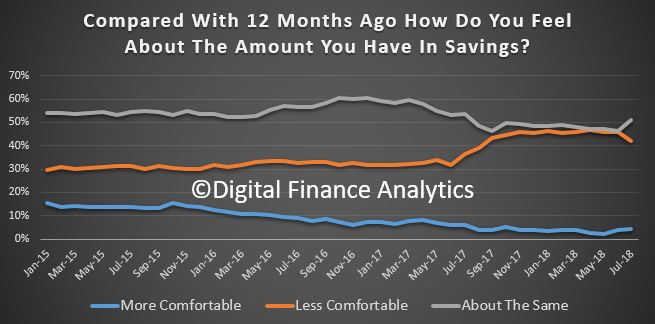
Looking at savings, those with stocks and shares have enjoyed significant gains (at least on paper) and recent dividends, so tended to be more confident. Some were able to benefit from higher savings rates on selected term deposits, though rates attached to on-call accounts continue to languish as lenders manage their margins. Around a quarter of households have less than one months spending in savings, so many are facing a hand to month situation with regards to their finances. Many of these households are in the younger age bands and have no savings to protect them should their personal situations change.
We noted in the survey that a number of households were actively seeking alternative savings vehicles as property and bank deposits look less interesting. We will have to see whether these alternatives are as attractive (in terms of risk-return) as some are claiming. We have our doubts. But then risk is relative.
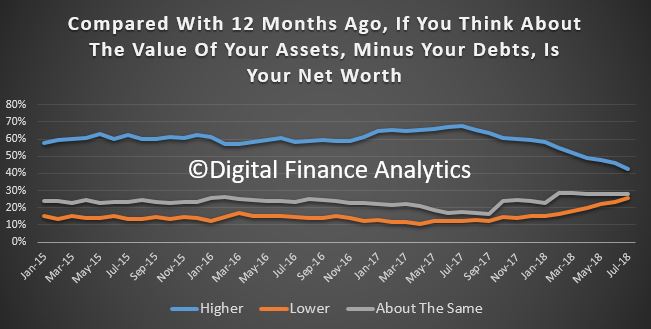
So finally, putting this all together, the proportion of households who reported their new worth was higher than a year ago continues to slide as property price falls continue to hit home, and as savings are raided to maintain lifestyle. 42% said their net worth had improved, down 3.75% from last month. 25.6% said their net worth had fallen, up 2.5% and 28% reported no real change.
We had expected to see a small bounce in the index this month as some incomes rise in the new tax year and other changes take effect. But the impact of the fading property sector, and cash flow constraints are likely to dwarf this impact. The only “get out of jail card” will be income growth above inflation, and as yet there is little evidence of this occurring. Thus we expect the long grind to continue.
Finally, the spate of attractor rates from the banks continues, in an attempt to keep mortgage volumes up. However, our research shows that many households cannot access them in the new tighter lending environment.
By way of background, these results are derived from our household surveys, averaged across Australia. We have 52,000 households in our sample at any one time. We include detailed questions covering various aspects of a household’s financial footprint. The index measures how households are feeling about their financial health. To calculate the index we ask questions which cover a number of different dimensions. We start by asking households how confident they are feeling about their job security, whether their real income has risen or fallen in the past year, their view on their costs of living over the same period, whether they have increased their loans and other outstanding debts including credit cards and whether they are saving more than last year. Finally we ask about their overall change in net worth over the past 12 months – by net worth we mean net assets less outstanding debts.
There’s a common link between the many things that have promoted insecurity at work: the growth of franchising; labour hire; contracting out; spin-off firms; outsourcing; global supply chains; the gig economy; and so on. It’s money.
At first, that seems too obvious to say. But I’m talking about the way financial concerns have taken control of seemingly every aspect of organisational decision-making.
And behind that lies the rise and rise of finance capital.
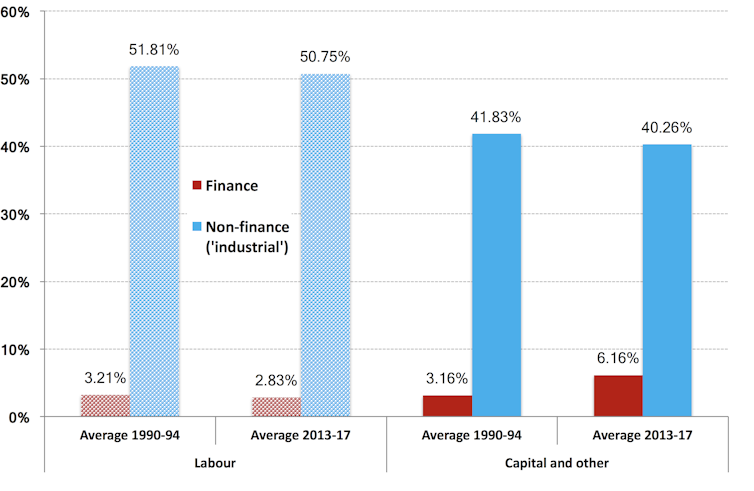
One way to see this is in the chart below. It shows the income shares of labour and capital, and the breakdown for each between the finance and non-finance (“industrial”) sectors, in two four-year periods. They were 1990-91 to 1993-94 (when the ABS started publishing income by industry) and, most recently, 2013-14 to 2016-17. (I use four-year periods to reduce annual fluctuations and show the longer-term trends. Here is more detail and explanation of methods.)
Income shares of labour and capital
Factor shares by industry, 1990-94 and 2013-17.Source: ABS Cat No 5206.0
The key thing to notice in the chart is that finance capital’s share of national income doubled (it’s the dark red boxes in the lower right-hand side of the chart), while everyone else’s went down.
So, over that quarter-century, the share of labour income (wages, salaries and supplements) in national income fell. In the early 1990s it totalled 55.02% — that’s what you get when you add labour income in finance, 3.21%, to labour income in “industrial” sectors, 51.81%. In recent years this fell to 53.58%. There were falls in both finance labour income (from 3.81 to 2.83% of national income) and industrial labour income.
The total share of profits and “mixed income” accordingly rose from 44.99% to 46.42%. The thing is, all of that increase (and a bit more) went to finance capital. Profits in finance went from 3.16% to 6.16% of the economy.
At the same time there has been a large increase in the share of national income going to the very wealthy — the top 0.1% — in Australia and many other countries.
This shift in resources does not reflect more people being needed to do important finance jobs. Nor is it higher rewards for workers in finance. The portion of national income, and for that matter employment, devoted to labour in the financial sector actually fell from 3.21% to 2.83%.
The economy devotes proportionately no more labour time now to financial services than it did a quarter century ago. Yet rewards to finance have increased immensely. The share of national income going to “industrial” sector profits and “mixed income” has declined.
In short, the widely recognisedshift in income from labour to capital is really a net shift in income from labour, and from capital (including unincorporated enterprises) in other industries, to finance capital.
Finance matters
You may have heard about “financialisation”. It’s not really about more financial activity. It is about the growth of finance capital and its impact on the behaviour of other actors.
Financialisation has led to finance capital taking the lead shareholdings in most large corporations, not just in Australia but in other major countries (to varying degrees) as well.
This role as main shareholder and, of course, chief lender to industrial capital has driven the corporate restructuring over the past three decades that has led to greater worker insecurity and low wages growth (as I recently discussed here).
When “industrial capital” has been restructured over recent decades — to promote franchising, labour hire, contracting out, spin-off firms, outsourcing, global supply chains, and even the emergence of the gig economy — it has been driven by the demands of finance capital. Casualisation is just one manifestation of this.
Short-term logic
Now there’s no conspiracy here (or, at least, the system doesn’t rely on one). There is actually a lot of competitive mindset in the financial sector. This is just the logic of how the system increasingly has come to work. Financial returns, particularly over the short term, have become the principal (really, the only) fact driving corporate behaviour.
This has come at the expense of human considerations.
That same logic is behind resistance to action on climate change. Continuing carbon emissions are the perfect, and deadly, example of short-term profits overriding longer-term interests.
Yet even finance capital is not monolithic. There are parts of finance capital that have a longer-term perspective (“there’s no business on a dead planet”). So they are effectively in battle with those parts of finance capital for which the short term is everything. The former want governments to intervene in, for example, carbon pricing.
Policy questions
All this leaves some big questions for policymakers about how to redress the new imbalance of power.
In part, it requires changing institutional arrangements (including industrial relations laws) that in recent years have made it much harder for workers to obtain a fair share of increases in national income. It requires rethinking of how we regulate work.
But it also requires rethinking of how we regulate product markets and financial markets.
The Australian Prudential Regulation Authority (APRA) has sought industry feedback on potential approaches to adjust the capital framework for authorised deposit-taking institutions (ADIs) to make capital ratios more transparent, comparable and flexible. Importantly, the proposals in this paper are not intended to change the quantum or allocation of capital.
The idea of harmonising with international comparable measures is a good thing in my book, but is this a case of “fiddling while Rome burns” in that the issues we are facing are more significant as lending is still too hot, and households are under the debt pump? But then APRA conveniently reverts to type with its narrow obsession on financial stability interpreted as capital ratios. Safe ground, but myopic.
In its current program of reform of the ADI capital framework, APRA is pursuing three principal objectives:
the quantum of capital – to achieve an overall level of capital that meets the ‘unquestionably strong’ aspiration set by the Financial System Inquiry (as set out in APRA’s July 2017 Information Paper);
the allocation of capital – to improve the risk sensitivity of current capital requirements, where possible, by more appropriately aligning capital requirements to underlying risks (as set out in APRA’s February 2018 Discussion Paper);
the comparability of capital – to improve the transparency, comparability and flexibility of the capital framework where possible, without materially jeopardising either of the other two objectives.
APRA is also considering measures to make the capital framework more flexible in times of stress. These measures include increasing the size of the Capital Conservation Buffer relative to the size of the minimum Prudential Capital Requirement and potential changes to the point of automatic regulatory interventions. Such realignment of regulatory capital ratios would enhance supervisory flexibility in times of financial or economic stress, either at an individual ADI level or for the banking system as a whole. It may also enhance the usability of capital buffers held by ADIs to manage their capital positions during periods of stress.
The prospective approaches are outlined in a discussion paper released today for industry consultation.
The approaches would not change the amount of capital ADIs are required to hold beyond the unquestionably strong capital benchmarks announced in July 2017.[1] Rather, APRA is considering whether to alter the way ADIs’ capital requirements are calculated and disclosed to facilitate greater domestic and international comparability and transparency of ADI capital strength.
Though Australia’s capital framework is largely based on internationally agreed minimum standards set by the Basel Committee on Banking Supervision, APRA takes a more conservative approach to the definition of capital and the calculation of risk-weighted assets in some areas. Consequently, Australian ADIs typically have lower reported capital ratios than overseas peers with comparable capital strength.
Chairman Wayne Byres said: “APRA’s robust capital framework improves the quality and quantity of the capital held by ADIs, but makes international comparisons more complex.
“The reliance of the Australian banking system on international markets for funding makes it important that investors understand and have confidence in their capital strength during ordinary times and in periods of market disruption.”
The discussion paper released today outlines two general approaches designed to aid ADIs in representing and communicating their capital strength:
Under one approach, ADIs would continue using existing definitions of capital and risk-weighted assets, but APRA would develop a methodology allowing them to improve the credibility and robustness of internationally comparable capital ratio disclosures; or Under a second approach, APRA would change the way ADIs calculate capital ratios to instead use more internationally harmonised definitions of capital and risk-weighted assets. To maintain the strength and risk-sensitivity of the capital framework, there would need to be corresponding increases in minimum ratio and/or capital buffer requirements.
APRA is open to considering these approaches independently or in combination, or indeed retaining its current methodology, and is seeking industry feedback on whether the benefits of the suggested approaches outweigh the regulatory burden and associated increase in complexity.
Separately, the discussion paper proposes measures to make the capital framework more flexible in times of stress, including by increasing the size of regulatory capital buffers relative to minimum regulatory capital requirements.
Mr Byres noted: “None of the changes under consideration would change the level of capital ADIs are required to hold to meet the unquestionably strong capital benchmarks. However, by modifying and realigning regulatory capital ratios, APRA will potentially have greater supervisory flexibility to react to situations of bank-specific or system-wide stress, and allow institutions to return to a position of sufficient capital strength.”
NAB released their Q3 Trading update and capital report today. They said that cash earnings declined by 1%, and compared to the prior corresponding period were down 3% reflecting higher investment spend and credit impairment charges.
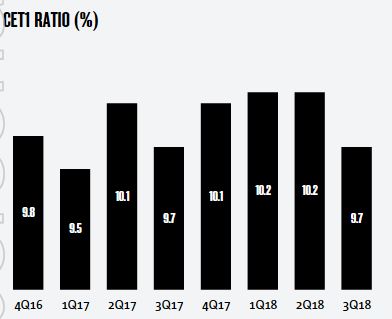
Their unaudited statutory net profit was $1.65 billion, and their CET1 ratio was 9.7%, which was down about 50 basis points from 1H18. The drop from 10.2% at March 2018, largely reflects the impact of the interim 2018 dividend declaration (63bps net of DRP) and seasonally stronger loan growth in the June quarter.
They expect to meet APRA’s ‘unquestionably strong’ target of 10.5% in an orderly manner by January 2020.
Their leverage ratio (APRA basis) was 5.3%, the liquidity Coverage Ratio (LCR) quarterly average was 132% and the Net Stable Funding Ratio (NSFR) was 113%.
While revenue was up 1% due to good growth in SME lending within Business & Private Banking and a strong contribution from New Zealand Banking, net interest margin declined slightly, reflecting elevated short term wholesale funding costs and ongoing intense home loan competition.
In addition, expenses rose 2% due to higher compliance costs, investment spend consistent with the accelerated strategy, and increased depreciation and amortisation.
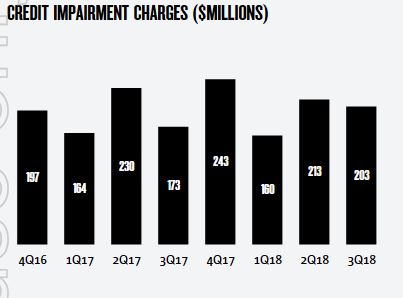
Credit impairment charges rose 9% to $203 million and included $25 million of additional collective provisions for forward looking adjustments (FLAs), bringing the total balance of FLAs to $547 million.
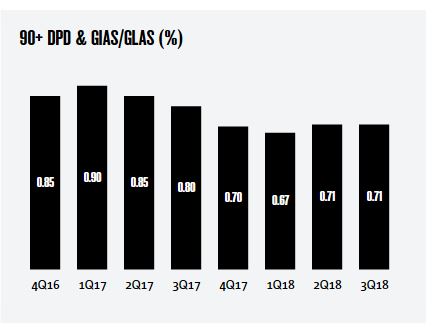
They say asset quality remains sound with the ratio of 90+ days past due and gross impaired assets to gross loans and acceptances steady at 0.71%.
However, 90-Day past due residential mortgage loans stood at $2,015 million, at 30th June 2018, compared with $1,956 million in March 18, so delinquencies are rising. Impaired facilities also rose a little. $20 million of mortgages were written off in the quarter, compared with $10 million in the prior quarter.
They also warned of further provisions for “unresolved compliance issues” in the next quarter. No guidance on the quantum, so far.
They reported that their priority Segments Net Promoter Score (NPS) declined from -9 in March to -14 in June, partly reflecting an overall industry decline, with NAB’s priority segments NPS now second of the major banks.
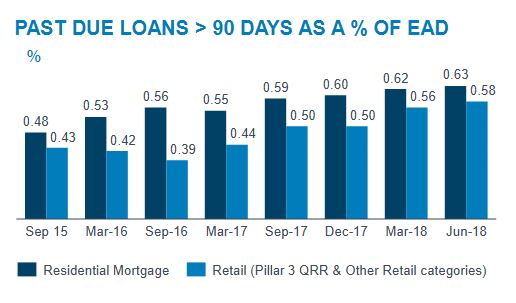
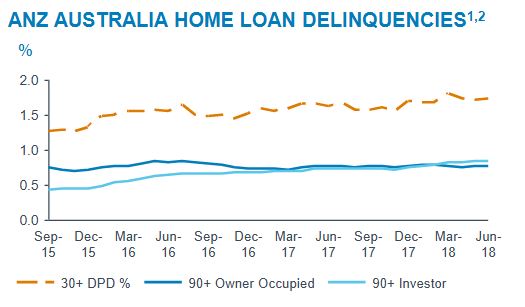
ANZ released their latest update today, and it shows the benefit of returning to its core retail business in Australia, and the release of capital resulting from this. Provisions were significantly lower, thanks to a shirking institutional book, but the home lending sector past 90 days continues to rise to 0.63%, up 10 basis points from March 2016. This is pretty consistent across the industry, despite ultra-low interest rates.
In fact their disclosure on home loans was quite revealing, with lower system growth, a focus on owner occupied loans, and a reduction in mortgage power. This underscore the credit tightening is not temporary.
The Bills/OIS spread has remained elevated suggesting margin pressure is in the wind.
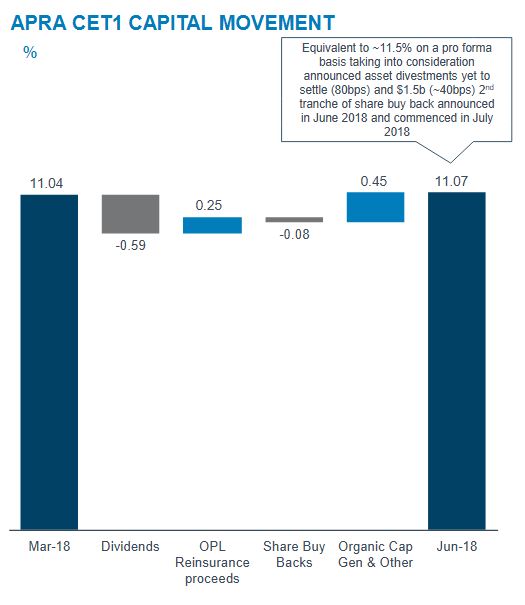
They said level 2 Common Equity Tier 1 (CET1) ratio was 11.07% at Jun-18, up 3bps from Mar-18 largely driven by: organic capital generation (+50bps) and receipt of reinsurance proceeds from the One Path Life (OPL) sale (+25bps); offset by the FY18 Interim Dividend (-59bps) and the share buyback (-8bps). 2018 interim DRP was neutralised.
The ¬$1.5bn of the announced $3bn on-market share buyback had been completed as at 30-Jun 2018.
Total Risk Weighted Assets decreased $2bn to $394bn driven by a $2bn reduction in CRWA. There was a $2bn reduction in CRWAs from net risk improvement across both Institutional and Retail businesses in Australia & New Zealand.
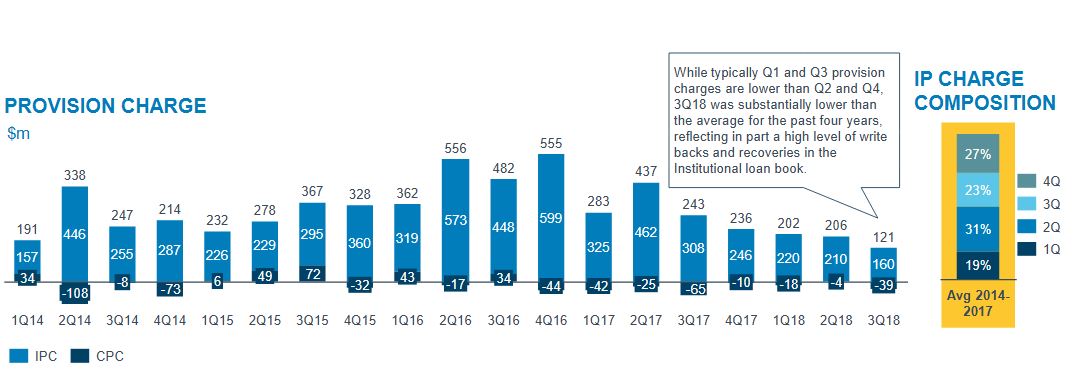
Total provision charge was $121m in 3Q18 with individual provision (IP) charge of $160m. The IP charge in 3Q18 was the lowest quarter since 2014, reflecting both the ongoing benign environment and improved quality of the portfolio
While typically Q1 and Q3 provision charges are lower than Q2 and Q4, 3Q18 was substantially lower than the average for the past four years, reflecting in part a high level of write backs and recoveries in the Institutional loan book.
ANZ has retained an overlay initially taken at 30 Sep 2017 in relation to the Retail Trade book which remains on watch.
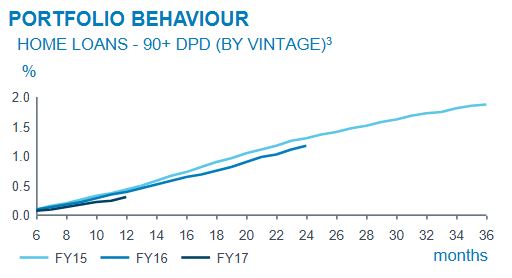
Australian Residential Mortgage 90+ day past due loans (as a % of Residential Mortgage EAD) was flat vs prior quarter. There are some pockets of stress in the mortgage book, primarily in Western Australia, more particularly in Perth itself.
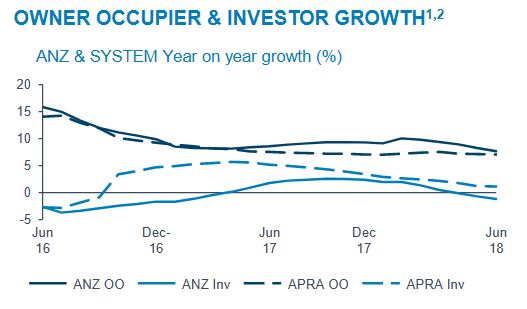
Throughout FY18 the Australian housing system has been characterised by slowing credit system growth, increased price competition, increased capital intensity and tighter credit conditions. As at end June 2018, YTD APRA System has grown 4.1%, down 18% vs. prior comparable period 5.3%.
ANZ’s ongoing focus is on the Owner Occupier Principal & Interest segment, with Owner Occupier loan growth of 4.4% annualised in the June quarter. Investor segment growth in the June quarter was -2.5% annualised.
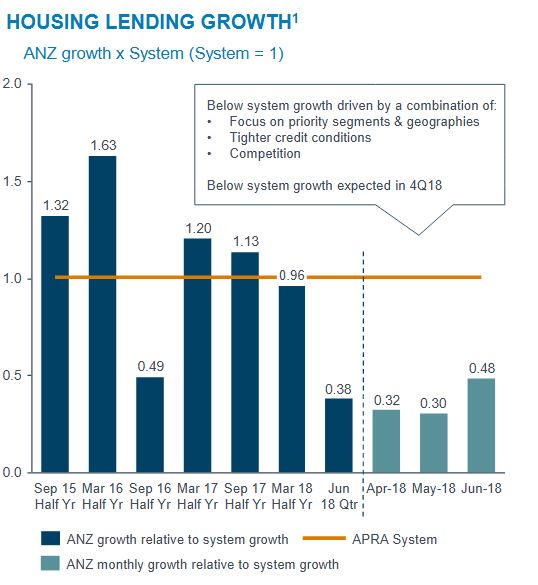
ANZ’s total Australian home lending portfolio grew at 0.4 times system in the June quarter (2% annualised growth).
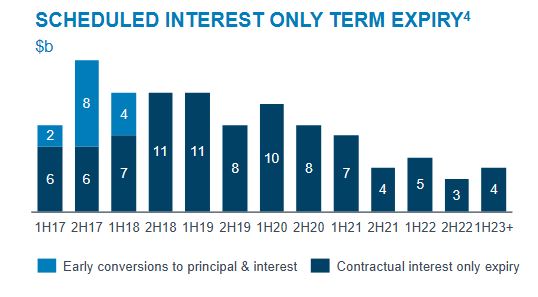
ANZ Interest Only home loan flows in the June quarter represented 13% of total home loan flows.
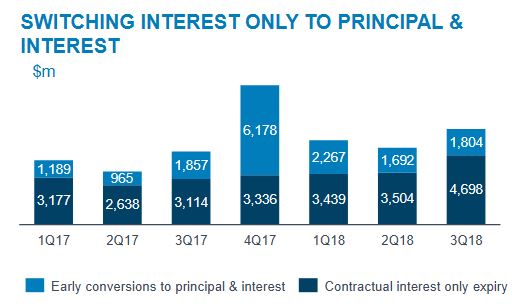
$6.5bn of Interest Only loans switched to Principal & Interest in the June quarter (3Q18), compared with $5.2bn in 2Q18,$5.7bn in 1Q18 and $5.6bn per quarter on average across FY17.
They show the expected rate of interest only loans peaking in the next year or so.
The combined impact of prudential responses over the past 3 financial years including various regulatory changes, together with subsequent policy changes by the banks, has been a meaningful reduction in the average maximum borrowing capacity for home loan borrowers. This suggests to us that there are higher risks in the back book, compared with new business being written now and confirms the reduction in “mortgage power” available to borrowers.
Following its expansion into the near-prime space, Bluestone, the non-bank lender has seen monthly application and settlement volumes double in less than six months, via Australian Broker.
July saw record applications and settlements for Bluestone in both Australia and New Zealand. The firm also reported a 96% increase in application volume and a 153% in settlements during the April-July period.
Near prime lending caters to borrowers who fall just short of qualifying for a prime loan. The firm sees massive opportunities in this as banks tightening lending criteria more and more borrowers, leaving more customers in this situation.
“It’s all well and good for us to move into near prime, but if we’re not keeping our DNA intact, that is, our high-touch service and the enthusiastic way we work with our brokers, it doesn’t hit the mark,” said Royden D’Vaz, Bluestone national head of sales and marketing.
“That’s why we’ve increased our staff numbers in our sales, lending and settlements teams to cater for the increased volumes, ” D’Vaz added.
In terms of market penetration, Bluestone notched a 55% increase in self-employed loans and a 115% increase in near prime loans for fiscal year 2017-2018.
“In addition to the growth in volumes, we have so many exciting things in the pipeline, with our team growing and a significant number of projects underway which will facilitate our growth into the future,” added Bluestone CEO, Campbell Smyth.
Bluestone’s move into near-prime follows its acquisition by U.S. private investment firm Cerberus Capital Management in February. The following month, Bluestone cut its interest rates by 75 to 105 basis points across its Crystal Blue products.
Bendigo and Adelaide Bank released their full year results today. And given everything, it was not a bad result. But margin pressures and questions about future home lending volumes haunt the sector, and Bendigo is no exception.
Australia’s fifth largest bank announced an after tax profit of $434.5 million for the 12 months to 30th June 2018, up 1.1% from the prior year. Underlying cash earnings were $445.1m up 6.4% on the prior year. They were lower in the second half.
Their cost to income ration fell 50 basis points to 55.6% and their return on equity was 8.23%, up 13 basis points. They called out increase compliance costs, a 3.5% rise in staff salaries, higher software amortisation and “2H18 negative jaws”.
Total gross loans rose 1.4% to $61.8 billion, home lending grew below system at 4.7%, and retail deposits stayed steady at 80.2%, growing at 0.9% in the year.
They reported a margin of 2.36%, up 14 basis points, but the exit margin is falling, reflecting pressure in the market. Deposits were repriced by 11 basis points over the year, especially in the second half.
There was a significant fall in “other income” with lower ATM fees, lower trading book income and a range of other factors. It fell 9.2% on the prior year from $309.7 million to $281.2 million this year. This is reflective of industry-wide pressures.
While business arrears fell slightly, there were rises in 90+ past due in WA, QLD and NSW/ACT rising, so the portfolio risks rose. Keystart loans were included from June 2017.
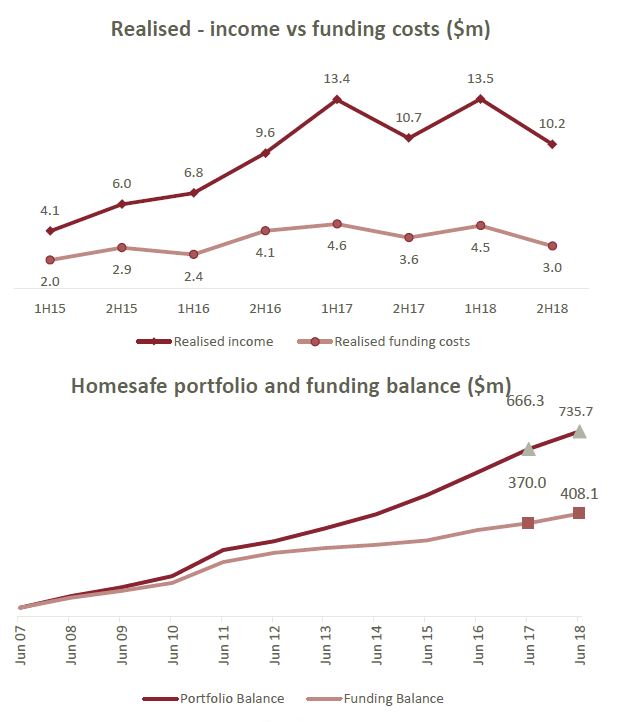
Homesafe’s overlay reflects an assumed 3% increase in property prices in the next 18 months, before returning to a long term growth rate of 6%.
Great Southern past due 90 days was $50.5 m, down 36% from June 2017.
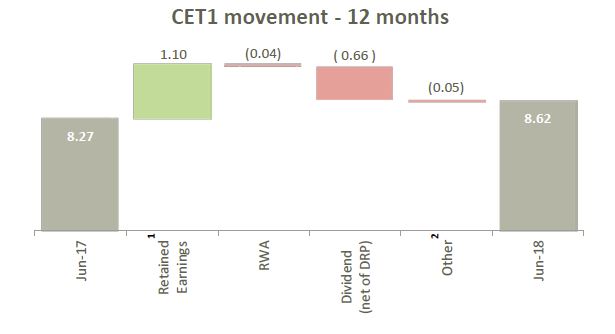
Their CET1 ratio rose 35 basis points since June 2017 to 8.62%. Their total capital rose 39 basis points to 12.85%.
AASB9 lead to an increase of $112.8 expected loss and the increase was taken through retained earnings as at 1 July 2018. CET1 ratio will decreased by 8 basis points on 1 July 2018.
They said their last RMBS transaction was in August 2017 for $750m, they are evaluation the new APRA credit risk proposals, and work toward advanced accreditation is continuing (though we think the benefit is being eroded). Their liquidity coverage ratio is 125.6% and the Net Stable Funding ratio at 109% at 30 June 2018.
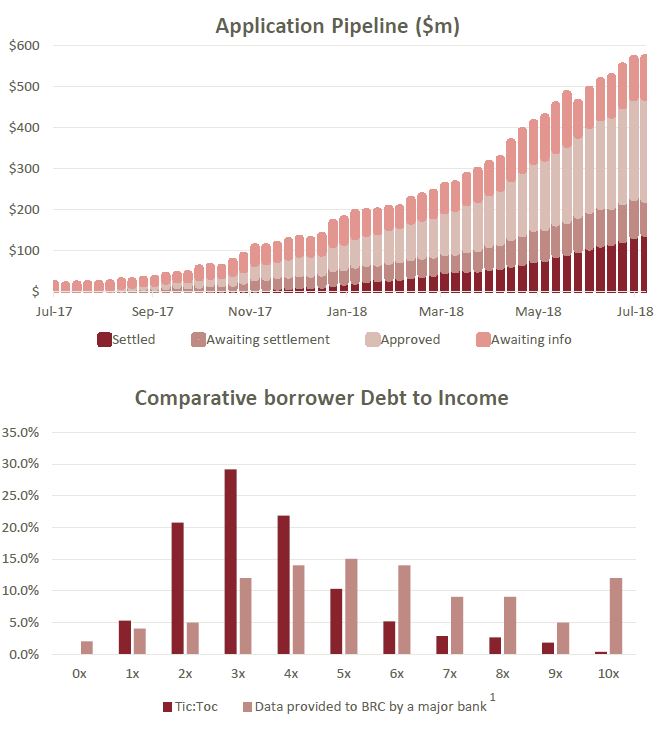
They also disclosed data from Tic:Toc, the quick approval lender, with $1.36bn of submitted applications and $170m loan portfolio.
Welcome to the Property Imperative weekly to 11th August 2018, our digest of the latest finance and property news with a distinctively Australian flavour. Another week, more data, so let’s dive straight in.
And by the way, if you value the content we produce please do consider joining our Patreon programme, where you can support our ability to continue to make great content.
Watch the video, listen to the podcast or read the transcript.
We start with the trauma from Turkey which showed how fragile the financial markets are at the moment. Turkey’s finance minister (the President’s Son in Law) unveiled a new plan for their economy. The new economic stance will be one with “determination” — that’s a key part of it, he said. It will “transform” Turkey’s economy. It will also have a “strategic” and “powerful infrastructure.”
U.S. President Trump has repeatedly lashed out at Turkey over the continued detention of pastor Andrew Brunson, whom Turkish officials accuse of terrorism for his part of the failed 2016 coup, and no progress was made as delegates from both NATO countries met in Washington this week. Then Donald Trump, tweeted that he would double tariffs on Turkish steel and aluminum products.
As a result, the Turkish Lira plummeted further. In the course of an hour, it reached a new low of 6.80 to the dollar, marking its worst daily performance in over a decade. This from Bloomberg:
It recovered a little afterwards, but it has lost about 40% of its value against the dollar since the start of the year.
Many fear the fallout could spread beyond Turkey’s border, prompting traders to abandon riskier assets like stocks in search of safe-havens like gold, yen and Treasuries. Volatility, as measured by the VIX “fear index”, rose nearly 17%, highlighting investor concerns about the broader impact of a possible crash in Turkey’s economy.
One analyst said the exposure to a slump in Turkey’s economy is “pretty international,” though limited to the banking sector, but data from the Bank for International Settlements showed that Japanese banks are owed $14 billion, U.K. lenders $19.2 billion and the United States about $18 billion. Enough to make a dent.
The Turkish Lira also moved the same way against the Euro, up 14.33%. “We’re not going to lose the economic warfare” being waged against Turkey said President Erdogan.
In the US, core consumer prices rose by their quickest pace in a decade in July and topped market forecasts, keeping the Federal Reserve on track to raise interest rates twice more this year. The data add to a robust picture of the US economy, which grew by a speedy annual rate of 4.1 per cent in the June quarter. The unemployment rate is close to its lowest level in 18 years. Core inflation, which strips out volatile energy and food prices and is closely followed by the Fed, rose 2.4 per cent year on year in July and up from 2.3 per cent in June. That was the fastest annual pace of core inflation since September 2008.
While headline inflation is rising more quickly than average hourly earnings, wages may pick up given the strength of the labour market. The Fed seems well positioned to carry on tightening policy at its current pace, with no reason to either speed up or slow down. That said, the Turkish situation took the probability of two more cuts down a little according to Bloomberg.
The US dollar was relatively steady following the inflation data. The DXY index, tracking the US currency against a weighted basket of global peers, was up 0.8 per cent following the inflation figures, having been up 0.6 per cent before the data release. The index rose above 96 on Friday for the first time in 11 months.
Looking at the US indices, the NASDAQ slipped 0.67% to 7,838 on Friday, while the DOW Jones Industrial slipped 0.77% to 25,313. Gold futures slide a little to 1,219 and Copper was down 0.74% to 2.75. Oil futures rose 1.45% to 67.78, as the International Energy Agency warned that the recent cooling in the market may not last. Bitcoin was weaker, down 6.03% to 6,153, not helped by the news that creditors of the defunct coin exchange Mt. Gox are trying to recoup money.
European shares also fell on Friday as worries over a dramatic fall in the Turkish lira jolted financial markets amid concerns of the region’s banks’ exposure to upheaval in Turkey. The Germans DAX fell 1.99% to 12,424.
Asian stocks closed mostly lower on Friday as global investors opted to sell risk assets while they also continued to assess the impact of the latest tit-for-tat in the trade war between the U.S. and China.
China’s Shanghai Composite index managed to eke out meagre gains on high volatility. The index had recorded seven straight swings of 1% or more, the longest stretch since Chinese markets crashed in 2015.
In other emerging markets currency, the Russian rouble continued its decline, hitting fresh two year lows, after the US imposed fresh sanctions against the Kremlin for its alleged part in poisoning a former British spy and his daughter in the UK. It closed at 67.71, up 1.52%.
The Aussie continued to slide, as expected, down 1.04% on Friday to 72.96. And we also slipped against the British pound, down 0.63%.
Trade Tariffs continue to worry the market, with Fitch suggesting there is every reason to believe the United States’ trade dispute with China will get worse before it gets better, and that the US trade deficit will widen further rather than shrinking.
Now that they are on the receiving end of US tariffs, Chinese policymakers have three options. First, they could capitulate, by scaling back many of the “discriminatory practices” identified in the US Trade Representative’s March 2018 report on technology transfers and intellectual property. So far, there is no indication that China is considering this option. Second, China could escalate the dispute. It could set its own tariffs higher than those of the US, apply them to a larger range (and greater dollar value) of US exports, or offset the impact of US tariffs on Chinese exporters by allowing the renminbi to depreciate against the dollar. Alternatively, policymakers could look beyond trade in goods to consider capital flows and related businesses associated with US firms, effectively allowing the authorities to impede US financial and nonfinancial firms’ Chinese operations. As with the first option, this one seems unlikely, at least at this stage of the dispute. So far, China has chosen the third option, which lies between capitulation and escalation. China has retaliated, but only on a like-for-like basis, matching US tariff rates and the dollar value of trade affected. At the same time, it has tried to claim the moral high ground, by eliciting international condemnations of protectionism and unilateralism. This hasn’t been difficult, given that several other major economies are currently facing US tariffs. Securing such third-party buy-in is critical for the Chinese leadership’s domestic position. If the government were perceived at home as being bullied by the US, it would have to take a much tougher line in the trade dispute.
Fitch thinks that the US actually has rather limited options, despite having initiated the dispute. Even for a notoriously unpredictable administration, a full and unconditional reversal on tariffs seems out of the question. But so is the status quo, now that China has already levelled the playing field by retaliating in kind. That leaves only escalation – a possibility that the Trump administration has already raised by threatening additional tariffs on all imports from China
With the US locked in a trade war with China and other nations, Gregory Daco at Oxford Economics suggested that higher tariffs could gradually filter through to producer and consumer prices, supporting expectations of a gradual pick-up of inflationary pressures.
Locally, the RBA released its quarterly Statement on Monetary Policy with updated forecasts for inflation, unemployment and economic growth. The central bank has downgraded its inflation forecast for 2018. The RBA now expects both core and underlying inflation to rise by 1.75% to December 2018, down from the May forecasts of 2.25% and 2% respectively. Beyond that time frame, the central bank kept its inflation forecasts relatively unchanged. Previously, it expected both core and underlying inflation to reach 2.25% by the middle of 2020. In Tuesday’s rate announcement, Lowe also said that “a further gradual decline in the unemployment rate is expected over the next couple of years to around 5%”. The bank has maintained its forecasts that the unemployment rate will stay at around 5.25% through to June 2020, before dropping to 5% in December.
It’s also worth looking at Lowe’s speech on Wednesday, when he said that “Electricity prices in some cities have declined recently after earlier large increases, and changes in government policy are likely to result in a decline in child care prices as recorded in the CPI,” Lowe said. “There have also been changes to some state government programs that are expected to lead to lower measured prices for some services.” In Tuesday’s rates decision, Lowe said “the central forecast is for inflation to be higher in 2019 and 2020 than it is currently”.
The central bank slightly bumped up its forecasts for GDP growth in Q2 2018, to 3% from 2.75%. Longer-term, the bank’s growth projections were little-changed. It still expects GDP growth to average 3.25% over the next two financial years, before falling to 3% in June 2020 and remaining at that level through to December.
Given the projections were the first to include a time frame out to December 2020, the forecasts confirmed that underlying inflation pressures are expected to remain low for at least the next two and a half years. The latest set of projections confirmed that the RBA still looks set to keep interest rates on hold for the foreseeable future.
The Royal Commission hearings were back with avengence this week, with NAB’s MLC Wealth management business in the spotlight first, and later in the week IOOF. We saw more of the poor cultural norms on display, with investors being charged for no service, and attempts to block the release of documents and the late delivery of evidence to the commission. In fact, the CEO of NAB went as far as releasing an apology in Twitter. NAB shares ended up slightly to $28.09.
Shares in IOOF, Australia’s second largest wealth manager fell as senior executives from the fund manager appeared before the commission. At the close, the shares were down 2.7% to $8.73. Questioning in the royal commission centred around payments to related parties and the flow of cash back to the super fund from external fund managers when IOOF invests in those funds. Michael Hodge, senior counsel assisting the royal commission, said: “One of the things we are trying to understand is how trustees go about dealing with these volumes based fees where a percentage of the investment of the trust’s money is being paid to another part of the retail group.” Tendered to the commission today was a letter from prudential regulator APRA to IOOF about the conflicts of interest between members of the IOOF super fund and shareholders of IOOF.
The bottom line, is that poor corporate behaviour and the inability of regulators to get to the key facts was again in evidence, and again, consumers lose out as a result. It is shameful.
The CBA’s full-year results to 30 June 2018 (FY18) highlighted the pressure on Australian banks with an increase in wholesale funding costs squeezing CBA’s net interest margin in 2H18, slower loan growth and continued investment into the business and compliance contributed to higher expenses. Mortgage arrears also trended upwards due to some pockets of stress, and while they have not translated into higher provision charges as yet due to strong security values, continued moderation in Australian house prices may result in higher provisioning charges in future financial periods. CBA shares were up 0.03% on Friday to 75.39, and several commentators are claiming the worst is over for them, unlike for AMP, who also reported, and whose shares remain in the doldrums, reflecting the major changes to turn that ship around. Suncorp also reported and they did pretty well in the tight market, their shares rose after their results, and now stands at 15.63.
However, expect more bad news ahead, placing pressure on profit growth for all Australian banks. Increased regulatory and public scrutiny of the sector may make it difficult for the larger banks to reprice loans to incorporate the increase in wholesale funding costs, meaning net interest margins are likely to face some downward pressure. Loan growth is likely to further slow as the housing market continues to moderate, while compliance costs continue to rise due to the scrutiny on the sector. And of course the most prominent scrutiny is the royal commission into misconduct in the banking, superannuation and financial services industry, which has already identified a number of shortcomings within the industry.
That said, CBA’s FY18 results show a level of resiliency despite these issues. The bank reported cash net profit after tax from continuing operations declined 5% to AUD9.2 billion in FY18, but this was driven by a number of one-off charges, including a AUD700 million fine to settle a civil case in relation to breaches of anti-money laundering and counter-terrorism financing requirements. Cash net profit after tax from continuing operations rose by 4% to AUD10.0 billion when the one-off items were excluded.
CBA has much more to do to fix its reputation, and strong capital ratios are not sufficient to allay the concerns in the business. It is more about culture and putting customers first.
So, perhaps no surprise this week, the Greens called for the big banks to be broken up. They said “It’s time that banks became banks again. Australians are sick and tired of these massive financial institutions getting away with murder because they can throw stacks of money at the two old political parties. Our banks should be working for us, not against us and this policy will make sure that happens.
Under the Greens proposal: Banks will no longer be able to own wealth management businesses that both create financial products and spruik them to unsuspecting customers. Consumers will be able to easily distinguish between the simple and essential products and services that the vast majority of Australians use—deposits and loans, superannuation and insurance—and the more complex and selective activity that is the domain of big business, the wealthy, and the adventurous. By removing hidden conflicts of interest, Australians will be able to trust that the advice they’re getting from their banker is designed to line their own pocket, not the other way round. The watchdogs have failed. They would strip ASIC of its responsibility for overseeing consumer protection and competition within the essential services of basic banking, insurance and superannuation and return them to the ACCC.
But we believe there is much more to do than just breakup the banks. We will be discussing this in a future post. The major banks have too much market power, as we discussed on our recent video How Much Market Power Do “The Big Four” Hold? and they continue to milk customers using poor business practice, for example in the home loan market, the mortgage rate you get is hard to compare, and obtuse. We discussed this in our show “Price Information In the Home Loan Market”.
You might also like to watch our show on the latest lending statistics and mortgage stress data, “Lending, Stress and All Things DFA”, as we are not going to have time to cover these today.
So quickly to the property market. Once again prices continue to fall in the main centres of Sydney and Melbourne.
In terms of auctions, CoreLogic says that last week the number across the combined capital cities fell with 1,324 held with a final clearance rate of 54 per cent, down from the previous week. Combined clearance rates have levelled out somewhat remaining within the low to mid 50 per cent range for 13 consecutive weeks. They note that despite the continued slowing in the market, clearance rates are still tracking higher each week relative to the same period in 2012; during the last significant downturn in home values.
Melbourne’s final clearance rate came in at 57 per cent across 629 auctions last week compared with 911 last year returning a substantially higher clearance rate of 73.9 per cent. Sydney’s final auction clearance rate fell to 51.9 per cent across 462 auctions last week, down on the previous weeks. In same week last year, 620 homes went to auction and a clearance rate of 66.4 per cent was recorded.
This week, 1,320 capital city auctions are currently being tracked by CoreLogic; remaining relatively steady on last week’s final result which saw 1,324 auctions held. Over the same period one year ago, there was a considerably higher 2,040 homes taken to auction.
In June, according to the latest ABS housing finance data, first-home buyers accounted for 18.1% of the growth in owner-occupier loans, continuing a trend seen throughout this year. The chart from the RBA helps illustrate the effect that first home-buyers are having on the market. Clearly, there’s a trend underway in Sydney and Melbourne: The value of cheaper homes is holding up, while more expensive home prices have gone into reverse.
This is explained by increasing incentives in NSW and Victoria for first time buyers, and also more lower priced small apartments are coming on stream. The figures tie in with recent trends evident in the Sydney market, with more evidence of recent price falls among higher-end properties valued above $2 million.
Of course the question is, with prices falling, and likely to continue to fall further, could first time buyers get a better deal later by waiting for further falls. That, in my view is a tricky call but our modelling of future credit growth suggests first time buyers will continue to prop up the lower end of the market for some time to come yet.
And finally today, mark your diary, the next DFA live stream event will be on Tuesday 21st August at eight PM Sydney. I will be providing more information shortly about the event, but is already scheduled on the channel if you want to set a reminder. And feel free to send questions in beforehand.