
In NAB’ results today they included this slide on the gross income distribution of households in their mortgage portfolio. Gross income is defined as total pre-tax unshaded income for the application. This can include business income, income of multiple applicants and other income sources, such as family trust income. And it relates to draw-downs from Oct 17 – Mar 18. ~35% of transactions have income over 200K for owner occupied loans, and ~47% for investment loans.
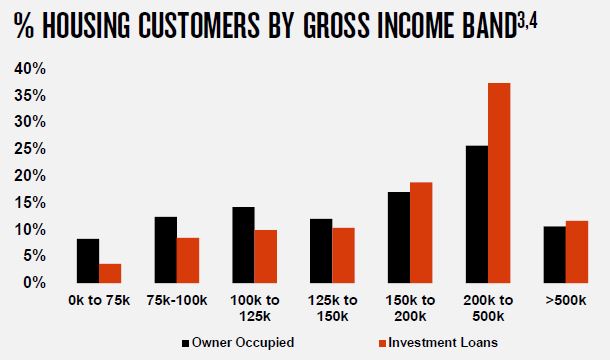 Now, I recognise that NAB has a skewed demographic in their customers, but, the proportion of high income households looked odd to me.
So I pulled the household income data from our surveys, including only mortgaged households. We also ask for income on a similar basis, gross from all sources. And we plotted the results:
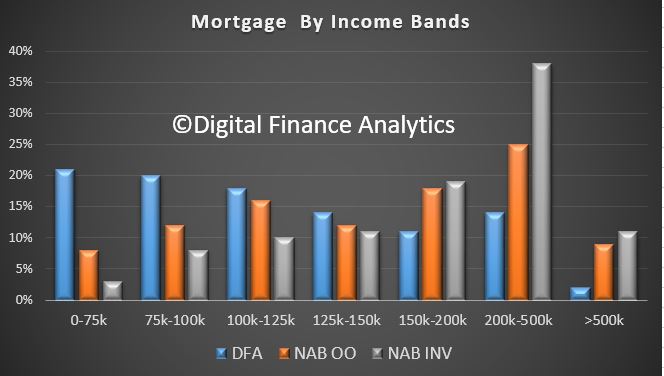 The blue bars are the household gross income across the country for mortgaged households. The next two are a replication of the NAB data sets above.
Either they are very, very good at targetting high income customers, or incomes in their system are being overstated. I will let others decide which is the correct answer. What do you think?