I catch up with George Markoski, the Founder and CEO of Positive Property Solution Australia. We discuss the thorny question of property investing, and why so many investments fail, while others work well. What are the key metrics to consider, and what suburbs are best – and whats the minimum period realistically to see consistent returns? His answers may surprise you, as he speaks from his own experience across nearly 40 properties. We found common ground on many aspects of investing in property!
Note DFA has no commercial relationship with Positive Property Solutions and we are not endorsing his approach. As always it is important to research the specific characteristics of individual markets, and do you own due diligence.
🚨BEWARE OF SCAMMERS🚨
As there are accounts impersonating Walk The World in the comments on YouTube, note that our comments will have a distinguishable verified symbol. And remember that we will never message you asking you to give us money or talk to us on other platforms such as WhatsApp or Telegram
Go to the Walk The World Universe at https://walktheworld.com.au/
Here is an excellent article from Nucleus Wealth which spells out the true issues around property investment. So many investors have their heads in the sand!
The net effect is that at current prices, finding scenarios where property won’t lose you money over ten years is not that easy. Which means most buyers in today’s market should be doing so as a lifestyle choice rather than as an investment choice.
Recently, we have seen a few Nucleus investors cash in their capital and profits and take the real estate plunge. This, of course, is sometimes more a lifestyle choice than an economic one. Being locked five months in a small flat with a partner and boisterous progeny while working off a kitchen table can often change one’s perspectives.
So what can economic conditions do I need to retain my deposit?
Given this is more about sanity than economics I start from the position that I am happy to walk away with no real profit after 10 years but I want to at least retain close to my initial capital.
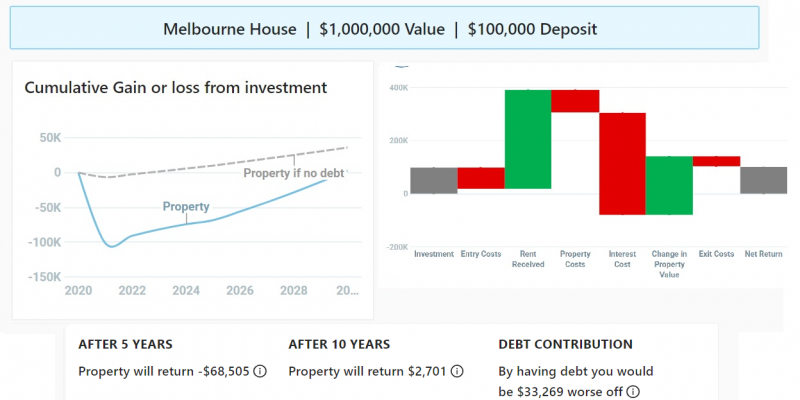
To look at the various implications we will use the Nucleus Wealth Property calculator. To start I need some initial details. Let’s take the case of my son as a working example. Say he is in Melbourne, has $100K saved for the deposit and has found his dream house available for $1m. The banks are willing to lend him the balance – no mean feat in this credit environment. Let us assume he intends to live in this house so there are no negative gearing tax benefits and he intends selling it in 10 years to move to the Bahamas as he expects to be an empty nester (a true dreamer).
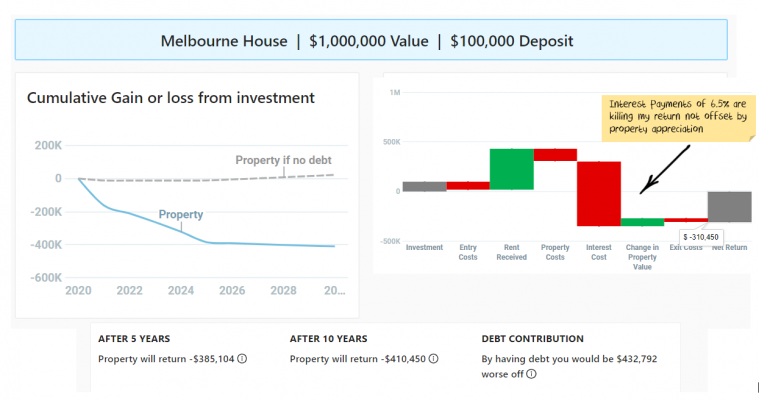
Thus using our Property Calculator and given we are optimists expecting a recovery from the COVID downturn we choose “Good Economic Conditions”, and use all the designated defaults to get:
Gulp!.. that’s not good… The problem with good economic conditions is that interest rate rises will limit your capital growth, and with 90% debt load the interest payments hurt. Note we are using rent received as rent “avoided” in these scenarios.
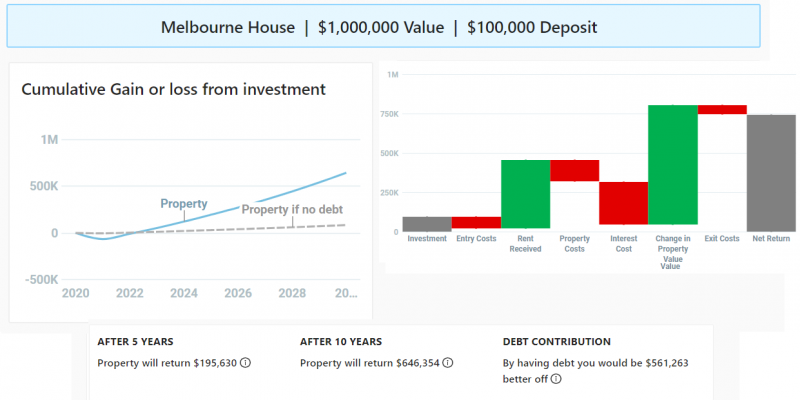
Perhaps we need to be even more optimistic so we choose “Property Paradise” conditions…which yields:
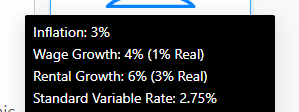
That’s more like it!! he can now afford a jacuzzi and a seaview. However a quick look at the underlying assumptions for Property Paradise yields …
While we are optimists, alas I am also a realist…. I tell him it is highly improbable he can lock-in 2.75% for 10 years, nor do I believe a 6% nominal Rent Growth year after year is realistic.
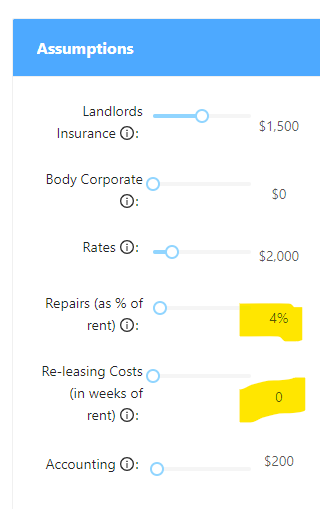
Thus we decide to input our own assumptions.
The first thing to note about the calculator is that by default it is designed for property investors that intend to rent their property. Thus as an owner-occupier (and as we are misers) we can reduce the re-investment in the property (depreciation rates to $600+halving repair assumptions) and dial down the other costs. The rental income should be viewed as money saved not paying rent, so the variables about lost rent/vacancies can be dialled down to 0.
That done, now we come to the key assumption for the calculator (and the investment outcome). What is my expectation for property prices? Investing in property implies we have an expectation property prices will recover over the next 10 years. This expectation of a property price rise can be incorporated into the calculator in a number of ways:
decreasing the Gross Rental yield
increasing the Mortgage Cost / Wage ratio
increasing the Property Price / Wage ratio
or increasing the default setting of the Mortgage Cost / Rent ratio.
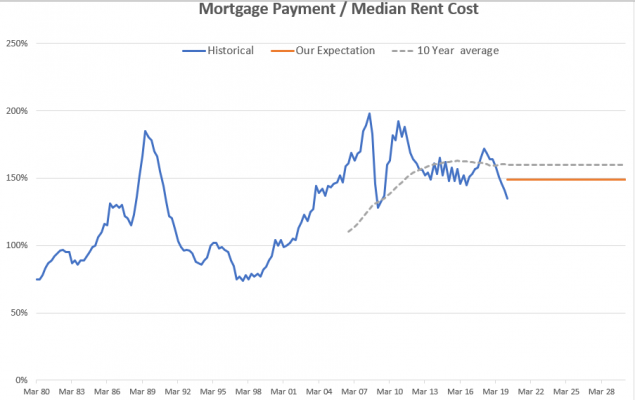
We choose to alter the ratio of Mortgage Cost to Rent ratio as it is probably the easiest ratio to get a handle on. Data suggests this ratio is currently at 134%, but the long term graph suggests the 10-year average is closer to 160%.
With our expectation of post-COVID economic recovery and a resumption of Immigration to drive property demand, we take the view that this ratio should retrace toward its 10 year average of 160% (I chose to use 148% a rough midpoint between these values).
With that key assumption locked in, it is time to pull the various economic levers (inflation, rental growth, mortgage rate) to find a breakeven investment such as:
So what economic expectation does my break-even result imply?
The inflation rate would need to be 2%. This is at the lower end of the RBA band of 2-3% so not an unreasonable forecast over ten years, even if inflation is unlikely to be there anytime soon.
Rental growth needs to be 2.5% (+0.5% real). Over a ten year period this is possible. Given the slump in rents, and lack of immigration it is going to need a lot of growth in the second half of the decade.
Lastly, I need to pay an average 4% mortgage rate over the 10 years. While historically this is unprecedented, we are in atypical times and low-interest rates look to persist. A quick internet search shows Credit Unions are offering a 10 year fixed rates that are not too far off this mark, so perhaps it is an achievable goal.
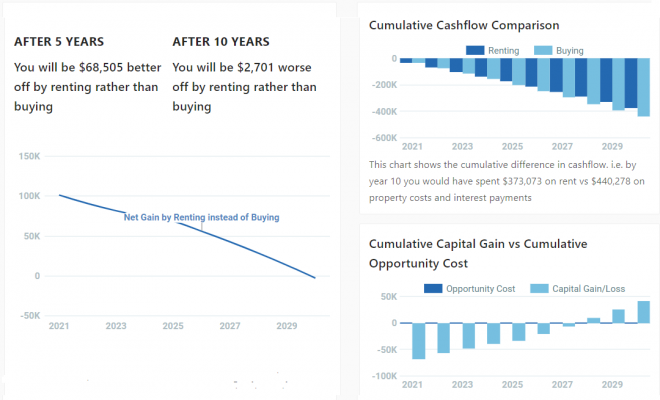
As a good cross-check, using the “Compare Renting vs Buying” function in the calculator, we can confirm we are near break-even (with an assumed 0% return on the $100K over the period).
The calculator also highlights how the benefit of a geared property is mostly achieved at the tail end of the investment. i.e. if he only stays in the property for 5 years, he will be about $60k worse off than if he rented for the same period. i.e. on the assumed property with stamp duty, mortgage insurance and other entry costs he will be out over $80k. Add in $20k to sell the property on the other side and his $100k is gone, relying on capital growth to make up the difference.
Where to from here?
Using the calculator we can thus find other scenarios that achieve break-even property result (1.5% inflation, 2% real Rental growth which then means I can lock in a more attainable 4.5% mortgage rate). Alternatively, a more aggressive property price forecast of 160% (i.e. the 10-year average) mortgage cost to rent ratio means inflation could be 3%, rental growth of 3.5%, and my mortgage interest rate can now be a very achievable 5%.
Armed with these base-line cases a user can now test the sensitivities of these assumptions or explore their own expectations to assess the risks/benefits involved in not persevering with living and working on that kitchen table.
The net effect is that at current prices, finding scenarios where property won’t lose you money over ten years is not that easy. Which means most buyers in today’s market should be doing so as a lifestyle choice rather than as an investment choice.
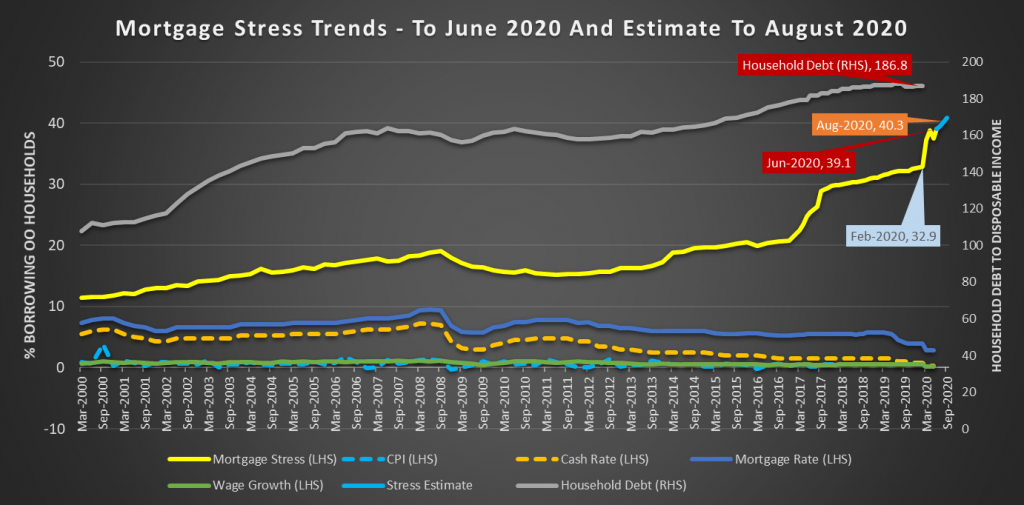
Digital Finance Analytics has released the results of our rolling 52,000 household surveys to the end of June, which reveals that mortgage stress rose to 39.1%, compared with 37.5% in May. In addition, rental stress was 39.4%. Moreover, a larger number of property investors with a mortgage (51.3%) are underwater from a cash-flow perspective. This is new analysis which suggests investors are caught in the financial crisis headlights.
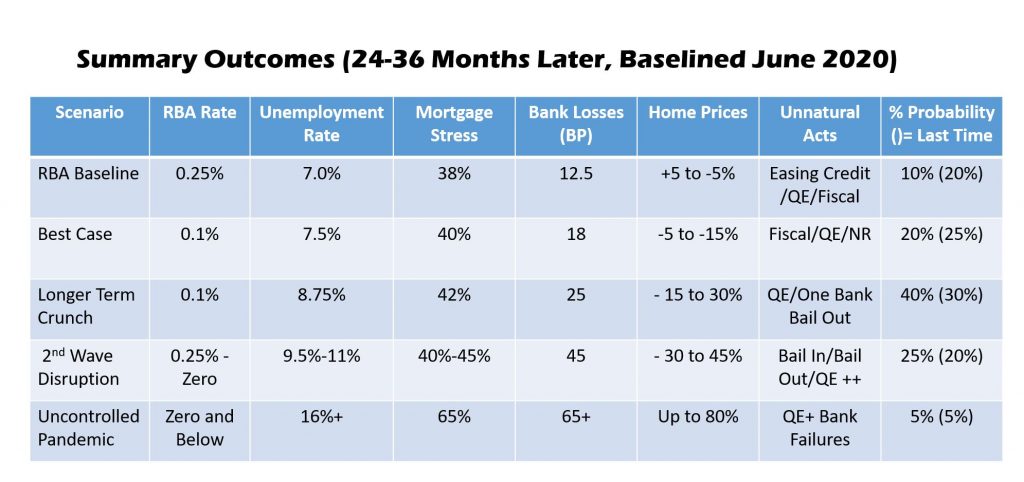
We discussed all this on our live stream last night, where we also updated our price scenarios:
June Mortgage Stress Update
We measure stress in cash-flow terms, money in, money out, rather than a set percentage of income dedicated to paying mortgage or rental payments. If the net income flows are lower than the net payment outflows, households are classified as stressed. These households will cut back on expenditure, put more of credit cards, or tap into deposits. While, they may have access to other assets – for example investment properties or share portfolios, negative cash flow remains a significant challenge.
This equates to 1.47 million owner occupied mortgage holders under financial pressure, and 1.7 million households in rental accommodation. More than 820,000 property investors are in difficulty.
The complex interplay of higher unemployment, JobSeeker and JobKeeper, together with the 490,000 mortgages with payment deferrals provides the backcloth for our analysis. However, by examining the financial flow status of households we have noted some realignment of households in the past month, with more casual and part-time workers able to return to work, but a significant rise in structural unemployment as larger companies, such as larger retailers, big consulting firms, and finance firms, make reductions in staff. These permanent cuts reflect the rightsizing of businesses in reaction to the economic downturn. Then we have the new Melbourne lock-down.
Mortgage Stress
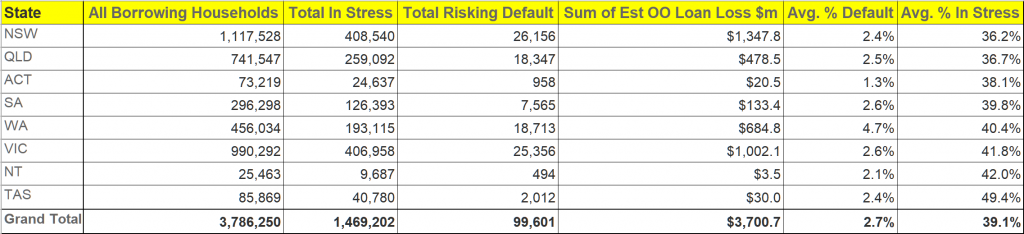
Turning to the detailed analysis, across the states, Tasmania has the highest proportion of households in mortgage stress, at 49.4%, followed by the NT and Victoria. However, the largest counts of stressed mortgage holders are in NSW, with 408,540 and VIC with 406,958. The highest risk of default rates are found in WA at 4.7%, VIC at 2.6% and SA at 2.6%.
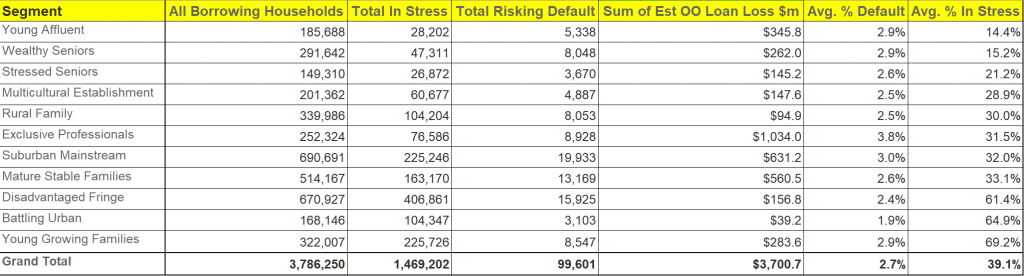
Within our household segments, the highest mortgage stress levels are among Young Growing Families, at 69.2% of households, which includes cohorts of recent first-time buyers, with more than 225,000 households at risk. Next, those on the urban fringe, are also exposed, along with more typical battlers. We are also seeing a rise in affluent stress, where households on higher incomes are experiencing significant issues. The Exclusive Professional segment, the top few percent on an income basis, include 31.5% stressed, which equates to more than 76,000 households across the country. Significantly, in value terms, they hold around 28% of all default risk to the banks by value.
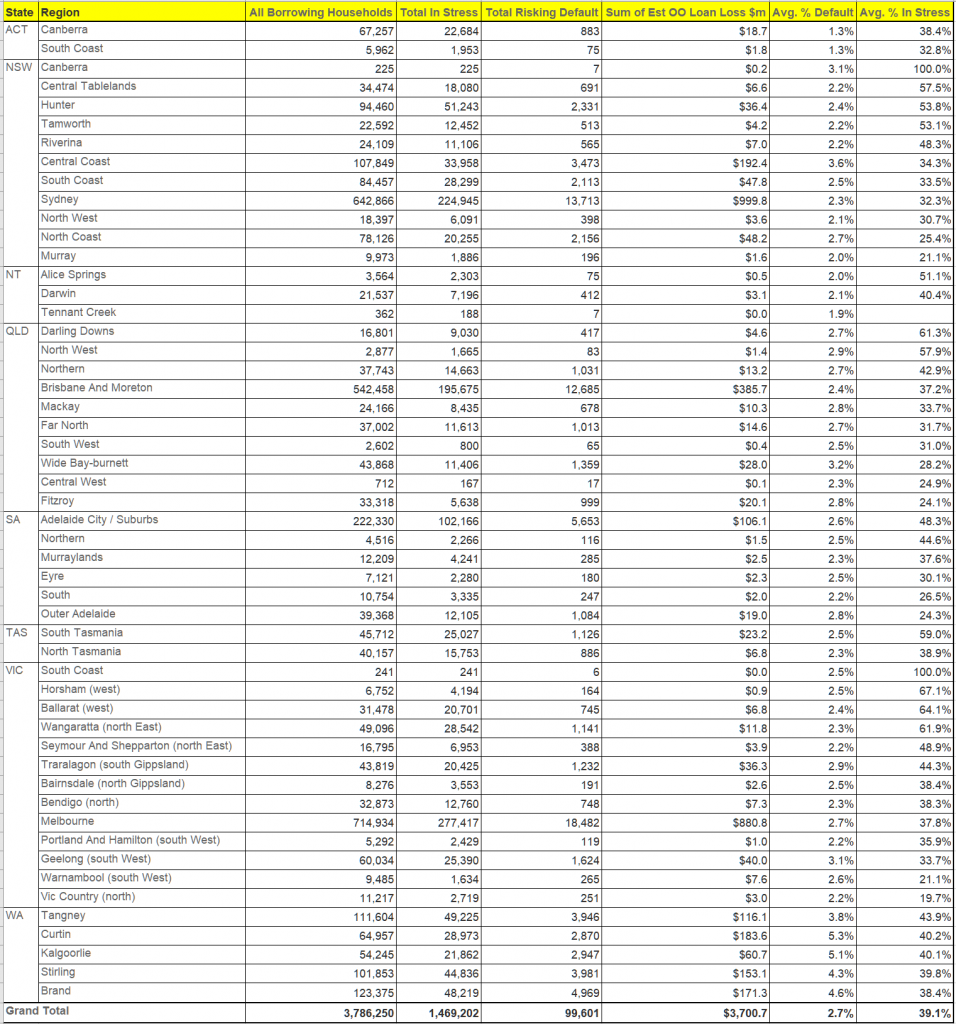
Mortgage stress is apparent not just in the main urban centres, but across the regions. This is a structural not caused by COIVD, but amplified by it.
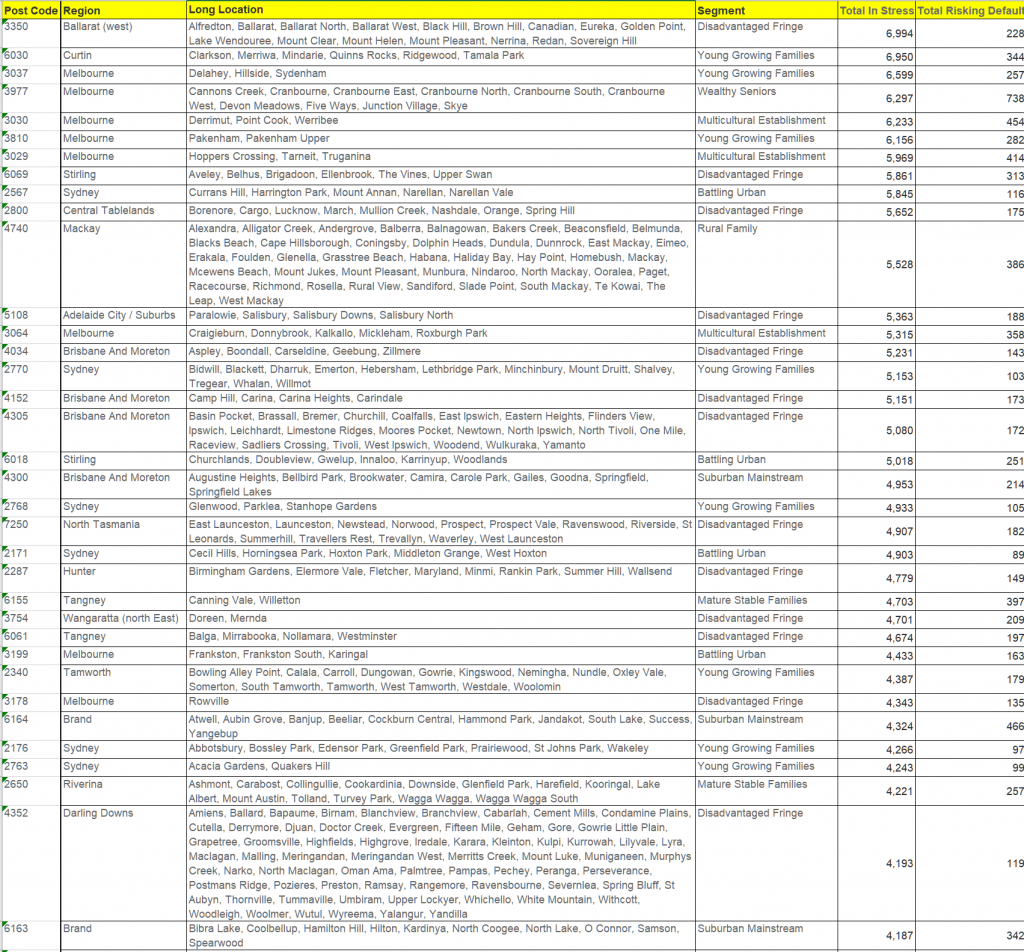
Stress varies by post code. Here are the top 30:
Rental Stress
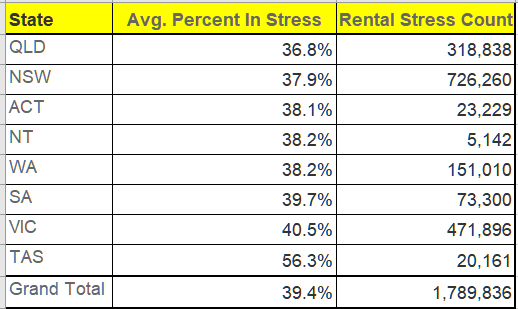
Turning to rental stress, the patterns are somewhat similar. The highest stress among renters is found in TAS at 6.3%, followed by VIC at 40.5% and SA at 39.7%. Whilst on a percentage basis the lowest levels of stress are in QLD (36.8%) and NSW, 37.9%, in fact the largest count of stressed households in also in NSW, as here the proportion of households renting is the highest (reflecting the poor affordability of housing in the state, despite rents falling in real terms.
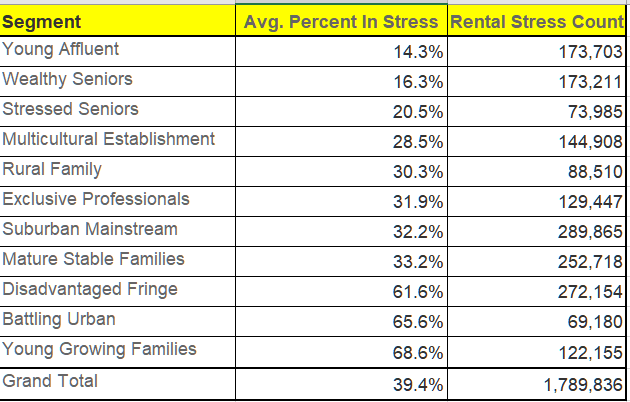
Across the DFA household segments, once again, Young Growing Families are most stressed, at 68.6%, whereas the largest counts are among suburban mainstream households (289,000), Disadvantaged Fringe (272,000) and Mature Stable (252,000).
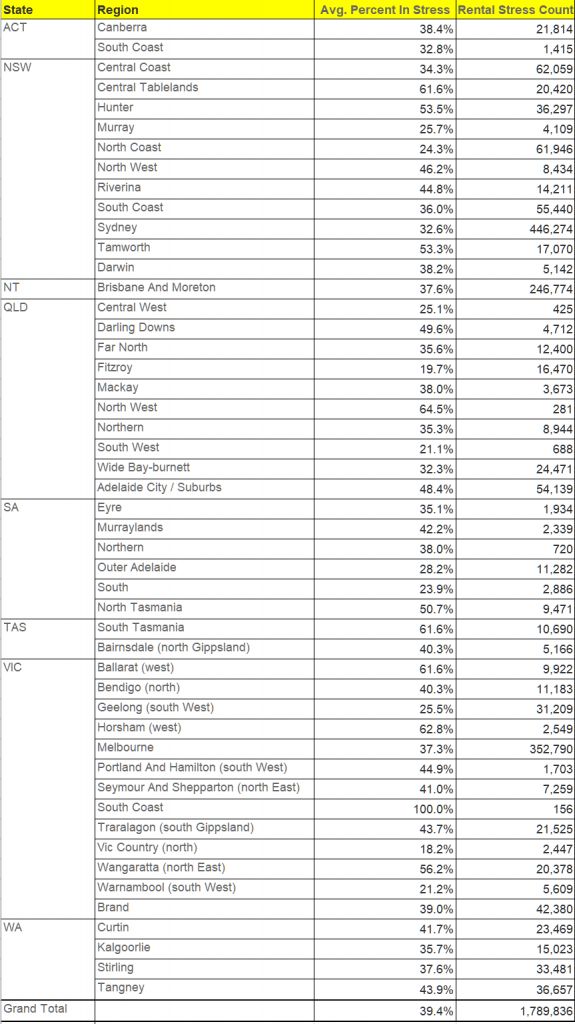
Once again rental stress is widely distributed across the regions, and should not be regarded as a capital city problem.
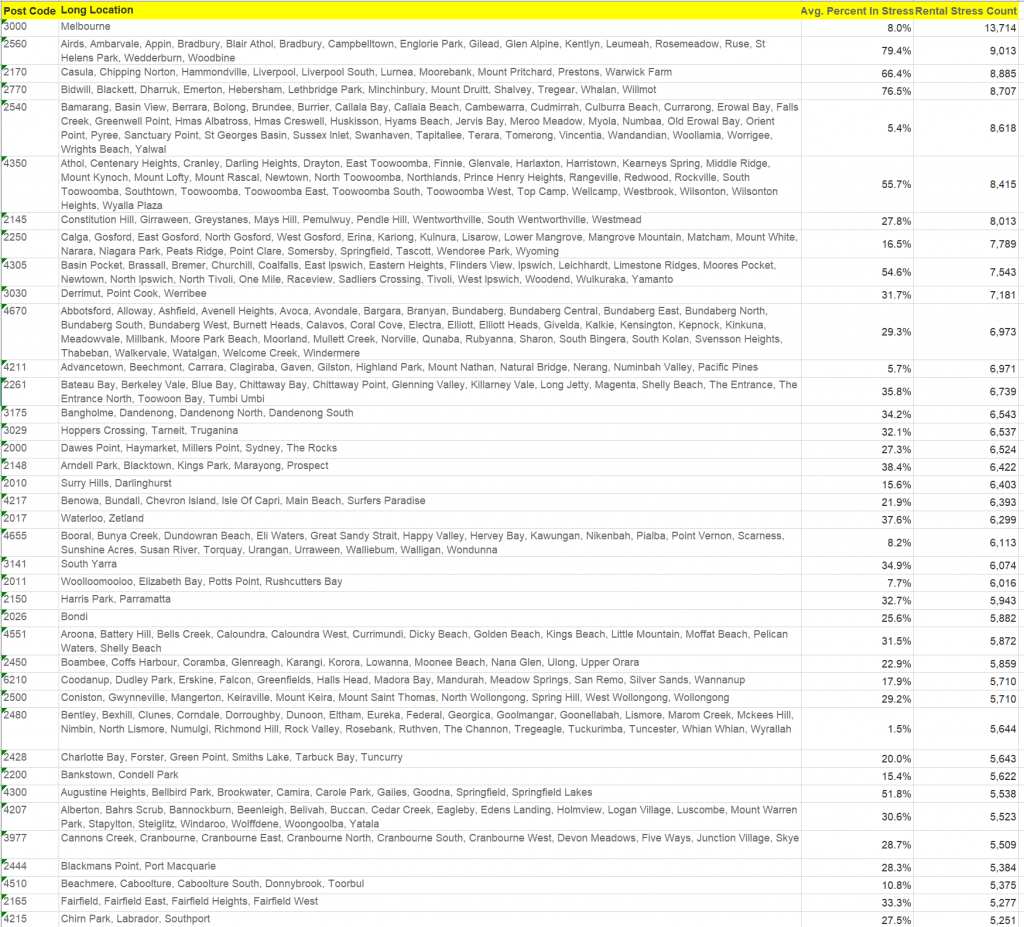
Rental stress by postcode
Property Investor Stress
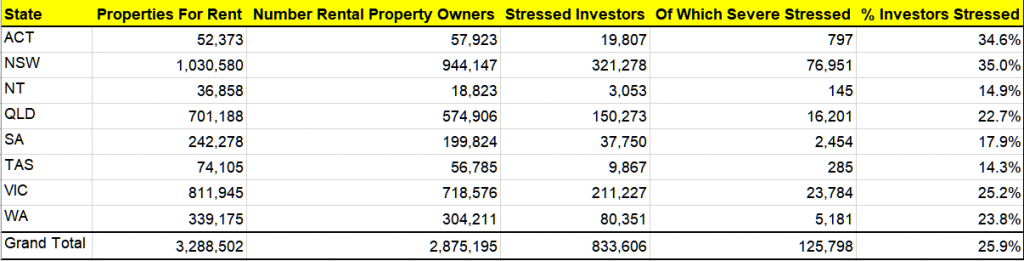
Finally, for the first time we are also reporting on property investors, and their property holdings. Across Australia, there are around 3.2 million properties available for letting (including short-term AirBnB type rentals as well as longer term residential). This excludes motels and hotel accommodation.
These properties are owned by around 2.8 million entities, including households and businesses. Around half the property available is covered by investment mortgages, which equates to around 1.65 million borrowers.
Of these 2.8 million entities, around 830,000 on a cash-flow basis, are not making sufficient to recover the costs of owning and letting their properties (stressed investors) of which 126,000 are severely stressed, most often because of low occupancy, or high repair costs. This is around 25.9% of all investment property, and 51.3% of mortgaged properties.
One complexity when analysing the more detailed footprint of investment property is that many owners live in different post codes to the properties they own. To account for this, we report the number of properties based on the location of the property itself, while the number of property investors and their stress status are reported on the basis of their home address, not the address of the property. That said, more than half reside in the same post code as their investment property.
NSW has the highest proportion of stressed investors at 35%, or around 321,000.
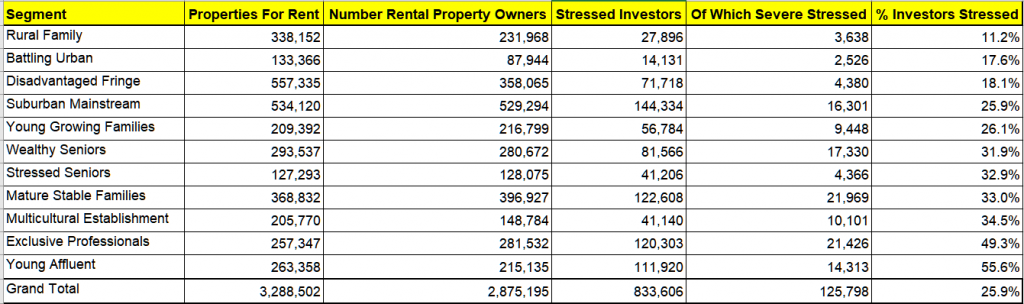
By segment, the most highly stressed investors are Young Affluent and Exclusive Professional investors (many of whom have multiple investment properties, so the pain is magnified).
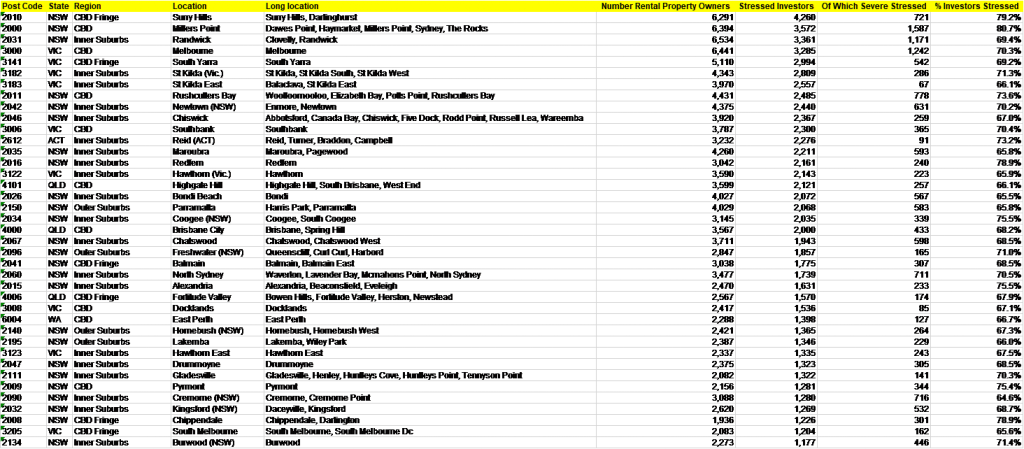
The top stressed investor postcodes include areas close the CBD of Sydney and Melbourne, including Surry Hills, Millers Point and Randwick in Sydney and Melbourne CBD, South Yarra and St Kilda in Melbourne.
The full stress series is available via our Patreon page for US$50 plus GST. You can subscribe there to receive full monthly updates.
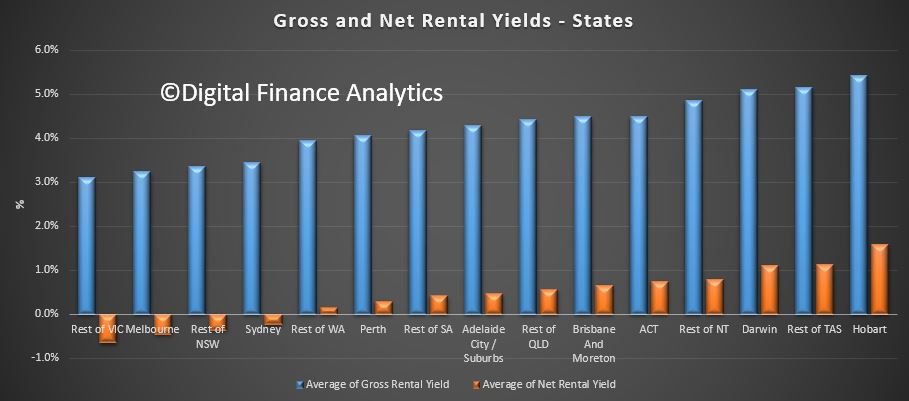
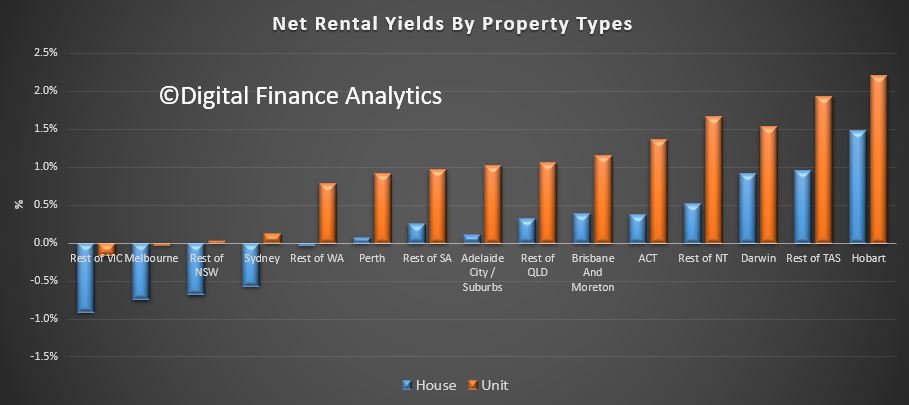
We track gross and net rental yields on investment properties via our household surveys. Gross yield is the actual rental stream to property value, net rental is rental payments less the costs of funding the mortgage, management fees and other expenses. This is calculated before any tax offsets or rebates. The latest results were featured in an AFR article today.
The results are pretty stark, and shows that many property investors are underwater in cash flow terms – not good when capital values are also sliding in some places.
This shows the gross and net rental returns by states – Hobart and Darwin are the winners, Melbourne, and the rest of Victoria, then Sydney and the rest of NSW the loosers.
The returns vary between units and houses, with units doing somewhat better.
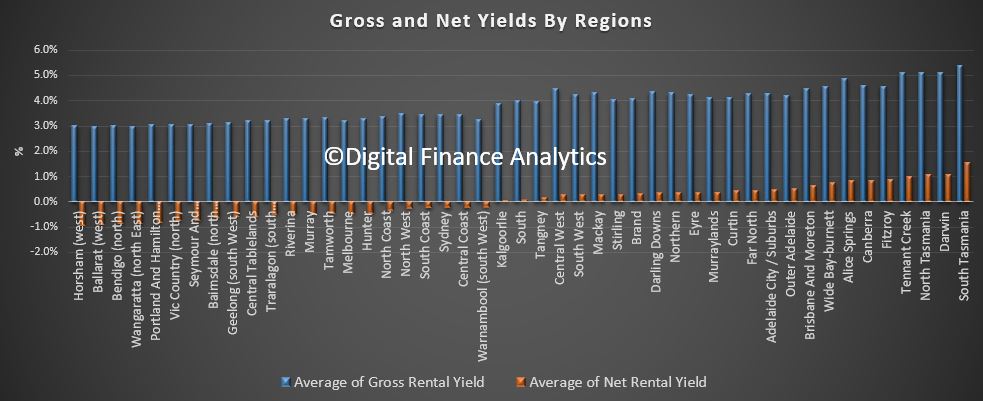
Here is a view by regions.
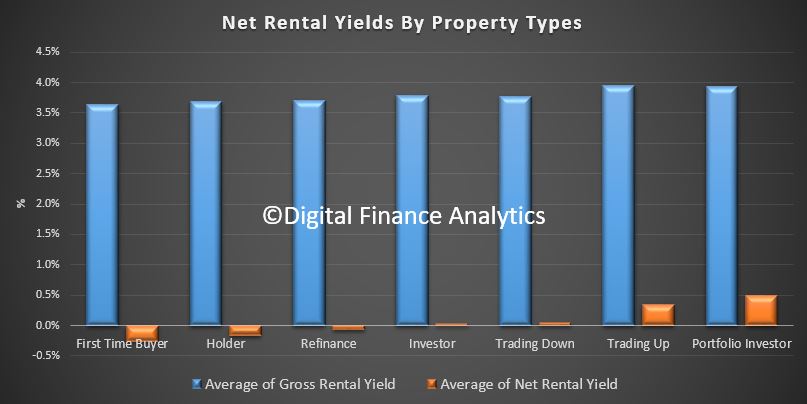
We find that portfolio property investors (those with multiple investment properties) are doing the best, whilst new investor buyers are doing the worse, not least because they have larger mortgages to service, and interest rates are higher, and no capital growth.
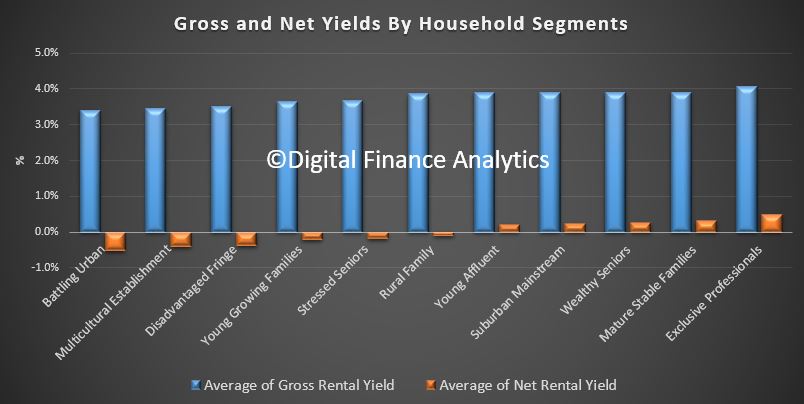
Finally, here is the killer slide. More affluent households are doing significantly better in terms of net rental returns, compared with those in more financially pressured household groups. Batting Urban households, those who live in the urban fringe on the edge of our cities are doing the worst. This is explained by the types of properties people are buying, and their ability to select the right proposition. Running an investment property well takes skill and experience, especially in the current rising interest rate and low capital growth environment. Another reason why prospective property investors need to be careful just now.
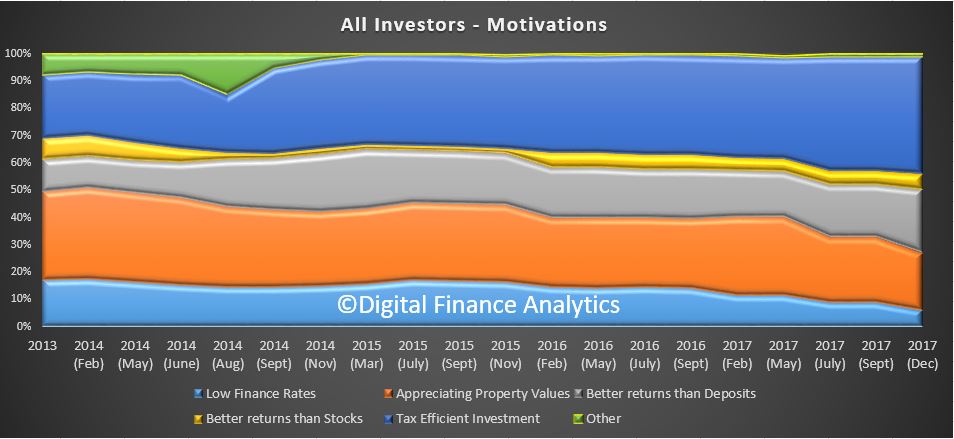
Continuing our series on our latest household survey results, we look more deeply at the attitude of property investors, who over the past few years have been driving the market. We already showed they are now less likely to transact, but now we can look at why this is the case.
Looking at investors (and portfolio investors) as a group, we see the prime attraction is the tax effectiveness of the investment (negative gearing and capital gains tax) at 43% (which has been rising in recent times). But availability of low finance rates and appreciating capital values have both fallen this time around. They are still driven by better returns than deposits (23%) but returns from stocks currently look better, so only 6% say returns from investment property are better than stocks! Only tax breaks are keeping the sector afloat.
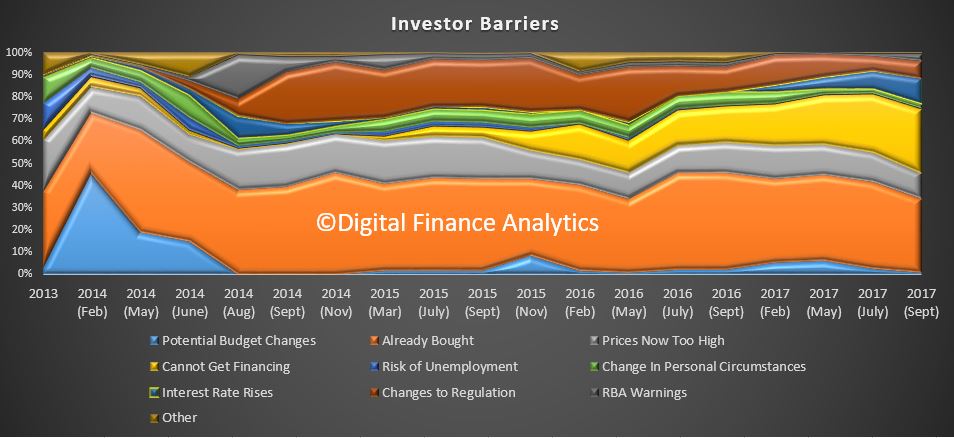
We can also look at the barriers to investing. One third of property investors now report that they are unable to obtain funding for further property transactions, nearly double this time last year.
Then 32% say they have already bought, and are not in the market at the moment. Whilst concerns about more rate rises have dissipated a little, factors such as prices being too high, potential changes to regulation and RBA warnings all registered.
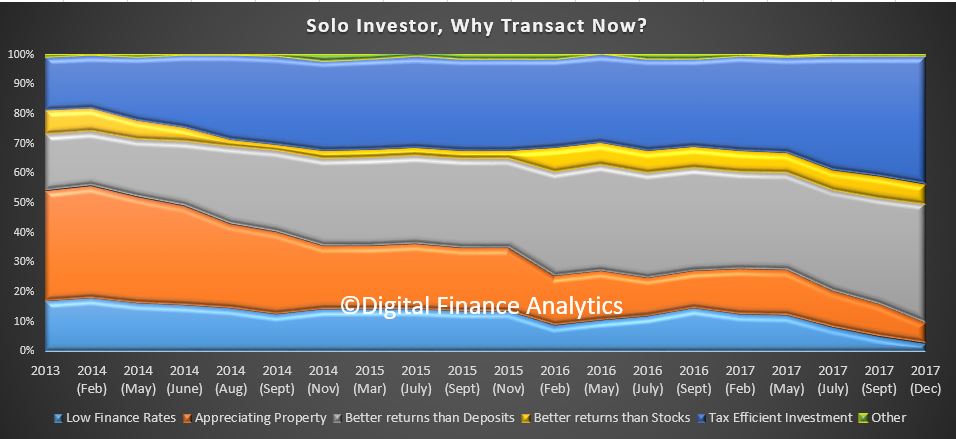
Turning to solo property investors (who own just one or two investment properties), 43% report the prime motivation is tax efficiency, 40% better returns than bank deposits and better returns than stocks (7%). But the accessibility of low finance rates and appreciating property prices have fallen away.
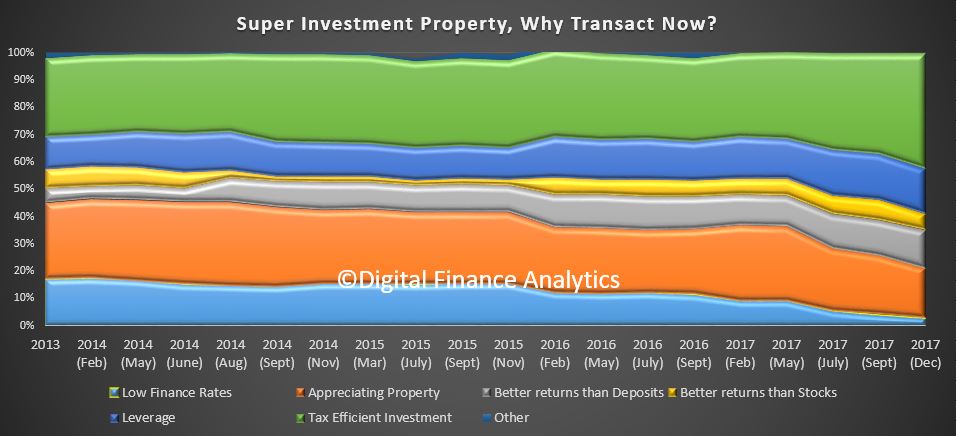
Those investing via SMSF also exhibit similar trends with tax efficiency at 43%, leverage at 16%, and better returns than deposits 14%. Once again, cheap finance and appreciating property values have diminished in significance.
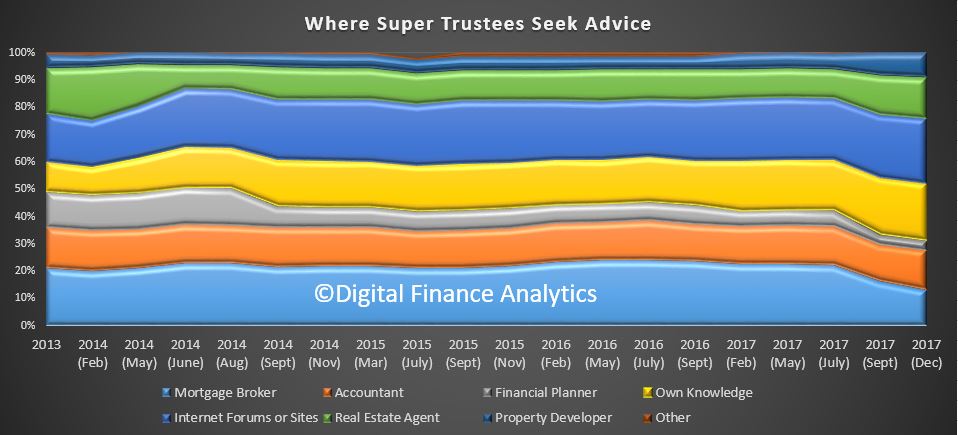
We also see 23% of SMSF trustees get their investment advice from internet or social media sites, 21% use their own knowledge, while 13% look to a mortgage broker, 14% an accountant and 4% a financial planner. 15% will consult with a real estate agent and 9% with a property developer.
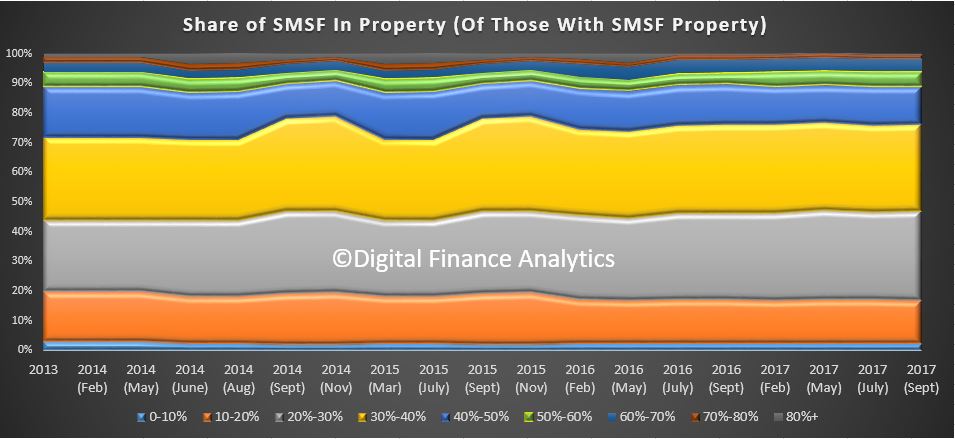
There is a fair spread of portfolio distribution into property. 13% have between 40-50% of SMSF investments in property, 29% 30-40% and 30% 20-30% of their portfolios.
Next time we will look at first time buyers and other owner occupied purchasers. Some are taking up the slack from investors, but is that sufficient to keep the market afloat?
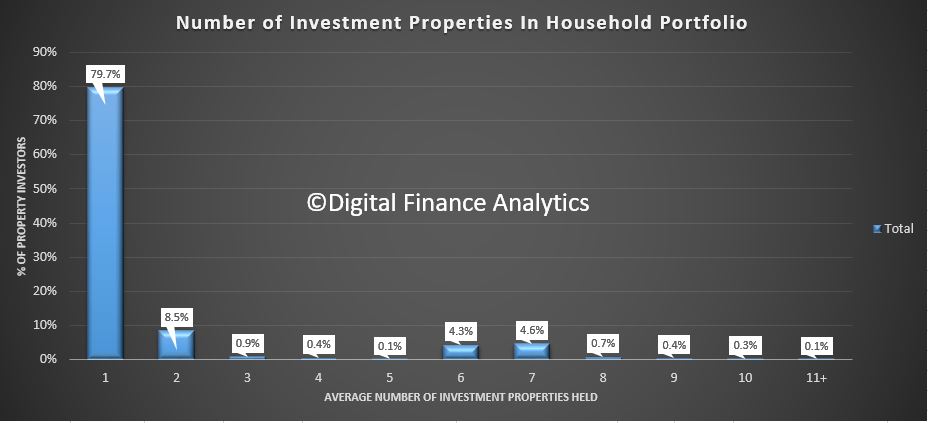
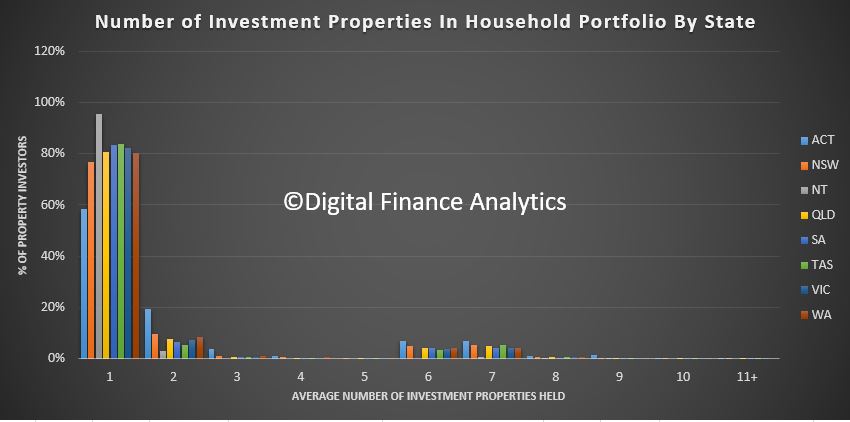
We had a number of questions following the AFR report over the weekend about the distribution of investment properties across the population.
Using data from our latest surveys, we can estimate the relative distribution across households. The most interesting is the average number of properties held. Around 80% of the investment population has a single investment property, a further 8% have two, and more than 4% have either 4 or 5. The highest count in our survey was 23!
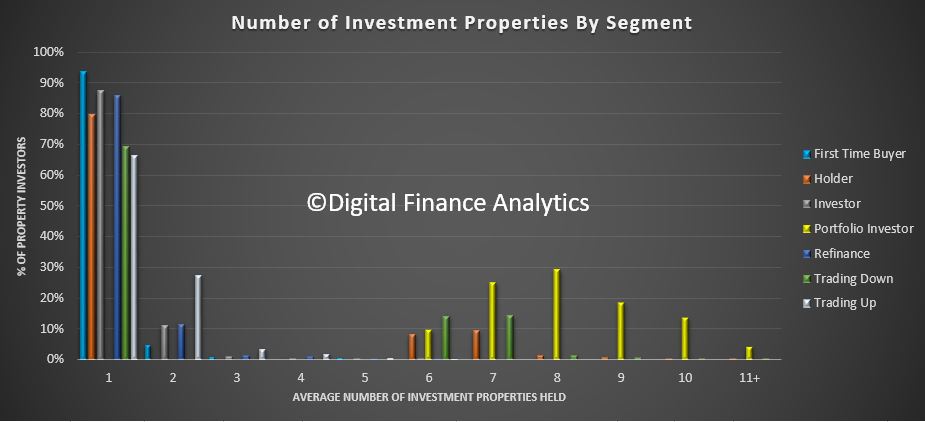
If we overlay our household segmentation on this data, we discover that portfolio property investors have the highest distribution, followed by down traders. First time buyers are more likely to be at the lower end.
The highest count registered in the ACT, followed by NSW.
Note this is data based on the number of properties held, not the number of properties mortgaged!
The Treasury has released its exposure draft for consultation on the plans announced in the budget to disallow travel expense deductions and limit depreciation for plant and equipment used in relation to residential investment property.
Closing date for submissions: Thursday, 10 August 201.
As part of the 2017-18 Budget, the Government announced it would disallow travel expense deductions relating to residential investment properties and limit depreciation deductions for plant and equipment used in relation to residential investment properties.
Travel deductions
From 1 July 2017, all travel expenditure relating to residential investment properties, including inspecting and maintaining residential investment properties will no longer be deductible.
This change will not prevent investors from engaging third parties such as real estate agents to provide property management services for investment properties. These expenses will remain deductible.
Plant and equipment depreciation deductions
From 1 July 2017, the Government will limit plant and equipment depreciation deductions for investors in residential investment properties to assets not previously used. Plant and equipment items are usually mechanical fixtures or those which can be ‘easily’ removed from a property such as dishwashers and ceiling fans.
Plant and equipment used or installed in residential investment properties as of 9 May 2017 (or acquired under contracts already entered into at 7:30PM (AEST) on 9 May 2017) will continue to give rise to deductions for depreciation until either the investor no longer owns the asset, or the asset reaches the end of its effective life.
The Government has released exposure draft legislation and explanatory material for amendments to give effect to the Budget announcements outlined above.
Public consultation on the exposure draft legislation and explanatory material will run for four weeks, closing on Thursday, 10 August 2017. The purpose of public consultation is to seek stakeholder views on the exposure draft legislation and explanatory material.
The Real Estate Institute of Western Australia has called the government’s expected introduction of a $270 levy for property investors “short sighted” and “irresponsible”.
Details of the levy have not yet been formalised by the Government, but the REIWA understands the levy will be linked to water rates and will apply to properties with a gross rental value of $24,000 or more.
The levy is being considered as a means to raise cash for the troubled state budget.
REIWA Councillor Suzanne Brown said it was extremely disappointing the industry was not consulted about the speculated policy change, and said a levy will make property investment less attractive in Western Australia.
“The private rental market is crucial to the provision of rental accommodation in Western Australia,” she said. “This levy will only increase the cost of owning a rental property, and make it a less viable investment option.”
Brown said the property investment market in the state is already struggling in a weak economy.
“With vacancy rates sitting at an all-time high of 6.5 per cent, Western Australian investors are already doing it tough,” she said.
“Slapping them with an additional cost in an already soft market is a knee-jerk reaction that will do more harm than good,” said Brown.
“The government should be cautious of targeting property investors,” said Brown, as landlords may pass on the levy to tenants in the form of higher rents.
“Not only will it affect owners, but this has the potential to hit tenants if the cost of the levy is passed on,” she said.
“Housing affordability is already a significant concern in Western Australia. Applying additional costs to the property market is not the answer and will only exacerbate the issue,” Brown concluded.


