High LVR Lending More Risky – RBA

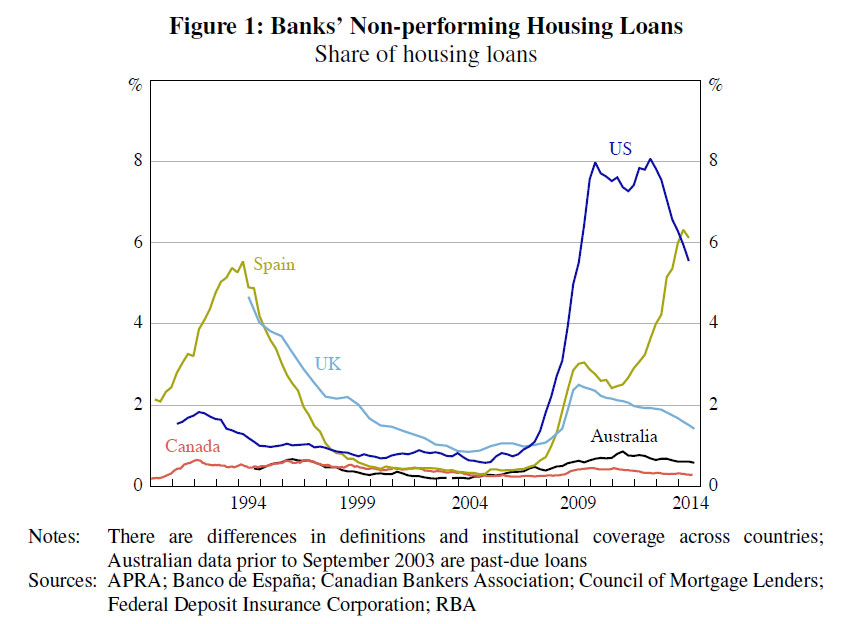
The RBA today published a paper on “Mortgage-related Financial Difficulties: Evidence from Australian Micro-level Data.”  Although default rates in Australia are lower than in many other countries,

RBAMortgageDefaultsCompare

their research paper delved into the different types of mortgage lending, using loan-level pool data provided by MARQ Services and concluded that higher LVR lending, and interest only loans were more risky than average.

RBAMortgageDefaults

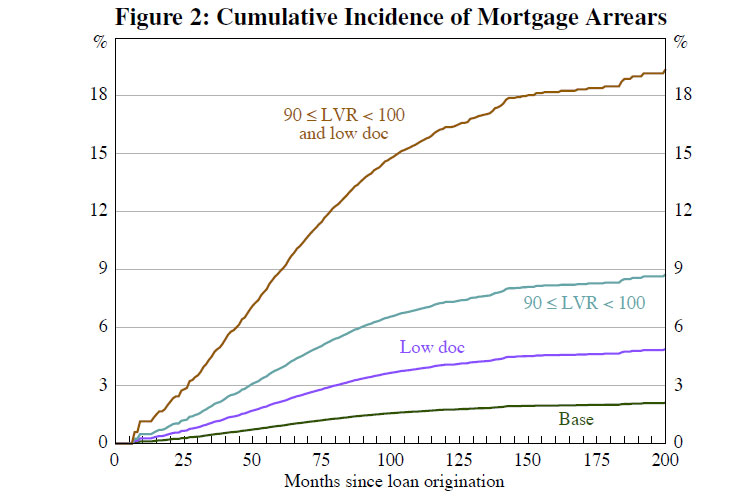
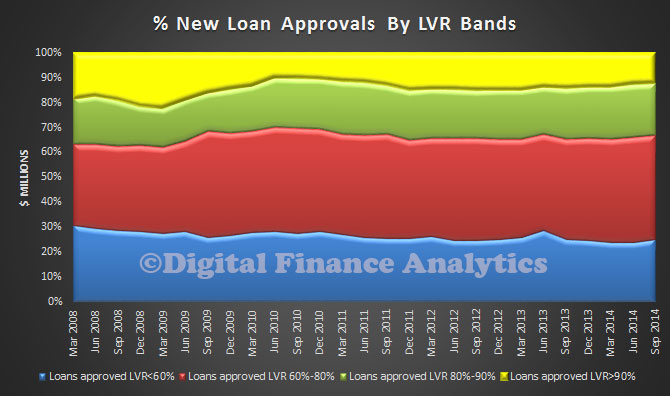
Our loan-level analysis suggests that loans with high loan-to-valuation ratios (above 90 per cent) are more likely to enter arrears, while loans that are repaid relatively quickly are less likely to enter arrears. Together, these results reinforce the importance of supervisors carefully monitoring changes in lending standards that affect the loan-to-valuation ratio of loans at origination and rates of principal repayment thereafter. Although interest-only and fixed-rate loans appear less likely to enter arrears, the fact that these loans tend to be repaid relatively slowly (particularly interest-only loans) means that increases in these types of lending can represent an increase in risk. Additionally, low-doc loans appear more likely to enter arrears than other types of loans, even after controlling for whether the borrower was self-employed. This suggests that lenders should maintain sound income documentation and verification policies, and that supervisors should continue to monitor developments in the low-doc lending space.

Borrowers with relatively high mortgage interest rates have a higher probability of entering arrears, even after controlling for the estimated minimum mortgage repayment, which is consistent with riskier borrowers being charged higher interest rates to compensate for their higher risk. We caution, however, that the loan-level results are affected by data limitations, such as a lack of information on borrower income, wealth and labour force status, and a relatively small sample of banks.

Complementary analysis using household-level data suggests that having a high debt-servicing ratio (above 50 per cent) significantly increases the probability of missing a mortgage payment. This highlights the importance of borrowers not overextending themselves by taking out loans of a size that will be difficult to comfortably service. Additionally, it reinforces the importance of lenders maintaining sound debt-serviceability and income-verification policies.
Having previously missed a mortgage payment is also found to be a significant predictor of subsequently missing another mortgage payment. This highlights the heightened risk associated with lending to borrowers with a history of missing payments, and supports the practice of lenders using information on previous debt payment behaviour (such as credit scores) in their credit assessment processes.

Overall, our results reinforce the importance of supervisors carefully monitoring changes in lending standards, as well as the importance of borrowers exercising prudence when taking on mortgage debt.

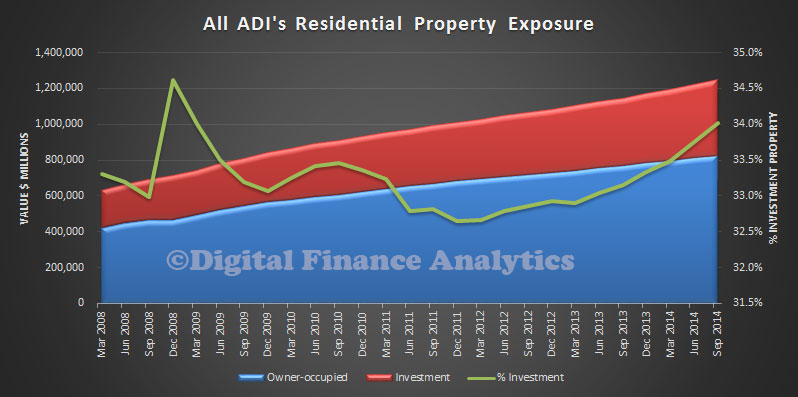
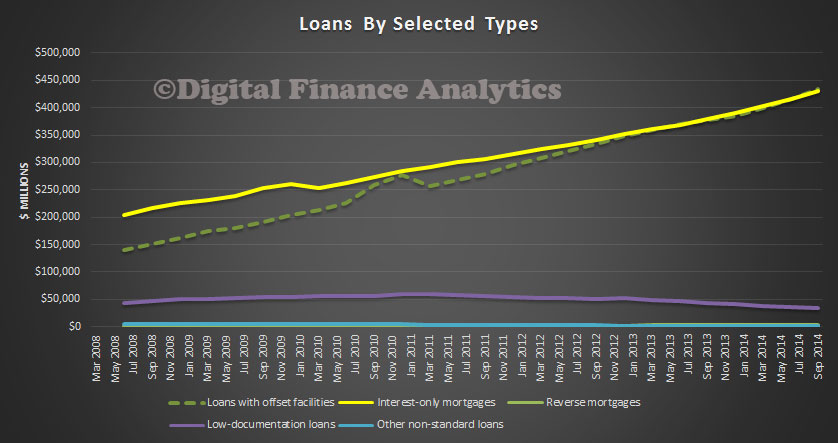
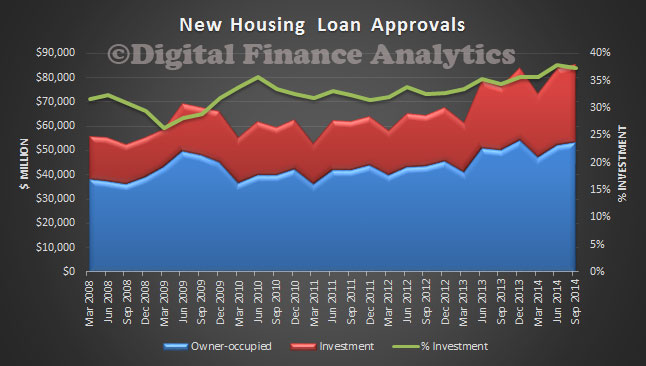
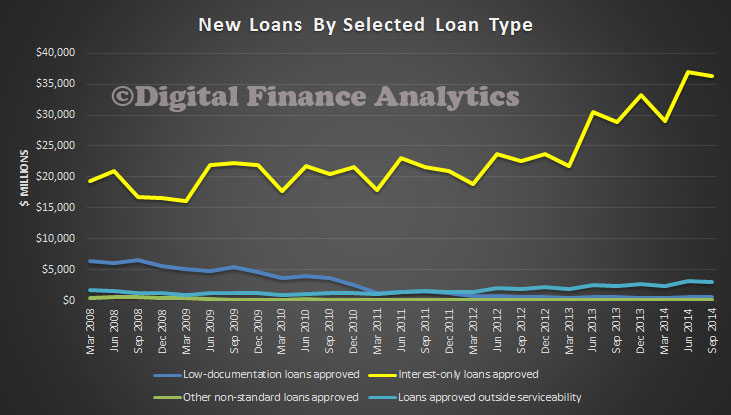
This is a significant and important contribution to the current debate about how risky the mortgage loan portfolio are. It also chimes with DFA mortgage stress analysis. Today we highlighted the APRA data which showed that both high LVR loans and interest only loans made up a significant element in the current new business mix. This research paper adds further weight to the argument that capital rules needs to be changed to reflect the true risks of mortgage lending.

ADI Residential Property Exposures Up Again

APRA published their quarterly ADI property statistics today to September 2014. ADIs’ total domestic housing loans were $1.3 trillion, an increase of $103.4 billion (9.0 per cent) over the year. There were 5.2 million housing loans outstanding with an average balance of $239,000. The proportion of investment loans moved higher again to 34% of all loans on book. DFA survey data shows a correlation between interest only and investment loans, (thanks to the benefits of negative equity), but APRA does not provide any linked data on this.

LoanExposSep2014-LoanValuesStockLooking at total loan stock, we see a continued rise in interest only mortgages, and loans with offset facilities. Reverse mortgages, low documentation loans and other non-standard mortgages are relatively controlled by comparison.

LoanExposSep2014-LoanTypesStockTurning to the flow data (loans written each month), ADIs with greater than $1 billion of residential term loans approved $85.4 billion of new loans, an increase of $9.1 billion (11.9 per cent) over the year. Of these new loan approvals, $53.5 billion (62.6 per cent) were owner-occupied loans and $31.9 billion (37.4 per cent) were investment loans. Thus we see that overall monthly totals continue to rise, and investment loans are growing faster than owner occupied loans. The 37.4% of investment loans September is understated because the owner-occupied lending data includes refinances, which should be removed from the analysis, to give a true picture of new lending.

LoanExposSep2014-LoanValue

Looking in more detail, we see the value of interest only loans rising in recent months, and also a small rise in the number of loans approved outside serviceability. Low documentation loans remain controlled.

LoanExposSep2014-LoanTypesFlowLooking at lending by LVR bands we see about 40% of loans being written are above 80% loan to value, and of these around 10% are above 90%. No data is provided on the proportion of loans covered by lender mortgage insurance. This should be.

LoanExposSep2014-LVRBrokers are having a field day at the moment, with commissions being increased, and values written rising. The APRA data shows 43.2% of all loans by value were originated via third party channels.

LoanExposSep2014-Third-PartySo, the RBA’s plan that the property sector should take up some of the slack left by the evaporating mining sector is still playing out. However, lending for investment property, and interest only lending have higher risks attached, and we think changes to capital rules are still likely to emerge to try and address some of the implicit risks.

Finally, ADIs’ commercial property exposures were $225.5 billion, an increase of $13.5 billion (6.4 per cent) over the year. Commercial property exposures within Australia were $187.4 billion, equivalent to 83.1 per cent of all commercial property exposures.

Digital Banking Gap Is Accelerating

Using the latest data from the DFA channel preferences survey, last published in the report “The Quiet Revolution“, today we chart the top line digital banking scorecard, from the demand side, looking at different household groups, and on the supply side what banks are doing to embrace digital. The rate of change in terms of bank participation in digital, is tracking the rate of adoption of those who are Digital Migrants, and they are moving faster than those households in the Digital Luddite segments. However, it appears that whilst the Australian banking sector is moving towards digital, those who are digitally literate – the Digital Natives – have ever more enhanced desire to do more digitally. Indeed, the digital gap between expectations and delivery is widening. You can read about our digital segmentation here.

DigitalBankingExpectationsNov2014The rate of digital migration is closely tracked by the uptake of smart phones and tablets. Digital Natives are the most likely to be using one of these smart devices, and they have a strong desire to manage their entire financial service footprint digitally. This is true whether it is buying a mortgage, making a payment, or checking a transaction. We know from our profitability analysis that Digital Natives are on average more valuable to the industry, tend to be younger, and better educated, and are significantly less likely to enter a bank branch for any purpose. They use social media and online search tools, and trust these information channels more than a typical bank. They also have high expectations in terms of customer service delivery, and personalization. Many banking players are not meeting these expectations.

DFA is of the view that banks need to accelerate their rate of migration to the digital world, and position to respond to the rising number of new entrants which have the potential to disrupt significantly. We recently discussed Apple Pay, PayPal and Ratesetter. Each of these have potentially disruptive impact. As we said recently:

“DFA has just updated the 26,000 strong household survey examining their channel preferences. This report summarises the main findings.

We conclude that the move towards digital channels continues apace, facilitated by new devices including smartphones and tablets, and the rise of “digital natives” – people who are naturally connected.

We outline the findings across each of our household segments, and also introduce our thought experiment, where we tested household’s attitudes to the various existing and emerging brands in the context of digital banking. We found a strong affinity between digital natives and the emerging electronic brands, and a relative swing away from the traditional terrestrial bank players.

These trends create both threat and opportunity. The threat is that traditional channels, especially the branch, become less relevant to digital natives, and becomes the ghetto of older, less connected, less profitable customers. The future lays in the digital channels, where the more profitable and digitally aware already live. Players need to migrate fast, or they will be overtaken by the next generation of digital brands who are looking towards becoming players in financial services. The game is on!”

APRA Extends Basel III Consultation

APRA today extended the consultation period on the changes to Basel III disclosure requirements.

On 18 September 2014, APRA released for consultation a discussion paper and draft amendments to Prudential Standard APS 110 Capital Adequacy and Prudential Standard APS 330 Public Disclosure, which outlined APRA’s proposed implementation of new disclosure requirements for authorised deposit-taking institutions (ADIs).

The disclosures are in relation to:

  • the leverage ratio;
  • the liquidity coverage ratio; and
  • the identification of potential globally systemically important banks.

This consultation package also proposed minor amendments to rectify minor deviations from APRA’s implementation of the Basel Committee’s Basel III framework.

APRA’s intention was that, subject to the outcome of the consultation, these amendments would come into effect from 1 January 2015. A number of matters remain to be addressed before APRA is able to finalise the new standards. Accordingly, given the limited period of time remaining before the scheduled implementation date, APRA is advising affected ADIs that any new requirements will not take effect until 1 April 2015 at the earliest.

UK Banks To Improve Complaints Procedures

The UK FCA has completed an assessment of the complaints processes at 15 major retail financial firms – seven banks, two building societies, three general insurers and three life insurers – using hypothetical customer complaints. According to the results of the research, the firms chosen accounted for 79% of banking complaints, 60% of home finance complaints, 26% of general insurance complaints (excluding PPI), 42% of life insurance complaints and 42% of investment complaints reported to the FCA’s predecessor the Financial Services Authority between July and December 2012.

The review was conducted by a working group made up of the 15 participant firms and five trade bodies. The FCA also sought the views of the Financial Ombudsman Service and consumer groups.

“We asked firms to carry out self-assessments to better understand how complaints are dealt with in practice, as well as providing their documented policies, processes and management information (MI) for our review. We also established, and chaired, a working group of the participant firms and trade bodies to identify and discuss common complaint-handling issues. Our approach provided valuable insight into how firms manage their complaint functions. This allowed us to observe any barriers to effective complaint handling.”

But while the FCA found some improvements have already been made, such as senior management becoming more engaged with complaint handling and firms empowering staff to make the right judgements and to demonstrate empathy, the review also identified areas requiring further improvement. For example:

  • Firms do not always consider the impact on consumers when designing and implementing processes and procedures.
  • There are inconsistencies in the amount of redress offered, particularly for distress and inconvenience.
  • Firms take a narrow approach to determining and fixing the underlying reason for a complaint, which may affect their awareness of wider issues.

The FCA is asking all financial firms, not just those that took part in the review, to consider the findings and to ensure their complaints procedures “have the interests of consumers at their heart”.

The working group also recommended changes to FCA rules on complaint handling, such as ensuring all complaints are reported to the regulator rather than just those that take longer than one working day to resolve. The FCA is now considering these recommendations and will consult on possible policy changes.

Securitisation Update

The ABS published their data on Assets and Liabilities of Securitisers in Australia. At 30 September 2014, total assets of Australian securitisers were $131.7b, up $0.1b (0.1%) on 30 June 2014. This continues the flat trend, despite growth in house prices and lending for property purchase.

SecuritersAssetsSept2014During the September quarter 2014, the rise in total assets was due to an increase in other loans (up $0.8b, 5.1%) and cash and deposits (up $0.2b, 4.1%). This was partially offset by decreases in residential mortgage assets (down $0.9b, 0.8%). Residential and non-residential mortgage assets, which accounted for 82.1% of total assets, were $108.1b at 30 September 2014, a decrease of $0.9b (0.8%) during the quarter.

At 30 September 2014, total liabilities of Australian securitisers were $131.7b, up $0.1b (0.1%) on 30 June 2014. The rise in total liabilities was due to the increase in long term asset backed securities issued in Australia (up $1.7b, 1.8%) and loans and placements (up $0.5b, 3.1%). This was partially offset by a decrease in asset backed securities issued overseas (down $1.5b, 12.0%).

SecuritersLiabilitiesSept2014At 30 September 2014, asset backed securities issued overseas as a proportion of total liabilities decreased to 8.3%, down 1.1% on the June quarter 2014 percentage of 9.4%. Asset backed securities issued in Australia as a proportion of total liabilities increased to 78.2%, up 1.4% on the June quarter 2014 percentage of 76.8%.

SecuritersLiabilitiesPCSept2014Finally, looking at loans to households and private non-financial corporations, we see the proportion which are residential mortgages falling to 85%.

SecuritersLoansSept2014

UK Banks Fined For IT Failures

The Prudential Regulation Authority (PRA) is today fining Royal Bank of Scotland Plc (RBS), National Westminster Bank Plc (Natwest) and Ulster Bank Ltd (Ulster Bank) £14 million for inadequate systems and controls which led to a serious IT incident in 2012. This is the first financial penalty the PRA has imposed since it came into being in April 2013. The Financial Conduct Authority (FCA) has separately fined the banks for the same incident.

In April 2013, the PRA and FCA announced that they would investigate the RBS, Natwest and Ulster Bank IT incident which led to widespread disruption to customers and the financial system. A joint investigation was considered necessary because the incident impacted upon the objectives of both the PRA and the FCA.

The IT incident, which began on 18 June 2012, directly affected at least 6.5 million customers in the United Kingdom, 92% of whom were retail customers. The IT incident had the potential to have an adverse effect on the safety and soundness of RBS, Natwest and Ulster Bank as it impacted upon:

  • the ability of the banks’ retail customers to access their accounts;
  • the ability of the banks’ commercial customers to access their internet banking service, preventing them from accessing their accounts or making payments;
  • customers of other institutions who were unable to receive payments from the banks’ affected customers; and
  • the ability of the banks to fully participate in clearing.  An efficient clearing system is fundamental to the efficient operation of the financial markets.

Disruption to the majority of RBS and Natwest systems lasted until 26 June 2012, and Ulster Bank systems until 10 July 2012.  Disruptions to other systems continued into July 2012. The cause of the IT incident was the failure of the banks to have the proper controls in place to identify and manage exposure to the IT risks within their business.

Properly functioning IT risk management systems and controls are an integral part of a firm’s safety and soundness. The PRA considers that the IT incident could have threatened the safety and soundness of the banks and could have, in extremis, had adverse effects on the stability of the financial system in that it interfered with the provision of the banks’ core banking functions, impacted third parties and risked disrupting the clearing system.

Andrew Bailey, Deputy Governor, Prudential Regulation, Bank of England and CEO of the PRA said:

“The severe disruption experienced by RBS, Natwest and Ulster Bank in June and July 2012 revealed a very poor legacy of IT resilience and inadequate management of IT risks. It is crucial that RBS, Natwest and Ulster Bank fix the underlying problems that have been identified to avoid threatening the safety and soundness of the banks.”

The banks agreed to settle at an early stage and were therefore entitled to a 30% discount, without which they would have been fined £20 million.

Super Now Worth $1.87 Trillion – APRA

APRA just released their quarterly super statistics to September 2014. Superannuation assets totalled $1.87 trillion at the end of the September 2014 quarter. Over the 12 months to September 2014 this represents a 9.6 per cent increase. Total assets in MySuper products was $378.1 billion at the end of the September 2014 quarter. Over the 12 months to September 2014 this represents a 128.2 per cent increase.

Of these, $1.14 trillion are regulated by APRA and these grew by 2.2% since the previous quarter, whereas $ 557 million are self-managed super assets  managed by the ATO and this grew by 0.2% since June 2014.

SuperSept20141However, the number of SMSFs grew by 1.6% from the previous quarter, to stand at more than 539,000 funds.

SuperSept20142Looking in more detail at the APRA regulated funds, with more than four members, there were $23.6 billion of contributions in the September 2014 quarter, up 7.2 per cent from the September 2013 quarter ($22.0 billion). Total contributions for the year ending September 2014 were $96.8 billion. Outward benefit transfers exceeded inward benefit transfers by $471 million in the September 2014 quarter. There were $15.1 billion in total benefit payments in the September 2014 quarter, an increase of 10.9 per cent from the September 2013 quarter ($13.7 billion). Total benefit payments for the year ending September 2014 were $57.1 billion. Net contribution flows (contributions plus net benefit transfers less benefit payments) totalled $8.0 billion in the September 2014 quarter, an increase of 9.6 per cent from the September 2013 quarter ($7.3 billion). Net contribution flows for the year ending September 2014 were $37.8 billion. Net contribution flows (contributions plus net benefit transfers less benefit payments) totalled $8.0 billion in the September 2014 quarter, an increase of 9.6 per cent from the September 2013 quarter ($7.3 billion). Net contribution flows for the year ending September 2014 were $37.8 billion. The graph below shows the composition of net contribution flows for each quarter from December 2008 to September 2014.

SuperSept20143The annual industry-wide rate of return (ROR) for entities with more than four members for the year ending 30 September 2014 was 8.2 per cent. For the five-years to September 2014 the annualised geometric-average ROR was 6.9 per cent. The graph below shows the ROR for each quarter from December 2004 to September 2014. The rate of return (ROR) represents the net earnings on superannuation assets and measures the combined earnings of a superannuation fund’s assets across all its products and investment options.

SuperSept20144As at the end of the September 2014 quarter, 51 per cent of the $1,219.7 million investments for entities with at least four members were invested in equities; 33 per cent of investments were invested in fixed income and cash investments; 12 per cent of investments were invested in property and infrastructure and 4 per cent were invested in other assets, including hedge funds, and commodities.

Note that small APRA funds (SAFs) and Single Member Approved Deposit funds (SMADFs) do not report quarterly to APRA. Therefore the quarterly assets of these funds are estimated based on the assets they report to APRA in their annual returns. This is done using a straight line growth methodology.


FOFA Disallowed In Senate

The government’s changes to FoFA are now under threat, following a move which saw four crossbench senators join with the Labor and the Greens to overturn the changes to the financial advice laws. This reverses some of the changes which as we discussed before were aligned with the major banks, and saw consumer protection eroded.  As a result, Labor now appears to have secured the support it needs in the Senate to reverse the regulations. This overturns the earlier deal with the government and the minor Palmer United Party (Pup) in July to push through the Senate changes to Labor’s Future of Financial Advice (FoFA) laws.

Pup Senator Jacqui Lambie, and crossbenchers Ricky Muir and John Madigan, and independent senator Nick Xenophon have joined with the opposition on the issue. Xenophon called it “a coalition of common sense”.

“Our common, unequivocal objective is to have the government’s FoFA regulations disallowed today in the Senate because they are unambiguously bad for consumers”

ASIC commented:

ASIC notes the Senate has disallowed the Corporations Amendment (Streamlining Future of Financial Advice) Regulation 2014.

ASIC will take a practical and measured approach to administering the law as it now stands following the disallowance of the Corporations Amendment (Streamlining Future of Financial Advice) Regulation 2014. We will take into account that – as a result of the change to the law that applies to the provision of financial advice – many Australian financial services (AFS) licensees will now need to make systems changes. ASIC recognises this issue may arise in particular areas, including fee disclosure statements and remuneration arrangements.

We will work with Australian financial services licensees, taking a facilitative approach until 1 July 2015.

We believe this represents an important opportunity to revisit the fundamental flaws in FOFA as originally incarnated, and exacerbated by the recent government amendments. But is also continues the uncertainty around the nature of good financial advice, something which is critically important to get right, given the swelling superannuation balances in Australia, now worth $1.85 trillion.


RBA And Housing – Again

Glenn Stevens in an address to the Committee for Economic Development of Australia (CEDA) Annual Dinner today included some further important comments on the housing sector. He was at pains to highlight what potential upcoming changes on lending standards would not be focussing on. Rather, it is an attempt “to stretch out the upswing.” In other words, the RBA still wants to use housing as part of the ongoing economic growth lever, despite high debt levels and high house prices.

As for domestic sources of demand, an obvious contributor is the set of forces at work in the housing sector. Investment in new and existing dwellings is rising. It ought to be possible, if we are being sensible both on the demand management side and the supply side, for this to go further yet and, more importantly, for the level of activity to stay high for longer than the average cyclical experience. A high level of construction, maintained for a longer period of time, is vastly preferable to a very sharp boom and bust cycle. That alternative outcome might give us a higher peak in the near term, but then a slump in the housing sector at a time when the fall in mining investment is still occurring. A sustained period of strong construction will be more helpful from the point of view of encouraging growth in non-mining activity – and also, surely, from a wider perspective: housing our growing population in an affordable manner.

Considerations such as these are among the reasons we ought to take an interest in developments in dwelling prices, the flow of credit towards housing purchases, and the prudence with which these funds are advanced. It is perhaps opportune to offer a few observations on this topic.

Having fallen in late 2010 and 2011, dwelling prices have since risen, with the median price across the country up by around $100 000 – about 18 per cent – since the low point. Prices have risen in all capitals, with a fair degree of variation: the smallest increase has been in Canberra, at about 6 per cent, and the largest in Sydney, at 28 per cent.

Credit outstanding to households in total is rising at about 6–7 per cent per year. I see no particular concern with that. When we turn to the rate of growth of credit to investors in particular, we see that it has picked up to about 10 per cent per annum over the past six months, with investors accounting for almost half of the flow of new credit.

It is not clear whether this acceleration will continue or abate. It is not clear whether price increases will continue or abate. Furthermore, it is not to be assumed that investor activity is problematic, per se. A proportion of the investor transactions are financing additions to the stock of dwellings, which is helpful. It can also be observed that a bit more of the ‘animal spirits’ evident in the housing market would be welcome in some other sectors of the economy.

Nor, let me be clear, have we seen these dynamics, thus far, as an immediate threat to financial stability. The Bank’s most recent Financial Stability Review made that clear.

So we don’t just assume that all this is a terrible problem. By the same token, after all we have seen around the world over the past decade, it is surely imprudent not to question the comfortable assumption that it is all entirely benign. A situation where:

  • prices have already risen considerably in the two largest cities (where about a third of our population live)
  • prices are rising, at present, faster than income by a noticeable margin, and
  • an important area of credit growth has picked up to double-digit rates

should prompt a reasonable observer to ask the question whether some people might be starting to get just a little overexcited. Such an observer might want to satisfy themselves that lending standards are being maintained. And they might contemplate whether some suitably calibrated and focused action to help ensure sound standards, and that might lean into the price dynamic, may be appropriate. That is the background to the much publicised comment that the Bank was working with other agencies to see what more could be done on lending standards.

Let’s be clear what this is not about. It is not an attempt to restrain construction activity. On the contrary, it is an attempt to stretch out the upswing. Nor is it a return to widespread attempts to restrict lending via direct controls. That era, that some of us remember all too well, was one in which the price of credit was simply too low and credit growth too high all round. We don’t have that problem at present. That growth of credit to many borrowers remains moderate suggests that the overall price of credit is not too low. In fact the level of interest rates, although very low, is well warranted on macroeconomic grounds. The economy has spare capacity. Inflation is well under control and is likely to remain so over the next couple of years. In such circumstances, monetary policy should be accommodative and, on present indications, is likely to be that way for some time yet. But for accommodative monetary policy to support the economy most effectively overall, it’s helpful if pockets of potential over-exuberance don’t get too carried away.

Turning from housing investment to investment more generally, a more robust picture for capital spending outside mining would be part of a further strengthening of growth over time. Some of the key ingredients for this are in place. To date, there are some promising signs of stronger intentions, but not so much in the way of convincing evidence of actual commitment yet. That’s often the way it is at this point of the cycle. Firms wait for more evidence of stronger demand, but part of the stronger demand will come from them.

With respect to consumer demand, I should complete the picture by showing an updated version of the relevant chart from last time. In brief, not much has changed. The ratio of debt to income remains close to where it has been for some time. It’s rising a little at present because income growth is a bit below trend. Household consumption growth has picked up to a moderate pace and has actually run ahead of income over the past two years. Given that household wealth has risen strongly over that period, and interest rates are low, a modest decline in the saving rate is perhaps not surprising and indeed we think it could decline a little further in the period ahead. As I’ve argued in the past, however, we shouldn’t expect consumption to grow consistently and significantly faster than incomes like it did in the 1990s and early 2000s, given that the debt load is already substantial.

sp-gov-181114-graph6