ANZ Will Pay $30m To Prime Access Clients

ANZ today confirmed it will be reimbursing some Prime Access clients after it identified the documented annual review, part of a package of services, had not been provided. Prime Access is a fee-for-service package introduced in 2003 and includes priority access to financial planners, investment monitoring alerts and a documented annual review.

In accordance with its obligations under the Corporations Act, ANZ reported the issue to the Australian Securities and Investments Commission (ASIC) and commenced a remediation program supported by external consultants PwC and law firm Clayton Utz.

ANZ estimates the cost of reimbursing around 8,500 clients who did not receive a documented annual review to be approximately $30 million.

ANZ is working with ASIC to finalise the refund methodology and payments will commence as soon as the methodology is agreed. ANZ CEO Global Wealth Joyce Phillips said: “We sincerely apologise to our clients for not delivering all of the Prime Access services we promised and we will reimburse affected clients as soon as possible”.

Another example of issues in the troubled financial planning and advice sector in Australia, and demonstrating the need for more reform to rebuild trust.  Today ASIC announced that it was investigating new instances of licensees charging clients for financial advice, including annual advice reviews, where the advice was not provided. Most of the fees have been charged as part of a client’s service agreement with their financial adviser.


Unemployment Trend Unchanged At 6.2%

The ABS data shows that Australia’s estimated seasonally adjusted unemployment rate for March 2015 was 6.1 per cent, compared with a revised 6.2 per cent for February 2015. This represented a decrease of less than 0.1 percentage points. In trend terms, the unemployment rate was unchanged at 6.2 per cent.

The seasonally adjusted labour force participation rate increased to 64.8 per cent in March 2015 from 64.7 per cent in February 2015. The ABS reported the number of people employed increased by 37,700 to 11,720,300 in March 2015 (seasonally adjusted). The increase in employment was driven by increases in full-time employment for both males (up 24,800) and females (up 6,700).  The ABS seasonally adjusted aggregate monthly hours worked series increased in March 2015, up 4.8 million hours (0.3 per cent) to 1,630.4 million hours. The seasonally adjusted number of people unemployed decreased by 1,500 to 764,500 in March 2015.

Expectations were of a rise to 6.3 or 6.4 percent, and some analysts were expecting the rise to make a case for the RBA to cut the cash rate again in May. The data may suggest otherwise.

DFA Household Finance Confidence Index Falls In March

We have released the latest edition of the DFA Household Finance Confidence Index, the results of are derived from our household surveys, averaged across Australia. We have 26,000 households in our sample at any one time. We include detailed questions covering various aspects of a household’s financial footprint. The index measures how households are feeling about their financial health.

To calculate the index we ask questions which cover a number of different dimensions. We start by asking households how confident they are feeling about their job security, whether their real income has risen or fallen in the past year, their view on their costs of living over the same period, whether they have increased their loans and other outstanding debts including credit cards and whether they are saving more than last year. Finally we ask about their overall change in net worth over the past 12 months – by net worth we mean net assets less outstanding debts.

The overall index fell from 92.1 to 91.97 in March, which continues the overall declining trend since February 2014.

FCIMar2015

Looking at the elements within the index, nearly 60 percent of households are enjoying a growth in their net worth, mainly thanks to further rises in house prices and positive stock market movements. On the other hand, there was a rise of 1.5 percent in those who have seen their net worth fall, these are households who predominately do not own property.

FCINetWorthMar2015

There were small movements in the costs of living data, with school fees and child care being two elements which have hit some households hard, though offset by falls in the costs of fuel. We also see the impact of falling exchange rates on overseas purchases, especially from the US. Finally, rentals are increasing faster than incomes for some households, especially in cities on the east coast.

FCICostsMar2015

Household real incomes are relatively static, though there is little evidence of rising income. Less than 4 percent of households recorded a rise in real terms.

FCIncomeMar2015

Some households are a little more comfortable with their level of debt, this is directly linked to the fall in RBA rates in February. However, there was also a rise in those households who were concerned about the debts they owed, with a rise of 0.57 percent. On average females were more concerned than males, and older households more worried than younger ones.

FCIDebtMar2015

There was a small rise in households who were more comfortable with their savings position, but more are less comfortable, and this is directly linked to the current low interest rates offered for deposits, and the prospect of even lower rates, and the quest for higher yield elsewhere looking ahead. Females were significantly more concerned than males.

FCISavingsMar2015

Finally, looking at job security, there was a significant rise in those households who are concerned, with a drop in those who felt more secure than last year by 1.7 percent and a rise in those who fell less secure. That said, more than 60 percent registered as about the same. We noted some state variations, with those in WA significantly more concerned than those in NSW.

FCIJobsMar2015 Note that the detailed state by state and segmented data is not publicly released. We will update the index again in a months time.


Building Activity Slows

The ABS released the Building Activity data to December 2014. Overall, the trend estimate of the value of total building work done fell 0.2% in the December 2014 quarter.  This is despite the estimate of the value of new residential building work done rising 1.0% in the December quarter and the value of work done on new houses rose 0.3% while new other residential building rose 1.9%. Construction for units therefore helped prop up the numbers. This is because the trend estimate of the value of non-residential building work done fell 1.4% in the December quarter.

Looking at the quarter on quarter trend estimate changes, we see a drift downward since mid last year. Momentum in NSW based on value of work done fell furthest. Residential construction cannot replace the decline in other sectors.

BuildingWorkDoneDec2014

RBNZ Says Action Needed To Reduce Housing Imbalances

The Reserve Bank of New Zealand today urged greater attention be given to reducing housing market imbalances that are presenting an increasing risk to financial and economic stability.

OECD-Comps-NZIn a speech to the Rotorua Chamber of Commerce, Reserve Bank Deputy Governor Grant Spencer said that: “Irrespective of the mix of demand and supply-based factors, the longer the excess demand persists, the further prices will depart from their underlying fundamental determinants, and the greater the potential for a disruptive correction.

“Since late 2014, housing market imbalances have become more accentuated, particularly in Auckland where the supply shortage is greatest, and house prices are particularly stretched, having increased by three times since the start of 2002.

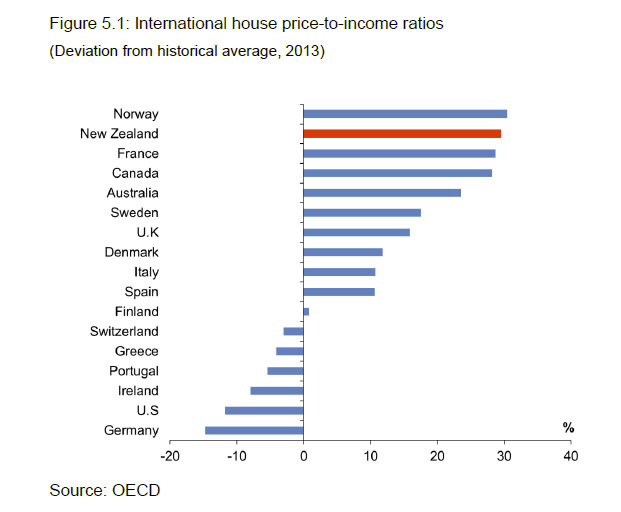
“New Zealand is one of the few advanced economies that has not had a major house price correction in the past 45 years.”

Mr Spencer said that a downward correction in house prices in New Zealand could be prompted by a range of potential shocks, such as rising global interest rates, or a downturn in the global economy and financial markets.

With 60 percent of its lending in residential mortgages, the New Zealand banking system could be put under severe pressure in such a downturn. The resulting contraction in credit would amplify the impact to the domestic economy and financial system, making it more difficult to avoid a severe downturn.

Mr Spencer said that policies to ease the supply constraints must be the main priority, but are unlikely to yield quick results.

Considerable scope exists to streamline the multiple approval processes required to complete a residential development. There is also a need to adopt a more integrated approach to the planning and funding of new infrastructure.

“The proposed RMA reforms have the potential to significantly improve the planning and resource consenting processes.

“The best prospect for substantially increasing the supply of dwellings over the next one to two years appears to be in apartment development. The Government and the Auckland Council might consider focussing their efforts on simplifying the approvals process and increasing the designated areas for high-density residential development.”

On the demand side, Mr Spencer said that there are practical difficulties in using migration policies to manage the housing cycle.

“Nor can monetary policy be used currently to dampen housing demand, as CPI inflation is below the Reserve Bank’s target range.”

However, measures should be considered to counter the growth in investor and credit based demand for housing.

The Reserve Bank would like to see fresh consideration of possible policy measures to address the tax-preferred status of housing, especially housing investment.

“Investors are often setting the marginal market prices that are then applied to the full housing stock within a regional market. Indicators point to an increasing presence of investors in the Auckland market and this trend is no doubt being reinforced by the expectation of high rates of return based on untaxed capital gains.”

Mr Spencer said that macro-prudential policy is a potential instrument to help restrain credit-based demand pressures and improve the resilience of bank balance sheets to a potential housing downturn.

“The introduction of loan-to-value ratio restrictions (LVRs) in October 2013 helped to moderate housing market pressures despite strong net inward migration and the ongoing shortage of housing. The LVR restrictions have also improved the resilience of bank balance sheets. They will be removed or modified as market conditions allow.

“Other macro-prudential options are being assessed, including in relation to investor lending. However, such tools are not a panacea – their impact is inevitably smaller than the main drivers of the current housing market imbalance.”

Australian Growth Down And Unemployment Up – IMF

The latest edition of the IMF’s World Economic Outlook, just released, portrays a complex global picture. There are several points relevant to Australia, in the pre-budget run-up.

  • Legacies of both the financial and the euro area crises are still visible in many countries. To varying degrees, weak banks and high levels of debt—public, corporate, or household—still weigh on spending and growth. Low growth, in turn, makes deleveraging a slow process. Potential output growth has declined. Potential growth in advanced economies was already declining before the crisis. Aging, together with a slowdown in total productivity, has been at work. The crisis made it worse, with the large decrease in investment leading to even lower capital growth. As we exit from the crisis, capital growth will recover, but aging and weak productivity growth will continue to weigh. The effects are even more pronounced in emerging markets, where aging, lower capital accumulation, and lower productivity growth are combining to significantly lower potential growth in the future. More subdued prospects lead, in turn, to lower spending and lower growth today.
  • On top of these two underlying forces, the current scene is dominated by two factors that both have major distributional implications, namely, the decline in the price of oil and large exchange rate movements.
  • Australia’s projected growth of 2.8 percent in 2015 is broadly unchanged from the October prediction of 2.7 percent, as lower commodity prices and resource-related investment are offset by supportive monetary policy and a somewhat weaker exchange rate. 3.2 percent growth is forecast for 2016, supported by low interest rates and inflation.
  • The downturn in the global commodity cycle is continuing to hit Australia’s economy, exacerbating the long-anticipated decline in resource-related investment. However, supportive monetary policy and a somewhat weaker exchange rate will underpin nonresource activity, with growth gradually rising in 2015–16 to about 3 percent.
  • Average annual metal prices are expected to decline 17 percent in 2015, largely on account of the decreases in the second half of 2014, and then fall slightly in 2016. Subsequently, prices are expected to broadly stabilize as markets rebalance, mainly from the supply side. The largest price decline in 2015 is expected for iron ore, which has seen the greatest increase in production capacity from Australia and Brazil.
  • Exporters of commodities (Australia, Indonesia, Malaysia, New Zealand) will see a drop in foreign earnings and a drag on growth, although currency depreciation will offer some cushion.
  • Australian unemployment, net is forecast at 6.4 percent in 2015.
  • In addition to strong regulation and supervision, protecting financial stability may also require proactive use of macroprudential policies to tame the effects of the financial cycle on asset prices, credit, and aggregate demand.


Perspectives On Capital

The question of how much capital should a bank hold is running hot these days. To illustrate the point, lets look at the commentary surrounding the the semi-annual update of the Global Capital Index, which show the capital ratios for Global Systemically Important Banks, and which was released in early April by FDIC Vice Chairman Hoenig. The Federal Deposit Insurance Corporation (FDIC) preserves and promotes public confidence in the U.S. financial system by insuring depositors for at least $250,000 per insured bank; by identifying, monitoring and addressing risks to the deposit insurance funds; and by limiting the effect on the economy and the financial system when a bank or thrift institution fails. So what they say in significant.

Among the data in the report:

  • For the largest U.S. banking firms, the average tangible equity capital ratio – known inversely as the leverage ratio – is 4.97 percent. In other words, each dollar of assets is funded with 95 cents of borrowed money.
  • The largest regional and community banks, have tangible capital ratios ranging from 7.57 to 8.85 percent.  That is, they operate with between 1.5 and 1.7 times more funding from their ownership than G-SIBs do.

“The Global Capital Index illustrates how financial resiliency is still sorely lacking,” Vice Chairman Hoenig said. “The sector of the financial industry with the greatest concentration of assets is the least well capitalized. Plainly put, it operates with the largest amount of borrowed, or as we say, leveraged funding, and thus it is the least well prepared to absorb loss. Yet the primary measure of capital – the risk weighted measure — makes the largest firms appear relatively more stable than they really are. The reality is that with too little owner equity funding individual firms, the industry as a whole also is undercapitalized and should one firm fail, the industry continues to be vulnerable to contagion and systemic crisis. It follows that the lack of adequate tangible capital remains among the greatest impediments to successful bankruptcy and resolution.”

The Global Capital Index uses estimates of International Financial Reporting Standards (IFRS) to measure a firm’s tangible equity (loss-absorbing capital) against on- and off-balance sheet assets, as shown in column 8 of the table. The tangible capital measurement includes derivatives and other assets that are off-balance-sheet in US Generally Accepted Accounting Principles (GAAP) and Basel calculations. It is calculated by comparing equity capital to total assets, deducting goodwill, other intangibles, and deferred tax assets from both equity and total assets.

The tangible leverage ratio measures funds available to absorb loss against total balance sheet and some off-balance sheet assets. It does not attempt to predict or assign relative risk weights among asset classes. “It is more difficult to game, and it provides the most clear and complete picture of a banking firm’s ability to absorb loss regardless of source,” Vice Chairman Hoenig said.

In contrast, the ratios of Tier I capital to risk-weighted assets for all banks, largest to smallest, are above 10 percent and some of the largest have ratios of more than 15 percent. “This higher capital ratio is achieved by reducing on-balance sheet assets by a pre-assigned risk weight and excluding off-balance sheet assets, such as derivatives. This measure is misleading and overstates the strength of these firms’ balance sheets. No other industry is allowed to make these kinds of adjustments,” Vice Chairman Hoenig said. “The tangible leverage ratio provides a more accurate measure of assets and risks than the balance sheet reported under either GAAP or Basel.”

Global-Capitall-Index


Lending Finance Tops Out?

The ABS data today provides an insight into the various categories of Finance to February 2015. The total value of owner occupied housing commitments excluding alterations and additions rose 1.0% in trend terms, whilst the value of total personal finance commitments fell 0.1%. The value of total personal finance commitments fell 0.2%. The trend series for the value of total commercial finance commitments rose 2.9%. Revolving credit commitments rose 4.8% and fixed lending commitments rose 2.1%. So, we see a rise in commercial lending (which of course includes investment property lending.) The rate of momentum in housing lending on the other hand appears to be slowing somewhat.

LendingFinanceFeb2015Looking at the relative share of investment property lending, we see it has turned down from a peak of 30.3% of all commercial lending to just of 29%, but still high compared with 2011. Banks are still preferring to lend for housing, though we are seeing a rise in commercial lending which is not property aligned – this is to be welcomed, and we need to see more, as productive lending to business will translated into real economic growth, whilst lending for property purchase inflates house prices, bank balance sheets, and household net wealth in book value terms.

COmmercialFinanceandPropertyFeb2015Turning to housing lending, values still rising and a total of $31 billion was lent for property across all categories in the month. This is a record.

HousingFinanceFeb2015Looking at the mix, 38% was for investment housing, 30% for owner occupation, and 20% for refinance.

LendingMixFeb2015We see that just of 50% of secured loans (excluding refinance) were for investment purposes. Refinance was high, in response to the RBA rate cut in February.

HousingLendingFinanceFeb2015Looking at the percentage movements, month on month, we see the rate of growth slowing across the board, with investment lending slowing the most. This could well indicate a potential turning point in the months ahead, despite strong demand for investment property in the system.

HousingFinancePCMovementsFeb2015

A Sharp Downturn (Though Unlikely) In China Would Impact Australia – World Bank

The latest East Asia and Pacific Economic Update from the World Bank says

“a significant slowdown in China, though unlikely, would exert large spillovers, particularly on commodity exporters. In China, a disorderly unwinding of real and financial vulnerabilities could trigger a sharp slowdown in investment and output growth. A steep decline in property prices could force developers and banks to deleverage quickly, leading to a sharp contraction in real estate investment. A disorderly unwinding of local government financing could trigger a sharp slowdown in infrastructure investment. A wave of bankruptcies in primary and heavy industries suffering from overcapacity could seriously derail fixed investment in otherwise healthy industrial sectors. And excessive risk taking in the shadow-banking system could eventually force a rapid cutback in liquidity and credit, deeply curtailing investment.

A slowdown of this order remains unlikely, given the substantial policy buffers available. As discussed in the October 2014 East Asia and Pacific Economic Update, there are significant fiscal, institutional, and exchangerate buffers to prevent a disorderly unwinding of debt. Ample fiscal space is available to deploy targeted stimulus or bail out debtors. The savings rate is 50 percent of GDP, financial repression restricts savings outside the banking system, the financial system is still predominantly state owned, and capital controls on bank lending and portfolio investment prevent sharp outflows. Foreign reserves, at US$3.9 trillion, are by far the largest in the world, and net international assets exceed US$2 trillion.

However, should a sharp slowdown materialize, it would exert large spillovers across the region. A onetime 1-percentage-point decrease in China’s GDP growth relative to the baseline (stemming from a 2-percentagepoint decrease in investment growth) would reduce growth in the region by approximately 0.2 percentage points (World Bank 2014). The impact would be relatively larger for commodity exporters, and for economies more tightly integrated into regional supply chains (Ahuja and Nabar 2012). In addition, the significant negative impact on Australia and New Zealand, among the world’s largest commodity suppliers, would lead to indirect spillovers on the Pacific Island Countries, given their tight links through trade, investment, and aid”.