Four years in the making, the European Union’s new data protection rules have finally been agreed by the European Council and await the approval of the European Parliament. But a last-minute addition has sparked a debate about responsibility and consent, by proposing to raise to 16 the “age of consent” under which it is illegal for organisations to handle the individual’s data. This would force younger teenagers to gain parental permission to access social networking sites such as Facebook, Snapchat, WhatsApp or Instagram.
While raising this digital age of consent from 13 as it is in the US to 16 would strengthen the protections they receive, there are doubts about whether it would be enforceable. How would the firms behind social networks be able to verify their users’ ages, for example, or whether they had their parents’ permission? There are already Facebook and Instagram users below the age of 16, so that would entail potentially closing those accounts – how would this be policed?
Could parents or social network providers be prosecuted for allowing the under-16s to access a social network? The proposed new EU rules, the General Data Protection Regulation, would impose heavy fines (4% of annual turnover) for those organisations or firms that breach data protection laws, which means the likes of Facebook would have a great incentive to ensure they complied. But there are few obvious ways to do this.
Additionally, any ban may lead some teenagers to lie about their age in order to create or maintain an account, potentially putting them in more danger by pretending to be older than they are. Janice Richardson, former Co-ordinator of the European Safer Internet Network, said that denying the under-16s access to social media would “deprive young people of educational and social opportunities in a number of ways, yet would provide no more (and likely even less) protection”.
Sophisticated age verification software would be needed, such as scanning machine-readable documents such as passports. But would this be sufficient to satisfy the legal threshold? This would also introduce further problems with the need to acquire and store this sensitive data.
So many social networks to choose from.Twin Design/shutterstock.com
Informed consent
One of the chief concerns during the consultation process for the General Data Protection Regulation was the growth of social networking sites such as Facebook and how data protection rules applied to them. In November 2011, the then EU Justice Commissioner Viviane Reding said she was concerned about the growth of digital advertising and the lack of understanding of how it involved harvesting and analysis of personal information. These concerns led to the decision to update the Data Protection Directive to reflect the many changes in how we use the internet since it was passed in 1995.
While the preamble to the General Data Protection Regulation states that young people deserve protection as they may be less aware of risks and their rights in relation to their personal data, this appears to be a paternalistic view adopted by the European Commission.
For example, the Swedish Data Protection Board (similar to the UK Information Commissioner’s Office) conducted a study of 522 participants aged between 15-18 and found that the majority had experienced unkind words written about them, around a quarter were sexually harassed online, and half of those on Facebook had had their account hijacked. But it also found that the young people had a generally good understanding of privacy issues.
On the other hand, a study from Ofcom, the communications watchdog in the UK, found that teenagers couldn’t tell the difference between search results and adverts placed around them, demonstrating that young people’s understanding of how the web works, and the role of their personal data, is not always sufficient – and perhaps insufficient to represent real, informed consent.
Negotiations ultimately allowed member states to opt-out from the requirement to raise the digital age of consent, but issues remain. With an opt-out agreed, member state governments may lower the age to 13, which would cause confusion due to the way the internet functions across borders. Would a 15-year-old in one country find that his use of social media became illegal as he crossed the border into another?
Facebook, which started among US universities, was originally aimed at the over-17s before dropping its minimum age to 13, hugely expanding its number of users. But this move was not without difficulties, and an estimated 7.5m Facebook users are under the minimum age. Facebook founder Mark Zuckerberg wants the 13-year-old minimum removed altogether.
The question is, can such young teenagers or children take responsibility for holding social network accounts? While concerns around protecting teenagers from the potential dangers of social networking are well-intentioned, it seems rather that the genie is out of the bottle. Parental guidance and education is perhaps a better approach than applying the long arm of the law.
Author: Rebecca Wong, Senior Lecturer in Intellectual Property and Cyberlaw, Nottingham Trent University
According to ING, Aussies are taking control of their finances this holiday period, intending to spend $313 on Christmas gifts, significantly less than the US and UK.
The latest ING Special Report on Christmas and New Year found Aussies are cautious about getting caught out overspending during the festive period, with 73 per cent planning to spend less on Christmas this year.
As they focus on managing their festive finances, Aussies anticipate spending just 7 per cent of their monthly income on Christmas gifts, less than half of the 15 per cent US and UK counterparts intend to fork out.
Additional findings:
63 per cent of Australians don’t save money for Christmas and only 29 per cent put money in a separate account to pay for Christmas costs
One in ten (12 per cent) Australians went into debt to pay for Christmas last year, however this is still less than the US (20 per cent) and UK (15 per cent)
14 per cent of Victorians admitted going into debt to pay for Christmas last year, closely followed by people from NSW (13 per cent), while South Australians were the most budget conscious, with less than 8 per cent spending beyond their means last Christmas
John Arnott, Executive Director, Customers, ING DIRECT, says: “Christmas and New Year is primarily about family, friends and fun, but it can become stressful – mainly because of the potential shock to the wallet.
“While some of us can be tempted to stretch finances almost to breaking point for festivities, the great news this year is that more and more of us are planning on keeping a close watch on our wallets, helping to minimise any New Year financial hangover.”
ING Christmas Spending League versus average income
Country
Median spend on Christmas presents (AUD^)
Spend as a percentage of average monthly earnings
Average monthly net earnings (AUD)*
Unsure how much they will spend
United Kingdom
656
15%
4392
42%
Luxembourg
469
9%
4983
45%
Austria
391
11%
3626
38%
France
391
11%
3476
42%
Germany
313
9%
3618
37%
Italy
313
12%
2713
40%
Spain
313
12%
2624
46%
Czech Republic
281
25%
1135
39%
Belgium
234
7%
3490
50%
Romania
172
32%
541
40%
Poland
109
11%
991
50%
Netherlands
63
1%
4367
41%
USA
563
15%
3690
33%
Australia
313
7%
4564***
44%
^ Median spend on Christmas presents converted from Euro to AUD. Currency conversion based on exchange rate as at 18 October 2015
* Source – Eurostat. For the year 2014, average net earnings for countries other than Romania and Australia; converted from Euro to AUD based on exchange rate as at 18 October 2015
** Source – Eurostat. For the year 2013, average net earnings – Romania
***Source – Australian Bureau of Statistics, for the year 2013-14 . Currency conversion – Bloomberg rates 31 December 2014
It has been a turbulent year for oil. Prices were strong in summer 2014, before plummeting in the second half of that year. After a modest stabilisation in early 2015, they dropped even further and are now more than two thirds lower than in summer 2014 – as the graph below shows. It’s bad news for oil producers but is forcing some, at least, to reform their economies as a result.
Russia is losing an estimated US$2 billion in revenues for every dollar fall in the oil price. Its economy is heavily dependent on energy revenues, which account for 50% of its federal budget revenues. Even a dramatic interest rate hike to 17% has not helped the steep devaluation of the ruble, the stock-market drop or the amount of money leaving the country.
The situation is even worse for the world’s largest exporter of oil, Saudi Arabia, which is expected to end the year with a deficit of $150 billion – about 20% of its GDP and the largest in its history. It has already started cutting project budgets and military acquisitions as a result. It is even introducing VAT for the first time.
The severity of falling oil prices on Saudi Arabia’s economy can also be seen in its decision to open its stock market to foreigners in June 2015. It has also relaxed rules to allow qualified investors direct access to stocks to reduce the economy’s dependence on crude.
In Venezuela, the economy was already in a shambles when oil was at $120 a barrel. And in Malaysia the government is realigning its budget by removing gasoline and diesel subsidies. Similar steps were taken by governments across the world to remove oil subsidies – Indonesia abandoned a four-decade-old policy of subsidising gasoline while India also stopped subsidising diesel and raised fuel taxes.
Of course, falling oil prices are not bad for all. They increase households’ scope for consumption and at the same time decrease companies’ production and transportation costs, which normally leads to higher profits and increased investments. Rapidly developing economies such as China and India, which are net importers of oil, are experiencing the most obvious immediate benefits. They are able to use savings on oil imports to reduce their trade deficit, improve government budgets, reduce inflation and redistribute money to infrastructure projects.
Out of pocket: drivers in India will no longer benefit from government diesel subsidies.Steve/flickr, CC BY-NC-ND
Nations that are dependent on oil revenues will therefore require immediate economic and financial reforms in 2016 to balance their budgets. One method being adopted by many Islamic states is the issuing of sharia law-approved bonds, known as sukuk. These bonds can be used to finance big projects such as the building of important infrastructure, including airports, and developing other natural resources.
Malaysia has been leading the way on this, banking on its burgeoning Islamic finance industry to reduce its oil earnings shortfall. It is planning to sell $1 billion to $1.5 billion of sovereign credit in 2016 on top of global Islamic bonds this year.
The Saudi Arabian government is similarly depending on both conventional sovereign bonds and sukuk to finance its budget deficit. In 2015, the kingdom issued sovereign bonds worth around 100 billion riyals ($26.5 billion) to ease the shortfall. It’s all part of a $130 billion spending plan to diversify its economy away from oil. But to increase its share of the Islamic finance market, it will need to follow Malaysia’s lead in making the regulations clear for trading sukuk.
Many more oil exporters are turning to sukuk bonds to cover their deficits, including Bahrain, Oman, Qatar and Nigeria, Africa’s largest oil producer. The sukuk bond market is forecast to grow by 15% in 2016 as a result.
The emergence of sukuk has been a significant development in Islamic capital markets for many oil rich nations in the Middle East and South East Asia. Funds raised through sukuk can be allocated in an efficient and transparent way. Sukuk issuance has proven its resilience during recent periods of turbulence in global capital markets and it is showing its potential to act as a cushion for falling oil prices for oil rich countries.
Author: Nafis Alam, Associate Professor of Finance, Director- Centre for Islamic Business and Finance Research (CIBFR), University of Nottingham
The HIA has published “The Residential Outlook for 2016”.
In 2015 new dwelling commencements increased for a third consecutive year in 2014/15 to a record high of 211,860. It is only the fifth time in the past sixty years that commencements (housing starts) have racked up three straight years of growth. The record level of nearly 212,000 starts is 13 per cent higher than the previous cyclical high of 187,000 reached all the way back in 1994.
Renovations activity is still grinding out a recovery, with little sign at this stage of accelerating momentum.
The residential property price growth cycle has peaked, but it’s a very disparate geographical story – if you don’t live in Sydney or Melbourne then you don’t have a boom.
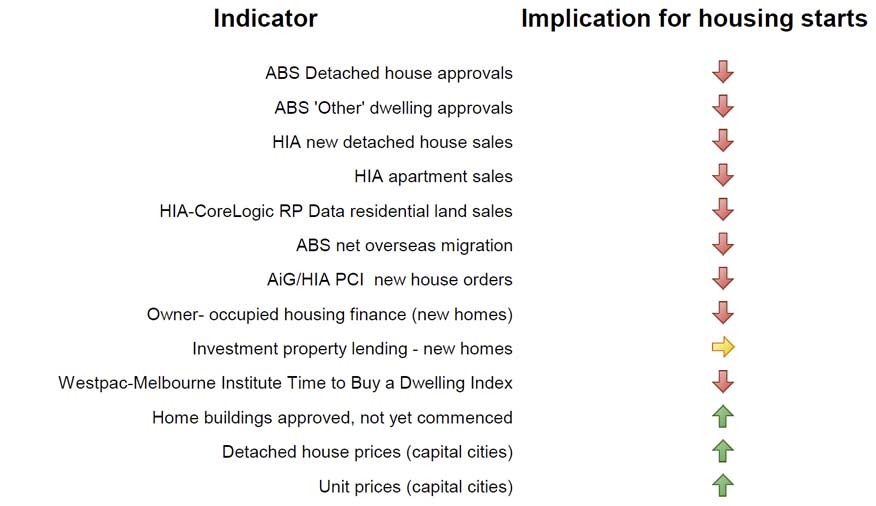
Looking forward, there is upward momentum evident for only three out of thirteen variables (plus we’re calling investment lending for new properties as being ‘neutral’, although some would call it down), compared to six pointing up in the middle of the year and ten last summer. As of the end of 2015, nine variables are now pointing down. This is the weakest HIA/ACI Housing Indicator Profile in over four years.
The key points to note about this housing cycle are:
the changing mix of what we build;
the large geographical divergences across states and territories;
the downside risk to new home construction from 2016/17.
There are very different trajectories evident for the various types of building approvals and dwelling commencements reported by the Australian Bureau of Statistics – semi-detached dwellings compared to units of four storeys or more, for example. The dwelling composition forecasts produced by Australian Construction Insights, the consultancy arm of HIA Economics, suggests further upward momentum in the short term for: detached houses; semi-detached dwellings (of two storeys); and units of one or two storeys.
On the topic of geography, momentum is clearly with the eastern seaboard markets, including some renewed promise for the southeast corner of Queensland. New South Wales is the strongest housing market in Australia, followed by Victoria. The Scorecard has accurately picked the shifting geographical sands for housing markets over the last couple of years, as has the CommSec State of the States report in terms of broader domestic economic conditions.
HIA is forecasting a modest decline of 5.5 per cent in national new dwelling commencements in 2015/16 to a level of just over 200,000. On a calendar year basis commencements are expected to hit 211,490 in 2015, but we see upside risk to this forecast.
In other words, the formal peak for the cycle could turn out to be calendar year 2015 rather than fiscal year 2014/15. The eastern seaboard will drive the short term health of Australia’s new home building sector.
HIA suggest a growth in the value of renovations of 1.6 per cent in 2017/18 and 3.7 per cent in 2018/19 to boost the value of Australia’s renovations market to $31.20 billion.
Australia’s only two strong dwelling price markets – Sydney and Melbourne – will experience a slowing rate of growth in 2016 as the cycle continues to run out of puff. No doubt that trend will provide the doom-sayers with plenty of opportunity to write exaggerated headlines and try to scare the living daylights out of people.
The fact is, outside of Sydney and Melbourne the term ‘housing price boom’ seems like a foreign language. Brisbane was showing signs of joining the eastern seaboard club this time last year – as we noted at the time – but a lack of population growth capped that situation rather quickly. As of November 2015 Brisbane was still the third fastest growing state capital residential property price market in the country behind Sydney (+12.8 per cent yoy) and Melbourne (+11.8 per cent yoy), but at 4.0 per cent per annum you would hardly call Brisbane a boom market.
The aggregate price cycle, heavily masked by Sydney and Melbourne, will continue to experience decelerating growth. Sydney and Melbourne are our two biggest markets and it is appropriate that price growth is slowing. Variable mortgage rates are on the rise under the guise of covering increased funding costs and there may be more of that to come in early 2016. That will dampen price growth. The rationing of credit overseen by APRA has occurred more broadly than justified.
The Government asked the Review Panel (the Panel) to examine and report on the effectiveness of the law relating to small amount credit contracts (SACCs), and to make recommendations on whether any of the provisions which apply to small amount credit contracts should be extended to consumer leases.
The interim report, just released, sets out the Panel’s initial observations in key areas and canvasses potential policy options. The interim report does not make recommendations nor does it provide the final view of the Panel.
Observation 1 One of the key outcomes of regulation in the financial sector should be the facilitation of consumers onto a path of financial inclusion rather than exclusion.
Observation 2 The responsible lending obligations do not appear sufficient to prevent financial harm to consumers who use SACCs. Additional consumer protection specific to SACCs seems to be required. ASIC enforcement of the responsible lending practices of SACC providers should be a priority.
Observation 3 High levels of repeat borrowing appear to be causing consumers financial harm. The structure of the SACC cap and industry costs appears to promote repeat borrowing and the rebuttable presumptions do not appear to have limited repeat borrowing.
Observation 4 The limit on the amount that a SACC provider can recover in the event of default is an important safeguard for consumers. However, in some circumstances, the fees charged on default appear to be charged in a manner that significantly disadvantages vulnerable consumers.
Observation 5 Some SACC providers do not appear to be giving consumers any benefit or discount when they make early repayments or pay back the loan in full before the due date. These practices may result from the SACC cap being based on a fee, rather than an interest rate.
Observation 6 The high cost of consumer leases appears to be causing consumers financial harm. While there are technical differences between credit contracts and consumer leases, these differences do not appear to justify consumer leases being excluded from the consumer protection regulations that apply to other forms of finance under the Credit Act.
Observation 7 During consultation, stakeholders noted that a large proportion of the cost of consumer leases can be attributed to add on products. There is little transparency regarding the nature or cost of these services and the value that they provide to consumers. It may not be clear to consumers that these features are available when they enter into a lease, or that they extend beyond the statutory guarantee under the Australian Consumer Law.
Observation 8 If a cap were to be introduced on a restricted category of consumer lease, it should be designed in a way that limits the risk of avoidance. Although extending a cap to all leases and broadening the scope of the Credit Act to include indefinite term leases are matters outside the terms of reference of the review, government may wish to consider the implications for those leases outside the scope of this review.
The interim report is an opportunity for stakeholders to comment on the observations and options presented including whether they would be workable in practice and if one option is likely to be more effective than another. This is an opportunity for stakeholders to provide additional data and evidence to support alternative views. Further views are sought, along with cost/benefit analyses, on these observations and options.
The responses to the interim report will be used, in addition to the submissions and feedback already received, to formulate final recommendations.
Crowd-sourced funding (CSF) is an emerging form of funding that allows entrepreneurs to raise funds from a large number of investors. It has the potential to provide finance for innovative business ideas and additional investment opportunities for retail investors, while ensuring investors continue to have sufficient information to make informed investment decisions.
The Bill will remove regulatory barriers to CSF, and will make available a new funding source for businesses. It is expected that the overall ‘per business’ compliance costs for issuers that participate in crowd-sourced funding will decline. However, given the likely growth in the number of businesses raising funds through these arrangements, the aggregate compliance burden over the economy is expected to increase.
A number of recent reviews have identified the potential of CSF to provide new and innovative businesses with access to the finance they need to develop their product or service and grow.
The Government’s Industry Innovation and Competitiveness Agenda, released in October 2014, called for consultation on a regulatory framework for CSEF.
The Murray Inquiry into Australia’s financial system, released by the Government in December 2014, specifically recommended reducing regulatory impediments to crowdfunding by introducing graduated fundraising regulation. In its response to the Inquiry, released in October 2015, the Government accepted this recommendation.
The Productivity Commission’s Business Set-up, Transfer and Closure draft report, released in May 2015, also supported the introduction of a CSEF framework.
Earlier in December, Minister for Small Business and Assistant Treasurer the Hon Kelly O’Dwyer said
“Today’s announcement is a key priority of the Turnbull Government’s National Innovation and Science Agenda”.
“CSEF or crowd funding is an emerging way for start-ups and early stage businesses to access the funding and investors they need, while maintaining adequate protections for retail investors who share in the risks and successes of these businesses.
“Following extensive consultation, the legislation will allow unlisted public companies with less than $5 million in assets and less than $5 million in annual turnover to raise up to $5 million in funds in any 12 month period.
“Companies that become an unlisted company in order to access crowd-sourced equity funding will receive a holiday of up to five years from some reporting and governance requirements.
“The Turnbull Government recognises the need to allow investors to make informed decisions and companies raising funds through crowd funding will be required to release an offer document.
“While investors will be able to invest an unlimited sum in crowdfunding, there will be a cap of $10,000 per issuer per 12-month period to ensure that mum and dad investors are not exposed to excessive risks.
“Australia’s CSEF model is competitive globally with the issuer cap of $5 million each year higher than the US and New Zealand cap, and the investor cap of $10,000 per issuance higher than the average in New Zealand and the UK.
“Intermediaries will play an important gatekeeper role and will need to conduct checks on companies before listing their offer. Intermediaries will be required to hold an Australian Financial Services Licence, providing issuers and investors with confidence in the integrity of the intermediary.
“Ongoing responsibility for issuing licenses for intermediaries and monitoring the operation of the crowd-sourced equity funding framework will sit with ASIC.
“Regulations to support the framework for crowd-sourced equity funding will be released for consultation shortly. The Government will also consult on options to facilitate crowd-sourced debt funding in 2016,”
Closing date for submissions: Friday, 29 January 2016.
A year later, we can look back to see significant changes to the current capital rules for “Advanced” banks (those that use their own approved internal models) and significant capital raisings of more than $30bn by the industry. This has translated into higher interest rates on mortgages, especially investment property loans.
Five Australian Banks have “Advanced” capital management, and a number of other banks are already on the journey to “Advanced” capital methods; but it is a complex and twisted path, and the destination is not yet clear. Better data, models and systems are required to meet the necessary hurdles.
What is likely though is that the journey to hold more capital is far from over, whether “Advanced” or “Standard”, and that the light between the two systems is closing, as the “Standard” system gets more complex, and the “Advanced” ratios are lifted higher.
We think that there will be only limited upside to be gained from moving to “Advanced”, as the gap closes, and complexity increases in the standard approach. We also think significant further capital will be required – some are suggesting an additional $30-40bn in the next couple of years, enough to force mortgage prices across the board significantly higher again. As these adjustments are essentially across the board, to a greater or lesser extent, we doubt that smaller players will actually get much differential benefit. Indeed, if investment mortgages require higher capital still. (that depends on the definition of what is “material” – yet to be made clear; and the LVR), some banks could need much more capital than is currently assumed.
It is also worth noting that spreads on overseas bank capital raisings are rising, indeed, spreads are wider now across the market, as we noted last week.
So what is the potential impact of lifting capital ratios? We already mentioned the uplift in mortgage rates, as banks seek to cover the additional costs involved. Households should expect to pay more. Shareholders may also have to take a haircut in future returns, as the economics of banks change. The super profits banks have enjoyed may be trimmed a little.
But a recent paper from the Bank of England has also highlighted that lifting capital may not reduce systemic risks much. The study, a working paper “Capital requirements, risk shifting and the mortgage market” looked at what happened when capital ratios were lifted. They found that whilst the average value of a loan made fell a little, there was no reduction in higher risk lending, despite the requirements for higher capital, because the lender was looking to protect overall margins and still chose to take more risks. If this is true, higher capital requirements does not necessarily reduced systemic risks. Banks may still need Government support in a crisis.
But wait, was that not the whole reason for lifting capital ratios in the first place? Looks like a schmozzle to me!
US Banks are increasing their exposure to commercial real estate and increased competitive pressures are contributing significantly to historically low capitalization rates and rising property values. Influenced in part by the continuing strong demand for such credit and the reassuring trends in asset-quality metrics many institutions’ CRE concentration levels have been rising.
A CRE loan refers to a loan where the use of funds is to acquire, develop, construct, improve, or refinance real property and where the primary source of repayment is the sale of the real property or the revenues from third-party rent or lease payments. CRE loans do not include ordinary business loans and lines of credit in which real estate is taken as collateral. Financial institutions with concentrations in owner-occupied CRE loans also should implement appropriate risk management processes.
Between 2011 and 2015, multi-family loans at insured depository institutions increased 45 percent and comprised 17 percent of all CRE loans held by financial institutions, and prices for multi-family properties rose to record levels while capitalization rates fell to record lows. At the same time, other indicators of CRE market conditions (such as vacancy and absorption rates) and portfolio asset quality indicators (such as non-performing loan and charge-off rates) do not currently indicate weaknesses in the quality of CRE portfolios.
During 2016, supervisors from the banking agencies will continue to pay special attention to potential risks associated with CRE lending.
The regualtors have jointly issued a statement to remind financial institutions of existing regulatory guidance on prudent risk management practices for commercial real estate (CRE) lending activity through economic cycles. They say that historical evidence demonstrates that financial institutions with weak risk management and high CRE credit concentrations are exposed to a greater risk of loss and failure. In general, financial institutions that succeeded during difficult economic cycles took the following actions, which are consistent with supervisory expectations:
established adequate and appropriate loan policies, underwriting standards, credit risk management practices, and concentration limits that were approved by the board or a designated committee; lending strategies, such as plans to increase lending in a particular market or property type, limits for credit and other asset concentrations, and processes for assessing whether lending strategies and policies continued to be appropriate in light of changing market conditions; and strategies to ensure capital adequacy and allowance for loan losses that supported an institution’s lending strategy and were consistent with the level and nature of inherent risk in the CRE portfolio.
conducted global cash flow analyses based on reasonable (not speculative) rental rates, sales projections, and operating expenses to ensure the borrower had sufficient repayment capacity to service all loan obligations.
performed market and scenario analyses of their CRE loan portfolio to quantify the potential impact of changing economic conditions on asset quality, earnings, and capital.
provided their boards and management with information to assess whether the lending strategy and policies continued to be appropriate in light of changes in market conditions.
assessed the ongoing ability of the borrower and the project to service all debt as loans converted from interest-only to amortizing payments or during periods of rising interest rates.
implemented procedures to monitor the potential volatility in the supply and demand for lots, retail and office space, and multi-family units during business cycles.
maintained management information systems that provided the board and management with sufficient information to identify, measure, monitor, and manage concentration risk.
implemented processes for reviewing appraisal reports for sufficient information to support an appropriate market value conclusion based on reasonable market rental rates, absorption periods, and expenses.
The Bank for International Settlements has released a document which sets out supervisory guidance on sound credit risk practices associated with the implementation and ongoing application of expected credit loss (ECL) accounting frameworks. The move to ECL accounting frameworks by accounting standard setters is an important step forward in resolving the weakness identified during the recent financial crisis that credit loss recognition was too little, too late. It is also consistent with the April 2009 call by G20 Leaders for accounting standard setters to “strengthen accounting recognition of loan loss provisions by incorporating a broader range of credit information”.
This guidance, which should be viewed as complementary to the accounting standards, presents the Committee’s view of the appropriate application of ECL accounting standards. It provides banks with supervisory guidance on how the ECL accounting model should interact with a bank’s overall credit risk practices and regulatory framework, but does not set out regulatory capital requirements on expected loss provisioning under the Basel capital framework.
The failure to identify and recognise increases in credit risk in a timely manner can aggravate underlying weaknesses in credit quality, adversely affect bank capital adequacy, and hinder appropriate risk assessment and control of a bank’s credit risk exposure. The bank risk management function’s involvement in the assessment and measurement of accounting ECL is essential to ensuring adequate allowances in accordance with the applicable accounting framework.
Supervisory guidance for credit risk and accounting for expected credit losses
A bank’s board of directors (or equivalent) and senior management are responsible for ensuring that the bank has appropriate credit risk practices, including an effective system of internal control, to consistently determine adequate allowances in accordance with the bank’s stated policies and procedures, the applicable accounting framework and relevant supervisory guidance.
A bank should adopt, document and adhere to sound methodologies that address policies, procedures and controls for assessing and measuring credit risk on all lending exposures. The measurement of allowances should build upon those robust methodologies and result in the appropriate and timely recognition of expected credit losses in accordance with the applicable accounting framework.
A bank should have a credit risk rating process in place to appropriately group lending exposures on the basis of shared credit risk characteristics.
A bank’s aggregate amount of allowances, regardless of whether allowance components are determined on a collective or an individual basis, should be adequate and consistent with the objectives of the applicable accounting framework.
A bank should have policies and procedures in place to appropriately validate models used to assess and measure expected credit losses.
A bank’s use of experienced credit judgment, especially in the robust consideration of reasonable and supportable forward-looking information, including macroeconomic factors, is essential to the assessment and measurement of expected credit losses.
A bank should have a sound credit risk assessment and measurement process that provides it with a strong basis for common systems, tools and data to assess credit risk and to account for expected credit losses.
A bank’s public disclosures should promote transparency and comparability by providing timely, relevant and decision-useful information.
Supervisory evaluation of credit risk practices, accounting for expected credit losses and capital adequacy
Banking supervisors should periodically evaluate the effectiveness of a bank’s credit risk practices.
Banking supervisors should be satisfied that the methods employed by a bank to determine accounting allowances lead to an appropriate measurement of expected credit losses in accordance with the applicable accounting framework.
Banking supervisors should consider a bank’s credit risk practices when assessing a bank’s capital adequacy
In June 2006, the Basel Committee issued supervisory guidance on Sound credit risk assessment and valuation for loans to address how common data and processes may be used for credit risk assessment, accounting and capital adequacy purposes and to highlight provisioning concepts that are consistent in prudential and accounting frameworks. This document replaces the Committee’s previous guidance.
A challenging economic environment – particularly weaker external demand conditions – has affected the fiscal outlook for Australia and New Zealand, resulting in delays to budget consolidation and potentially higher credit risks over the medium term, says Fitch Ratings.
Mid-year budget updates, released yesterday, highlighted the trajectory of a gradual return towards budget surplus remains for both countries, but weaker-than expected economic performance has pushed back consolidation timelines. However, low public indebtedness continues to be a strength, helping to anchor ratings during a period of heightened economic uncertainty.
Slowing external demand has led directly to weaker terms of trade. This has in turn resulted in budget deterioration, owing mainly to weakness on the revenue side, with lower nominal GDP growth likely to weigh on tax receipts. Yet lower inflation should restrain nominal expenditure growth, and currency depreciation has helped to cushion the fall in commodity prices in local-currency terms. The lower currencies of both countries has also boosted export competitiveness, particularly in the services sector which accounts for one-third and one-fifth of New Zealand and Australian exports, respectively.
According to the latest mid-year budget updates between fiscal years 2016-2019, Australia’s underlying cash balance relative to GDP is now expected to be on average 0.4ppt lower each year, while New Zealand’s Operating Balance Excluding Gains and Losses (OBEGAL) is on average 0.3ppt lower.
Australia is now projected to achieve a surplus in FY21, a year later than previously planned. Fiscal balances have started to fall behind many of the 11 other ‘AAA’ rated sovereigns. A failure to rebalance the economy away from mining is a potential risk over the medium term, which could put pressure on public finances and Australia’s credit rating.
However, this risk is only likely to materialise over the long term; rebalancing is only in the early stages, while services exports and residential investment are making bigger contributions to growth. We expect Australia’s gross government debt/GDP ratio to remain firmly below the ‘AAA’ median, and this affords time for a more protracted return to fiscal surplus – in the absence of a severe economic shock.
In New Zealand, the OBEGAL is likely to fall back into deficit in FY16 after unexpectedly reaching a surplus for the first time since 2008 in FY15. Fitch had previously highlighted that a reduction in the general government deficit – leading to a steady reduction in public debt ratios – would be a trigger for positive rating action. But the Treasury now projects Net Core Crown Debt to peak at 27.7% of GDP in FY17, compared with a peak of 26.3% as forecast by the government in May. Nevertheless, New Zealand’s fiscal position still sits comfortably alongside its ‘AA’ peers despite the weaker outlook.
Higher-than-expected net migration inflows have been a boon for New Zealand’s medium-term fiscal outlook, limiting the downward revision to potential growth as a result of lower investment. Growth is now likely to increase from 2.5% to 2.6% in FY16 from a previous 2.8%. Net migration inflows have been due in part to fewer departures of New Zealand citizens to Australia. This has also contributed to a lower estimate of Australia’s medium-term potential growth rate, revised down from 3.5% to 3.0% by the Australian Treasury.
Both the Australian and New Zealand economies share vulnerabilities pertaining to high external indebtedness and commodity dependence, and run large current account deficits. Fiscal projections for both economies are highly sensitive to macroeconomic assumptions, including global demand and commodity prices. This may require the sovereigns to have a slightly larger buffer in public finances than similarly rated peers.