Wide Spreads May Block Future Rate Hikes

According to Moody’s the Fed’s first rate hike in more than nine years occurred in the context of a wider than 700 bp spread for high-yield bonds. This is noteworthy from corporate credit’s perspective. Never before in the modern era of the speculative-grade has bond market had the Fed hiked rates when the high-yield bond spread was wider than 625 bp.

Going forward, if the high-yield spread remains wider than 650 bp, the Fed may opt not to hike rates at the March 2016 meeting of the FOMC. Moreover, if the spread averages more than 700 bp during the next three months, a weakening of credit conditions may force the Fed to reconsider its current strategy.

Moreover, current outlooks for defaults and profits weaken the case in favor of a percentage point climb by fed funds over the next 12 months. Following the recessions of 2001 and 1990-1991, the Fed began to hike rates in June 2004 and February 1994. The latter two starts to a series of Fed rate hikes were accompanied by declining trends for the high-yield default rate and lively profits growth.
After dipping by a prospective -0.2% annually in 2015, the Blue Chip consensus projects a below-trend 4% rebound by 2016’s pretax profits from current production. An acceleration of labor costs vis-a-vis business sales may squeeze margins considerably in 2016.

The sharp ascent by the average EDF (expected default frequency) metric of US/Canadian below-investment-grade companies from December 2014’s 3.2% to a recent 6.7% highlights the worsened outlook for high-yield defaults.
Nevertheless, a fast rising high-yield EDF metric does not necessarily rule out another Fed rate hike. For example, fed funds was lifted from May 1999’s 4.75% to May 2000’s 6.50% notwithstanding an ominously elevated average high-yield EDF metric of 7.9%, whose then rising trend could be inferred from its average yearly increase of a full percentage point. However, it should be added that by January 2001 the Fed was forced to quickly slash fed funds to 5.5%. Yet the latter was not enough to prevent March 2001’s arrival of a recession.

But this time the Fed may not be indifferent to a worsening default outlook. Today’s macro backdrop compares unfavorably with that of 1999 and early 2000. The 4.5% annual surge by real GDP during the year-ended Q1-2000 towers over the 2.5% growth expected of real GDP for 2015 and 2016.

In addition, the labor market was much tighter according to how payroll employment’s 62.3% share of the working-age population was much greater than the recent 56.7%. Further, unlike the 3.7% year-over-year increase by the average hourly wage for the 12-months-ended March 2000, the average wage now rises by a much slower 2.3%. Thus, it’s doubtful that policymakers will shrug off another extended stay by the high-yield EDF metric of 6.5% or greater. Unless credit conditions improve, the current series of prospective rate hikes may be cut short.

Moody's-Chart
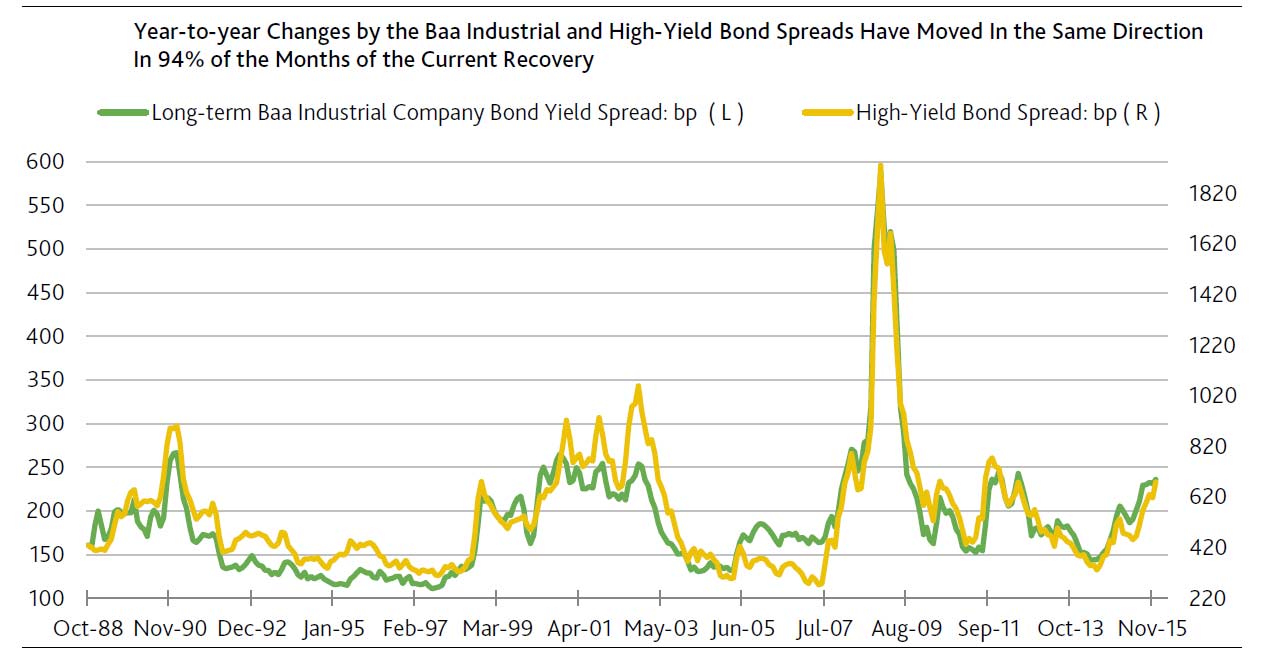
Contrary to conventional wisdom, the yield spreads over Treasuries of investment- and speculative-grade bonds are highly correlated. For a sample beginning with July 1991 and ending in November 2015, the high-yield bond spread shows surprisingly strong correlations with Moody’s long-term industrial company bond yield spreads of 0.93 for Baa-grade bonds and 0.90 for single-A-rated securities.

SME Deposits and Basel

APRA has today written to ADIs about best practices in assessing SME deposits accounts. Essentially, in a recent review of 14 institutions, they found significant inconsistencies, based on how individual ADI’s were choosing to flag balances as a “stable deposit”, whether the customer was in a “stable relationship” with the ADI, and which types of account – especially internet based account should be considered “less stable deposits”. In addition “heavily rate driven deposits” need to be correctly classified.

This complexity is a result of the Basel Committee who  introduced a globally harmonised liquidity framework by developing two minimum standards with the objective of promoting short-term and long-term resilience. The Liquidity Coverage Ratio (LCR) and the Net Stable Funding Ratio (NSFR) were developed to fulfil these objectives and to also enable regulators and investors to make meaningful comparisons between banks. APRA’s expectation is that ADIs with similar business models, balance sheets and customer groups would generate similar cash outflows under the LCR.

The net effect may well be to change the relative attractiveness of rates offered by banks, especially for call deposits offered on line, as they will cost the banks more. On the other hand, deposits, held as part of a longer relationship, with notice periods attached could become more attractive.

Finally, APRA noted that few ADIs benchmarked their offered rates against rates offered by peer competitors for the purposes of this classification and suggests that such benchmarking would constitute good practice.

DFA looked at SME savings balances in our recent report. SME’s have deposits in total worth more than $107bn. The distribution of deposits varies with size. Nearly half is held by the largest firms, and holdings decrease as we look across the smaller-sized firms. The average savings balance varies also between firms which are credit avoiders, and those who are not.


Major Banks’ Shareholders Highly Leveraged; Profits $37bn, Up 10%

The recently released APRA quarterly banking performance statistics to September 2015 tells an interesting story. We have charted data for the major Australian banks which shows continued housing loan growth, and considerable lifts in the capital ratios in 2015.

However, looking directly at the ratio of gross advances to share capital (ignoring reserves and other factors), we still see the shareholders are highly leveraged, at 4.9% (up from a recent all-time low of 4.7% in June). This is a function of having an ever greater share of home loans in the portfolio, (with lower risk weights). It shows how reliant the banks are on expanding their mortgage books (so directly linked to rising house prices etc.).

Major-Banks-Financals-Sept-2015More broadly, looking at all the ADI’s, on a consolidated group basis, there were 159 firms operating in Australia. The net profit after tax for all ADIs was $37.0 billion for the year ending 30 September 2015. This is an increase of $3.5 billion (10.3 per cent) on the year ending 30 September 2014.

The return on equity for all ADIs was 14.1 per cent for the year ending 30 September 2015, compared to 14.2 per cent for the year ending 30 September 201.

The total assets for all ADIs was $4.58 trillion at 30 September 2015. This is an increase of $420.9 billion (10.1 per cent) on 30 September 2014.

The total gross loans and advances for all ADIs was $2.91 trillion as at 30 September 2015. This is an increase of $237.7 billion (8.9 per cent) on 30 September 2014.

The total capital ratio for all ADIs was 13.7 per cent at 30 September 2015, an increase from 12.4 per cent on 30 September 2014.

The common equity tier 1 ratio for all ADIs was 10.1 per cent at 30 September 2015, an increase from 9.2 per cent on 30 September 2014.

The risk-weighted assets (RWA) for all ADIs was $1.86 trillion at 30 September 2015, an increase of $157.0 billion (9.2 per cent) on 30 September 2014.

Impaired facilities and past due items as a proportion of gross loans and advances was 0.87 per cent at 30 September 2015, a decrease from 1.09 per cent at 30 September 2014. Specific provisions as a proportion of gross loans and advances was 0.22 per cent at 30 September 2015, a decrease from 0.28 per cent at 30 September 2014.

Brokers responsible for more than half of interest-only lending

From Australian Broker.

More than half of interest-only loans come through the third party channel, corporate regulator ASIC has revealed ahead of its forthcoming review of mortgage brokers in regards to interest-only lending.

Speaking at the FBAA conference held on the Gold Coast in November, ASIC senior executive leader – deposit takers, credit & insurers, Michael Saadat announced that the regulator would turn its focus to mortgage brokers following its recent review of banks in regards to interest-only lending.

Saadat has now revealed to Australian Broker that the shift in focus has come after its review of lenders found that interest-only loans through the broker channel increased by 8% over two years.

“Since 2012, the proportion of interest-only loans sold through the broker channel has gone up from 49% to 57% as of the fourth quarter of 2014.”

However, despite writing more than half of the interest-only loans in the market, Saadat said the review found that the average value of an interest-only loan submitted by a broker was less than that of a bank.

“Clearly brokers are involved in arranging interest-only loans but the other thing we noted in our report was the size of interest-only loans also varies by channel, and actually, it is the direct channel rather than the broker channel where the larger interest-only loans have been provided.”

ASIC’s forthcoming review will analyse quantitative and qualitative data of around 10 to 12 large broking groups, according to Saadat. The review will also have a focus on record-keeping practices.

“We will also be looking to get individual customer files to see how brokers are meeting their responsible lending obligations, and how they go about recording the information they obtain and the verification they conduct on the file,” Saadat told Australian Broker.

“One of the findings of our review of lenders’ files was that record keeping practices were not as good as they could be, so we are quite interested to see how brokers are going with record keeping as well.”


Google trumps Apple for Australian mobile payments, but for how long?

From The Conversation.

After failing to come to agreement with Apple to enable mobile phone payments, six of Australia’s biggest financial institutions this week signed on with Android Pay. The service will go live in Australia in the first half of 2016.

Both Android Pay and its competitor Apple Pay allow consumers to pay for purchases using a card-linked mobile phone by tapping their phone in the same way you would tap your card at the point of sale. The services also work with smart watch devices, and in the case of Apple Pay, by holding the fingerprint on the phone.

Apple Pay had first mover advantage in the mobile payments space, having launched in the US in October 2014 and then in Britain in July 2015, before entering the Australian market this November.

To achieve traction in the US Apple Pay relied on the major American payment card issuers, earning money by taking a slice of the interchange fees that American card issuers gained from merchants. Interchange fees in the US average out at about US$1 for every US$100 of transactions and Apple Pay is believed to earn about US15 cents on every US$100 of transactions.

Apple Pay had been asking for the same slice of the interchange fees that are earned by the card issuers in other countries. In Britain the banks were able to negotiate Apple Pay’s slice to a much lower fee, believed to be only a few pence per one pound transaction, partially because interchange fees in Britain are much lower than in the US. Apple Pay originally wanted the same 15 cents for every $100 spent on its platform in Australia. But Australia’s main banks would not agree to this, given interchange fees in Australia are on average 50 cents for every $100 spent.

Apple Pay boxed in

When Apple Pay finally launched in Australia it was in tandem with American Express, which at that time was not subject to the RBA imposed interchange fees that applied to MasterCard and Visa payment cards. Since then the RBA’s Review of Card Payments Regulation suggested bringing so-called American Express “companion cards” into the interchange regulatory fold. This would make them subject to the same interchange fee cap as MasterCard and Visa. This would help the RBA to achieve its aim of “competitive neutrality” between the various card schemes.

At first Apple Pay’s choice of American Express seemed like a good one. American Express has around 6.8 million credit and charge cards in circulation, of the total of around 42 million payment cards in Australia. But Apple Pay can only be used on American Express’s “proprietary” cards (not on its “companion cards”) and an RBA survey in 2014 found companion cards are now more widely held than American Express proprietary cards. So in reality Apple Pay can only be used on a minority of American Express cards in Australia.

And since American Express charges a higher average merchant service fee (1.7%), more retailers accept MasterCard and Visa. Small to medium sized enterprises are also less likely to accept American Express and this may prove to be an Achilles Heel for Apple Pay.

Deal breaker?

Imagine going into your local café to buy two coffees, using Apple Pay via your American Express card, say at $3.80 per coffee. Total cost to you $7.60. If the café charges a 2% surcharge for accepting American Express, then you will pay $7.75. Why pay 15 cents more, when you could use your MasterCard or Visa, credit or debit card? You can easily avoid the surcharge and still “tap and go”.

In Australia almost 70% of credit card transactions are now “tap and go”, and Australia is thought to be the world leader in the adoption of contactless payments. This is thanks to a simultaneous push to encourage merchants to use terminals that accept contactless cards and the willingness of the banks to issue these cards to customers. The “tap and go” functionality that Apple Pay offered as an innovation in the US was already a feature of the market here in Australia.

And despite initial enthusiasm for Apple Pay, persuading US consumers to switch from using physical cards or cash to using Apple Pay has been tough going. A recent survey found Apple Pay use was declining. Indeed shoppers used it on “Black Friday” (November 27, 2015) for only 2.7% of their transactions.

Australian challenge

In Australia, Android sales beat out Apple in the three months to October 2015, with Android operating system sales at 54.9%, compared to 37.9% for Apple’s iOS. So the decision by a group of Australian bank card issuers to go with Android Pay seems to make sense. ANZ Bank, Westpac (including Bank of Melbourne, Bank of South Australia and St George), Bendigo and Adelaide Bank, ING DIRECT, Macquarie Bank and the credit union payments provider Cuscal will be the first to offer eftpos, MasterCard and Visa on Android Pay from mid-2016.

Apple’s first mover advantage may turn out not to be so critical in Australia, but watch this space!

Author: Steve Worthington, Adjunct Professor, Swinburne University of Technology

APRA Declares Countercyclical Buffer Rate Is Zero

APRA has today announced that the countercyclical capital buffer applying to the Australian exposures of authorised deposit-taking institutions (ADIs) from 1 January 2016 will be set at zero per cent.

The countercyclical buffer was included within the ADI capital framework as part of the Basel III reforms that were introduced by APRA in 2013. Although the minimum Basel III requirements were implemented from 1 January 2013, the buffer component of the framework will take effect from 1 January 2016.

The capital framework requires ADIs to hold a buffer of Common Equity Tier 1 (CET1) capital, over and above each ADI’s minimum requirement, comprised of three components:

  • a capital conservation buffer, applicable at all times and equal to 2.5 per cent of risk-weighted assets (unless determined otherwise by APRA);
  • an additional capital buffer applicable to any ADI designated by APRA as a domestic systemically important bank (D-SIB), currently set to 1.0 per cent of risk-weighted assets; and
  • a countercyclical buffer which may vary over time in response to market conditions. This buffer may range between zero and 2.5 per cent of risk-weighted assets.

The role of the countercyclical buffer within the Basel III reforms is to ensure that banking sector capital requirements take account of the macro-financial environment in which ADIs operate. It can be deployed by national jurisdictions when excess aggregate credit growth is judged to be associated with a build-up of system-wide risk to ensure the banking system has a buffer of capital to protect it against future potential losses. The buffer can be reduced or removed when system-wide risk crystallises or dissipates. For an ADI with international exposures, the countercyclical buffer applicable to its business will be the weighted average of the countercyclical buffers applied by the jurisdictions in which it operates.

APRA Chairman Wayne Byres noted the decision to set the countercyclical buffer for Australian exposures at zero per cent of risk-weighted assets was made following consultation with the Council of Financial Regulators.

‘Based on APRA’s assessment of current levels of systemic risk, including credit growth, asset prices and lending standards, APRA did not see a case for imposing a countercyclical buffer for Australian exposures at this point in time,’ Mr Byres said. ‘APRA will continue to monitor developments in a range of financial risk indicators, and will revise the determination if conditions warrant it in future.’

The consequence of this decision is that ADIs will generally be required, from 1 January 2016, to maintain a minimum CET1 ratio of 4.5 per cent, plus a 2.5 per cent capital conservation buffer (3.5 per cent for D-SIBs) and a buffer for international exposures in jurisdictions that have set a non-zero countercyclical capital buffer rate. For some ADIs, additional capital requirements are also applied via Pillar 2 (i.e. in response to institution-specific risks and issues). All Australian ADIs currently report CET1 ratios above these requirements: the aggregate CET1 ratio for the banking system as at end September 2015 was 10.1 per cent.

Where an individual ADI does not hold sufficient capital to meet its aggregate buffer requirement, the ADI would be subject to constraints on its ability to make capital and bonus distributions. The distribution constraints imposed on an ADI when its capital levels fall into the buffer range increase as the ADI’s capital level approaches the minimum requirements. This encourages ADIs to maintain a sound capital buffer and provides a mechanism to ensure ADIs conserve capital, and have a strong incentive to restore their capital strength, after a period of loss.

In addition to today’s announcement on the size of the buffer, APRA has also released today:

  • an information paper, The countercyclical capital buffer in Australia, setting out APRA’s approach to assessing the appropriate settings for the countercyclical buffer;
  • a revised and final version of Prudential Standard APS 110 Capital Adequacy (APS 110) that clarifies operational aspects of the countercyclical capital buffer, following consultation earlier this year; and
  • a draft version of Prudential Practice Guide APG 110 Capital Buffers (APG 110) for consultation. The draft APG110 provides additional guidance on the operation of the capital buffers, including some worked examples.

APRA has also informed the Basel Committee on Banking Supervision of the Australian countercyclical capital buffer rate so it can be added to the list of jurisdictions’ buffers that are maintained on the Bank for International Settlements’ website.

The countercyclical buffer information paper, the draft prudential practice guide on capital buffers, and the revised prudential standard APS 110 can be viewed on APRA’s website.

Are we seeing a new dawn for affordable housing?

From The Conversation.

Potentially trailblazing plans for state-assisted financing of affordable housing are emerging in New South Wales. In what looks to be a landmark policy announcement with possible national ramifications, the NSW government last week outlined the first phase of Premier Mike Baird’s March 2015 election commitment to establish a A$1 billion fund for social and affordable housing.

But for the short-lived GFC housing stimulus, this is the first significant rental housing supply subsidy in Australia since the 2008 National Rental Affordability Scheme (NRAS).

While full details are yet to be disclosed, it appears the Social and Affordable Housing Fund (SAHF) will be something like a “future fund” or endowment scheme. Government will invest a capital sum in revenue-generating assets. The resulting returns will underpin annual payments to approved consortia over 25-year terms.

This ongoing subsidy will help community housing providers bridge the gap between rental revenue and operating costs. Most importantly, it includes repayment of construction debt raised from private financial institutions such as banks and super funds. Perhaps in awareness of research evidence on ways to minimise the cost to taxpayers of private finance for affordable housing, officials acknowledged the possibility of a government guarantee or other credit support on loans to consortia.

In principle this is quite a big deal. The more familiar policymaking style involves one-off or pilot initiatives. The SAHF is presented as an ongoing budget commitment to state-supported social and affordable housing growth, with phases two, three and four of the program signalled at the launch.

Second, as the name implies, SAHF is centred on “social” housing: it has a 70% minimum social housing requirement. Unlike schemes such as the NRAS, most of the homes will be financed to allow rents set at levels manageable for very low-income groups rather than affordable only to moderate-income earners.

In the post-GFC world this is highly unusual. For example, only in Scotland does a significant UK social housing investment program remain intact.

Third, and most important, the fund’s creation reflects a long-overdue official recognition that, left to itself, the market does not and cannot provide decent housing that low-income groups can afford.

Big plans, but starting small

Having promised voters a $1 billion housing fund, the Baird government has announced phase one plans for 3,000 homes – a fraction of what’s needed. AAP/Nikki Short

While potentially important in principle, the SAHF is decidedly modest in practice, at least in its initial phase. The statewide target – implicitly to be achieved over several years – is for just 3,000 homes. This will barely scratch, let alone seriously dent, the backlog of 60,000 applicants marooned on the NSW public housing waiting list.

And that’s before you even consider the tens of thousands of unregistered low-income private tenants pushed into poverty by high rents across the state. In Sydney alone, 94,000 families and single people were in this position in 2011. Many if not most will be additional to those on the public housing list.

Nevertheless, there’s a lot to like in the NSW government’s approach. It puts non-profit community housing providers (CHPs), which have a strong track record of high-quality tenancy management, front and centre. Registered CHPs will manage all SAHF housing.

The scheme offers a long-term (up to 25 years) operating subsidy that can be matched to a private financing deal. This gives private investors like super funds the certainty they need. “We’ve listened and we’ve read the reports on that,” officials said.

And it recognises the cost to social landlords of co-ordinating services for tenants who have support needs: the operating subsidy will include a component for this. The 2010 Henry review of taxation recommended this.

Limits to affordable land must be overcome

Having access to land at an affordable price is fundamental to successful affordable housing strategies. Phase one of the SAHF relies on unlocking land to develop social housing owned by churches, NGOs and other philanthropic sources. This is a finite strategy and we query whether well-located sites for 3,000 dwellings will be forthcoming? What then?

The state government has the two-part answer in its power. First, it must require all medium- and large-scale residential projects to include a reasonable component of affordable housing. For Sydney, we suggest a city-wide target in the region of 15-25%.

There is a once-in-a-generation opportunity right now in Sydney to do this as large-scale redevelopment plans unfold along transport corridors, in precincts and renewal areas. Once developers have bought up that land it will be too late. They need to be able to factor into their feasibility plans the cost of providing the affordable housing, and thereby reduce the price they offer for sites.

Second, state and local government-owned land made available for affordable housing (for example, public housing estates slated for renewal, surplus government sites and air spaces above public sites) must be priced at a level that affordable housing developers can afford to pay to keep their costs (and therefore the government operating subsidy exposure) to a minimum.

Only by linking its financing strategy with favourable pricing of state land offers and planning policy changes will the SAHF be scalable and durable – offering potential to reduce the unacceptably high levels of unmet housing need.

Premier Baird is expected to announce further details of the fund early in the new year. With worsening affordable housing shortages around the country, it must be hoped that the prime minister, his treasurer and his cities minister, as well as premiers and treasurers across Australia, will tune in to learn more on this constructive initiative.

Authors: Hal Pawson, Associate Director – City Futures – Urban Policy and Strategy, City Futures Research Centre, Housing Policy and Practice, UNSW Australia;  Vivienne Milliga, Associate Professor – City Futures Research Centre, Housing Policy and Practice, UNSW Australia.


Risk on? Interest rates could stay low for decades

From The Conversation.

When a central bank lifts interest rate targets by 0.5% it expects households and firms to respond. In a crisis, the official target may fall by 3% in order to shock the economy into a positive response. These movements of interest rates by the central bank are an important tool of macroeconomic adjustment

They are also relative to the longer term, or normal rate of interest in the economy. What is interesting now is that rates have been low for quite a long time suggesting the natural rate of interest in the economy has fallen permanently.

A recent research paper from the Bank of England suggests that the global neutral interest rate may settle at or below 1%. To put this in context, the paper suggests that rate was around 5.5% in the 1980s (yes, that is real, so adjusted for inflation).

Central banks will get into a tizz about this because it gives them less room to cut rates to stimulate the economy. It gives the bankers much less room to cut interest rates in a crisis.

The reasons for the fall are broadly that saving has tended to increase and investment to fall; more money is available but fewer people want to borrow, thus driving down rates. The authors of the Bank of England paper argue the trends will not change abruptly so we can expect low rates for a long time.

They suggest savings have tended to increase in part for demographic reasons, because of rising inequality, and from a desire by Asian governments to maintain a financial buffer. The main demographic reason has not been ageing, but a decline in the dependency ratio: as birth rates have fallen, the proportion of people who were not of working age has fallen from 50% to 42% over the last 30 years. With fewer children people have been able to save more.

Piketty and others have pointed out the increase in within-country inequality over the last few decades, and since richer people save more than poor people, this too has tended to boost savings.

At the same time the authors argue that investment has fallen for three main reasons. The most important is the fall in the price of capital equipment which has meant that a given increase in output can now be obtained more cheaply (with a lower investment spend).

Investment by government has also fallen slowly but surely over recent decades, albeit with some uptick in response to the global financial crisis. It is less clear why this has happened but I suspect it is because government revenue growth is limited by sensitivity around taxes, and government expenditure is increasingly directed towards transfer payments. Investment also seems to have fallen because it appears to have become relatively riskier – the return on capital has fallen but not nearly as much as the risk free rate – reducing the inclination of firms to invest.

What does it mean for you and I? Broadly we face a world which advantages investors and disadvantages savers. The returns on our investments in safe assets will be low and investors are likely to take on additional risks in order to boost returns. This makes it hard for Australian investors since banks and miners dominate our exchange: the low interest rate environment is not good for banks, and there is no clear end in sight to the commodity price downturn.

As voters we should be less concerned about public debt than we were. The case for policy changes which stimulate growth has increased, and increased government investment in productive assets is strengthened.

Author: Rodney Maddock, Vice Chancellor’s Fellow at Victoria University and Adjunct Professor of Economics, Monash University

Fed Lifts Rates For The First Time in Years

Just Announced.

The Federal Reserve raised the Fed funds rate by 25 basis points to 0.25 percent – 0.5 percent, during its FOMC meeting held on December 16th. While the Fed said is “reasonably confident that inflation will rise, over the medium term, to its 2 percent objective” , Fed Governors were also carefully to point that “economic conditions will evolve in a manner that will warrant only gradual increases in the federal funds rate”. It was the first hike since June 2006 when Ben Bernanke increased the benchmark rate from 5 to 5.25 percent. From 1971 until 2015, Interest Rate in the United States averaged 5.93 percent, reaching an all time high of 20 percent in March of 1980 and a record low of 0.25 percent in December of 2008.

FED-Rate

Information received since the Federal Open Market Committee met in October suggests that economic activity has been expanding at a moderate pace. Household spending and business fixed investment have been increasing at solid rates in recent months, and the housing sector has improved further; however, net exports have been soft. A range of recent labor market indicators, including ongoing job gains and declining unemployment, shows further improvement and confirms that underutilization of labor resources has diminished appreciably since early this year. Inflation has continued to run below the Committee’s 2 percent longer-run objective, partly reflecting declines in energy prices and in prices of non-energy imports. Market-based measures of inflation compensation remain low; some survey-based measures of longer-term inflation expectations have edged down.

Consistent with its statutory mandate, the Committee seeks to foster maximum employment and price stability. The Committee currently expects that, with gradual adjustments in the stance of monetary policy, economic activity will continue to expand at a moderate pace and labor market indicators will continue to strengthen. Overall, taking into account domestic and international developments, the Committee sees the risks to the outlook for both economic activity and the labor market as balanced. Inflation is expected to rise to 2 percent over the medium term as the transitory effects of declines in energy and import prices dissipate and the labor market strengthens further. The Committee continues to monitor inflation developments closely.

The Committee judges that there has been considerable improvement in labor market conditions this year, and it is reasonably confident that inflation will rise, over the medium term, to its 2 percent objective. Given the economic outlook, and recognizing the time it takes for policy actions to affect future economic outcomes, the Committee decided to raise the target range for the federal funds rate to 1/4 to 1/2 percent. The stance of monetary policy remains accommodative after this increase, thereby supporting further improvement in labor market conditions and a return to 2 percent inflation.

In determining the timing and size of future adjustments to the target range for the federal funds rate, the Committee will assess realized and expected economic conditions relative to its objectives of maximum employment and 2 percent inflation. This assessment will take into account a wide range of information, including measures of labor market conditions, indicators of inflation pressures and inflation expectations, and readings on financial and international developments. In light of the current shortfall of inflation from 2 percent, the Committee will carefully monitor actual and expected progress toward its inflation goal. The Committee expects that economic conditions will evolve in a manner that will warrant only gradual increases in the federal funds rate; the federal funds rate is likely to remain, for some time, below levels that are expected to prevail in the longer run. However, the actual path of the federal funds rate will depend on the economic outlook as informed by incoming data.

The Committee is maintaining its existing policy of reinvesting principal payments from its holdings of agency debt and agency mortgage-backed securities in agency mortgage-backed securities and of rolling over maturing Treasury securities at auction, and it anticipates doing so until normalization of the level of the federal funds rate is well under way. This policy, by keeping the Committee’s holdings of longer-term securities at sizable levels, should help maintain accommodative financial conditions.

Why rising interest rates are bad news for emerging markets

From The Conversation.

All eyes are on the US Federal Reserve which is expected to raise interest rates for the first time in nearly a decade. Since the financial crisis in 2008, the US, along with the eurozone, UK and Japan have held their interest rates close to zero and used quantitative easing to flood financial institutions with capital.

This two-pronged approach to reviving economic growth has led to a colossal amount of money being injected into the global financial system, offered at next to nothing. While the aim has been to revitalise the consumer spending needed to boost the economies of advanced economies, developing countries are poised to be the victims of these policies.

More than US$12 trillion has been injected into the global financial system since 2008 all in the name of stabilising the global economy. The injection of hot money at this pace and quantity is nothing more than a false economy, and could sooner rather than later trigger massive economic challenges in emerging economies.

Investors have been able to borrow significant sums for very little and direct the proceeds into high-yielding assets in developing countries. A fire hose of cash has poured into investments, financing infrastructure and other projects. But the massive surge in the supply of cheap credit has created unstable bubbles.

As the following graph shows, key emerging economies such as Ghana, Nigeria, Argentina, Brazil, Thailand and Vietnam have seen dramatic increases in their debt stock. And they are not alone. World Bank data shows they are among 80 emerging markets whose debt has increased significantly since the financial crisis.

Conversation-Debt-Interest-1A number of others such as Mongolia, Mauritius and Papua New Guinea saw their debt stock increase by close to 1,000% in the five years following the 2008 financial crisis. These are all low income economies and so their ability to absorb economic shocks is minimal. If (and when) foreign investment is pulled out, they will suffer.

Conversation-Debt-Interest-2

Bubble bursting

If investment is withdrawn – as is likely when interest rates rise – this will leave a gaping hole in the financial system of the recipient countries. Investment in everything from infrastructure to health, education and manufacturing in these countries would be left chronically underfunded, as a colossal amount of money would need to be channelled towards debt-servicing for many years to come.

Not only this, an increase in interest rates could trigger a massive capital outflow from developing countries to where the return on investments has suddenly increased. This is likely to cause a massive shortfall in market capitalisation and burble-busting in the developing countries affected.

To fill the sudden shortfall in capital, the developing countries affected could turn to public or private lenders for urgent financial assistance. But this will increase their debt burden even further.

Most of the debt stocks owed by these developing countries are denominated in foreign currencies, with approximately 80% in US dollars. As the US raises interest rates, the US dollar will strengthen, which will significantly heighten the debt-servicing cost for countries paying back their debts in that currency. Given the nature of their fragile economies, developing countries including Nigeria, Vietnam, Ethiopia and Ghana are most likely to be vulnerable and may have to resort to further borrowing and a fire sale of valuable assets in order to meet their debt obligations.

Exchange rate uncertainty could also trigger a series of credit events, which are capable of hurting the countries’ credit rating. This could lead to margin calls and a review of the existing terms and conditions of lending. And this will only exacerbate the debt burden of the countries concerned even further.

Even a small percentage increase in interest rates is likely to cause shock waves across developing countries. It is a challenging time for emerging markets right now, with commodities in a prolonged slump, and with both China and the eurozone (other key investors) facing economic slowdown.

With an interest rate hike marking the end of cheap credit, this will cause a gaping hole in developing economies’ capital markets. The outflow of capital from their markets will in turn cause their currencies to depreciate further, while the US dollar will strengthen as money flows in. This could lead to even more serious and prolonged debt-servicing problems.

Author: Ola Sholarin, Senior Lecturer, Quantitative and Financial Economics, University of Westminster