Is The Root Cause Of High House Prices What You Think It Is?

A snapshot of data from the RBA highlights the root cause of much of the economic issues we face in Australia. Back at the turn of the millennium, banks were lending relatively more to businesses than to households. The ratio was 120%. Roll this forward to today, and the ratio has dropped to below 60%. In other words, for every dollar lent now it is much more likely to go to housing than to business. This is a crazy scenario, as we have often said, because lending to business is productive – this generates real productive growth – whilst lending for housing simply pumps up home prices, bank balance sheets and household balance sheets, but is not economically productive to all.

Lending-Mix
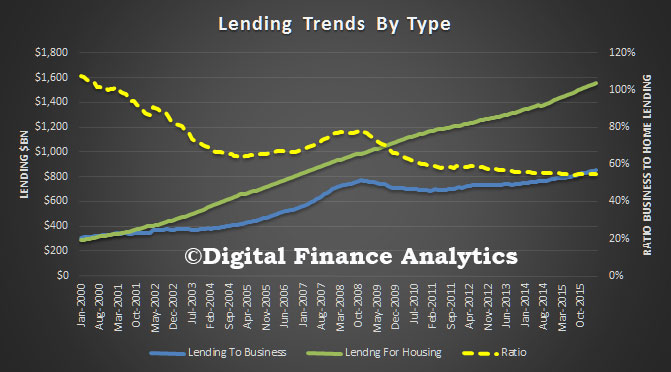
There are many reasons why things have changed. The finance sector has been deregulated, larger companies can now access capital markets directly and so do not need to borrow from the bank, generous tax breaks (negative gearing and capital gains) have lifted the demand for loans for housing investment, and the Basel capital ratios now make it much cheaper for banks to lend against secured property compared to business. In fact the enhanced Basel ratios were introduced in the early 2000’s and this is when we see lending for housing taking off.

So how much of the mix is explained by tax breaks for investors? If we look at the ratio of home lending for owner occupation, to home lending for investment, there has been an increase. In 2000, it was around 45%, now its 55% (with a peak above 60% last year). This relative movement though is much smaller compared with the switch away from lending to business.  Something else is driving it.

RBA-Mix-HousingWe therefore argue that whilst the election focus has been on proposed cuts to negative gearing and capital gains versus a company tax cut, the root cause issue is still ignored. And it is a biggie. The international capital risk structures designed to protect depositors, is actually killing lending to business, because it makes lending for housing so much more capital efficient. Whilst recent changes have sought to lift the capital for mortgages at the margin, it is still out of kilter. As a result, banks seek to out compete for mortgages and offer discounts and other incentives to gain share, whilst lending to business is being strangled. This is exacerbated by companies being more risk adverse, using high project hurdle thresholds (despite low borrowing rates) and smaller businesses being charged relatively more – based on risk assessments which are directly linked to the Basel ratios. Our SME surveys underscore how hard it is for smaller business to get loans at a reasonable price.

The run up in house prices is a direct result of more available mortgage funding, and this in turn leaves first time buyers excluded from the market. But it is too simple to draw a straight line between negative gearing and first time buyer exclusion. The truth is much more complex.

We are not convinced that a corporate tax cut, or a further cut in interest rates will stimulate demand from the business sector. Nor will reductions in negative gearing help that much. We need to re-balance the relative attractiveness of lending to business versus lending for housing.  The only way to do this (short of major changes to the Basel ratios) is through targeted macro-prudential measures. In essence lending for housing has to be curtailed relative to lending to business. And that is a whole new box of dice!


RBNZ Enhances Mortgage Reporting – 40% New Loans Interest Only

The New Zealand Reserve Bank has introduced new statistics on residential mortgage lending by payment type (i.e. interest-only and principal-and-interest). ‘Investor’ and ‘owner-occupiers’ are defined by the intended use of borrowed funds. A particular loan application may include a portion of both interest only and principal-and-interest payment terms. Figures in the new table represent the balance of new and existing lending for each payment type, not the number of loans.

In May 2016, almost 60 percent of all new mortgage lending was on principal-and-interest payment terms, while 40 percent was on interest-only payment terms. These proportions have been fairly stable since July 2015 when the data was first available. RBNZ-Int1Interest-only loans tend to convert to principal-and-interest loans after a period of time. In March 2016, 40 percent of new lending was on interest-only payment terms. However on the banks’ loan books only 28 percent of all existing mortgages are on interest-only payment terms. These proportions have been fairly steady over time.

RBNZ-Int2Interest-only lending is less likely to be high loan-to-value ratio (LVR greater than 80 percent) compared to principal-and-interest lending. The proportion of high LVR new lending has
declined slightly for all payment types since data was first available in July 2015. The portion of high LVR lending for all existing mortgages is somewhat higher than for new lending (12.9 percent compared to 7.9 percent in March 2016) but this has also been declining over time. The lower ‘high-LVR’ portion on new lending is due to the LVR restrictions, which will gradually filter through to existing lending as new lending is added to the banks’ loan books.

RBNZ-Int3In May 2016, about 55 percent of new lending for investor purposes was on interest-only terms compared to about 33 percent for owner-occupier purposes.These proportions have
been fairly steady over time. Only 1 percent of interest-only lending for investor purposes is above 80 percent LVR and this has been declining over time.

RBNZ-Int4

Don’t believe the Brexit prophecies of economic doom

From The Conversation.

The shock and horror at the Brexit vote has been loud and vociferous. Some seem to be revelling in the uncertainty that the referendum result has provoked. The pound falling in value, a downturn in markets – it lends credence to the establishment’s claims before the referendum that a Leave vote would lead to economic Armageddon.

But there are plenty of reasons to reject the consensus that Brexit will be costly to the UK’s economy. Even though markets appear stormy in the immediate aftermath of the vote, the financial market reaction to date has more characteristics of a seasonal storm than of a major catastrophe.

We were told that the consensus of economic experts were overwhelmingly opposed to a Brexit. Lauded institutions – from the IMF, OECD to the Treasury and London School of Economics – produced damning forecasts that ranged from economic hardship to total disaster if the UK leaves the EU. Yet 52% percent of the British electorate clearly rejected their warnings.

Something that my professional experience has taught me is that when an “accepted consensus” is presented as overwhelming, it is a good time to consider the opposite. Prime examples of this are the millennium bug, the internet stock frenzy, the housing bubble, Britain exiting the European exchange rate mechanism (ERM) and Britain not joining the euro. In each of these examples, the overwhelming establishment consensus of the time turned out to be wrong. I believe Brexit is a similar situation.

Downright dangerous

The economic models used to predict the harsh consequences of a Brexit are the tools of my profession’s trade. Used properly, they help us to better understand how systems work. In the wrong hands they are also downright dangerous. The collapse of the hedge fund Long-Term Capital Management in 1998 and the mispricing of mortgage backed securities leading up to the 2008 financial crisis are just two of many examples of harmful consequences arising from the abuse of such models.

The output of these often highly sophisticated models depends entirely upon the competence and integrity of the user. With miniscule adjustment, they can be tweaked to support or contradict more or less any argument that you want.

The barrage of dire economic forecasts that were delivered before the referendum were flawed for two main reasons. First, they failed to acknowledge the risks of remaining in the EU. And second, the independence of the forecasters is open to question.

Let’s start with the supposed independence of the forecasting institutions. While economists should in theory strive to be independent and objective, Luigi Zingales from the University of Chicago provides a compelling argument that, in reality, economists are just as susceptible to the influence of the institutions paying for their services as in other industries such as financial regulators.

Peer pressure

Another challenge faced by economists is presented by the nature of the subject matter. Economics is a social science which, at its heart, is about the psychology of human social interactions. Many models try to resolve the difficulties that human subjectivity causes by imposing assumptions of formal rationality on their models. But what is and is not rational is subjective. In further recognition of this difficulty the sub-discipline of behavioural economics has evolved.

Herding is a concept that has been used to rationalise financial market bubbles and various other behaviour. It describes situations in which it seems rational for individuals to follow the perceived consensus. Anyone who has found themselves in a position where the majority of their company has a radically different view to their own will have experienced the difficulty of standing out from the crowd.

In 2005-06, variouspeople (including myself) presented the view that house prices would crash. While some audiences were sympathetic, the majority view at the time was both hostile and derisory. Challenging the received wisdom exposes you to feelings of isolation.

Received wisdom among academia has been that the EU is a force for good that should be defended at all costs. Respected colleagues are incredulous that anyone with their education and professional insights could think otherwise and remain part of the academic “in” crowd. In such an environment, it is very difficult to challenge this orthodoxy.

I – and the bulk of the UK population – might have been convinced by the pro-Remain economists if they had been a little more honest about the limitations of their models, and the risks of remaining inside the EU.

Market reactions

Despite reports of markets crashing following the Brexit result, when you put the current level of volatility in context of other shocks, market conditions are not as bad as they might seem. The FTSE 100 is still higher than it was barely two weeks ago and the more UK-focused FTSE 250 is currently higher than it was in late 2014. This is the kind of volatility that markets see two or three times a year.

The volatility index for the US S&P, known as the VIX or the “fear gauge”, is what is widely used to measure how uncertain global financial market participants are about the outlook for stocks. When the Brexit result was first announced, the VIX moved sharply, but has since settled in the mid-20s. To put this in context, the all-time average is 20.7, the all-time closing low is 8.5 and the all-time closing high on Black Monday in 1987 was 150. More recently during the financial crisis, it reached a closing high of 87.2 in November 2008.

VIX volatility chart. CBOE

Other financial indicators also moved rapidly as the referendum results came through. On the face of it, the Japanese market suffered a severe shock falling almost 8%. However, the 8% fall in the Japanese stock market is almost exactly matched by an 8% gain of the Japanese yen relative to the pound. Therefore, the net effect for UK-based investors in Japanese equities is close to zero.

The fall in the value of the pound following the Brexit result is also not as bad as it may first appear. The size of the fall was exacerbated by the previous day’s assumption that Remain would win. There is also precedent for a dramatic fall – after the ERM crisis – which proved beneficial for many British exporting companies and arguably helped sustain the economic recovery of the 1990s.

A lower pound benefits companies that add most of the value to their products inside the UK, and companies that sell their produce on international markets. This includes exporters like pharmaceutical company GlaxoSmithKline, drinks company Diageo and technology company ARM – all of which saw stock price gains on the morning after the vote. Companies that rely on imports and add little value within the UK will be hardest hit in the short term as they adapt to the exchange rate volatility.

There will undoubtedly be winners and losers from the UK’s decision to leave the EU. But indexes for volatility are already lower than they were in February this year, suggesting that markets are not abnormally worried about the outlook, and UK government borrowing costs are at an all time low. This is further reason to reject the pre-referendum consensus that Brexit would bring economic doom.

Author: Isaac Tabner, Senior Lecturer in Finance, University of Stirling

Property price to income ratio is rising in Sydney, Melbourne and Canberra

From CoreLogic.

Utilising quarterly household income data from the Australian National University, CoreLogic has developed quarterly measurements of the ratio of property prices to annual household income.  This data is extremely valuable when looking to measure housing affordability.  The measure is available at a number of different geographies from SA2 regions (generally about the size of a suburb or group of suburbs) all the way up to GCCSA (capital city and rest of state) regions.  When looking at the analysis it is important to note that a higher ratio means housing is less affordable and a lower ratio indicates better affordability.

Chart 1
With property prices varying greatly between each of the capital cities it is interesting to note that the variation in household incomes in nowhere near as large.  In March 2016, Hobart had the lowest median dwelling price at $337,250 and Sydney had the highest median price at $775,000.  Meanwhile, household incomes range from as low as $1,175/week in Hobart to $2,118/week in Darwin.  Obviously the differences in property prices and incomes impact on housing affordability, so let’s take a look at each of the capital cities and the ratio of prices to income over time.

Outside of Sydney, Melbourne and Canberra housing affordability is improving with each capital city having a current ratio which indicates affordability has been worst in the past.  The problem is that almost 2 out of every 5 Australians live in either Sydney or Melbourne and these two cities have also been the epicentres of employment and economic growth over recent years.  Deteriorating housing affordability in Sydney and Melbourne impacts on significantly more people than deteriorating housing affordability elsewhere around the country.

This measure of affordability provides a high level overview of the relative housing affordability across the capital cities, but it is important to remember that geographically across each city the affordability story can be dramatically different.  Furthermore, this analysis does not take into consideration interest rates which can make housing affordability more affordable.  While interest rates are undoubtedly a consideration for buyers, they must also consider that interest rates can fluctuate dramatically over the life of a mortgage.

How to make sense of mortgage backed securities

A piece in The Real Estate Conversation, in which DFA is quoted.  “Ratings agency Standard & Poor’s says that RMBS now represent around 10% of Australian housing credit funding and has been trending upward since 2009”. Worth noting that whilst there has been growth since 2009, in absolute numbers, it remains way down from before the GFC.  You can read about our analysis on the impact of non-banks and their need to find other funding options.

Mortgage-Book

Films like The Big Short have shaped many people’s view of residential mortgage backed securities (RMBS).

Like all types of investing, RMBS come with their share of risks and they’re easy for Hollywood to dramatise. However, James Austin, chief financial officer of local non-bank lender Firstmac, says RMBS unfairly carry the load for everything that went wrong in the US in 2007.

“The reality is that in the US, RMBS was simply the tool,” says Austin. “It’s a bit like a builder blaming his hammer. In actual fact it’s the loans themselves and the way those loans were written that were the problem, not the underlying structure or tool.”

The lack of regulation in US markets prior to the global financial crisis also contributed to the mishandling of mortgage backed securities. This is important to understand when considering RMBS in Australia, which is a very different market.

The scoop on securities

RMBS serve two main functions: on the one hand they give investors access to the mortgage market, while on the other they help financial institutions free up or raise capital. Home loans are traditionally private transactions that stay on a lender’s balance sheet for the duration of the mortgage, which means all the capital that’s paid remains tied up.

However, by pooling many loans together into a ‘security’, which is basically a bond (or IOU) that’s legally backed by home loans, this capital is moved off the lender’s books and made available. So, in short, RMBS are debt securities that investors can purchase from financial firms, with a view to earning interest on the entire pool.

There are also different classes of securities called tranches, which are just packages of loans. These let investors target a segment of home loans based on their quality and duration.

“The bond will have a rating from the rating agency, so as an investor you can trade off your risk appetite with the return you want to get,” says principal of consultancy Digital Finance Analytics, Martin North. “For example, you might decide to go for a junk bond [high risk – high yield] with a very a high coupon, but if people in that tranche started defaulting on their mortgages, then that bond would become worthless.

“Whereas a triple-A [low risk – low yield] bond puts you right at the top of the tree and you’d need to have major ruptures in the marketplace to lose your coupon.”

As such, returns on RMBS will vary depending on both the size of the issuance and the tranche you buy into. For example, Firstmac recently completed a $500m sale of RMBS, which produced about a 3.35% return in its AAA tranche, over a weighted average life of around 3-4 years.

Meanwhile, Firstmac’s High Livez RMBS fund, which is a retail fund available to regular investors, holds RMBS from big banks such as Commonwealth Bank and Westpac and has achieved a total return of 6.66% per year since inception in 2011, according to Firstmac. It’s worth noting that RMBS yields can be impacted by general market appetite, interest rate levels and the cost of insurance that’s put in place by the issuing company, among other things.

Who’s investing?

Given that many lenders use RMBS, investors in them can span a number of groups, including super funds, insurance companies, high net wealth investors and the government. The Big Short touched on several of these investors, including government sponsored mortgage company, Fannie Mae.

In Australia, the government’s support of the RMBS market is equally important. According to Austin, RMBS were funding $50-60 billion worth of Australian home loans per year before the GFC, which equated to about 20-25% of all home loans. This was almost completely erased by the financial crisis however, and that’s when the Australian Government stepped in with a $20 billion programme to support RMBS.

Ratings agency Standard & Poor’s says that RMBS now represent around 10% of housing credit funding locally and has been trending upward since 2009.

Risky business

Many local experts don’t see securities markets of other countries as all that comparable to Australia because of our regulatory framework, which is crucially supported by lender’s mortgage insurance on loans issued for more than 80% of the purchase price. This helps to maintain a lower level of mortgage arrears and historically low numbers of defaults.

S&P says that Australian regulators focus on prudent lending standards and this also provides an important safeguard to the local market. There are other factors that make RMBS favourable to local investors, such as Australia’s strong migration levels, which underpin the constant demand for housing, and an ongoing shift away from other financial sectors like mining, says S&P.

At the same time, Australian borrowers must pass strict credit checks by lenders and show other assets in their name, whereas some US home loans are non-recourse, meaning that the only security for RMBS investors in those instances are the properties themselves. When homes plummeted in value during the GFC, many borrowers just walked away.

“In Australia you can’t walk away,” says Austin. “They [authorities] will still come after your other assets or garnish your wages. Australians pay their mortgages, as a result.”

Additionally, Australian loans are only serviced by the lender and are not passed onto other parties, the way they typically are in the US.

Where are RMBS now?

North says that up until the GFC there was momentum in securitised mortgages in Australia, but that since 2008 issuances have been relatively modest.

Still, at the end of 2015 S&P reported a significant upswing in the issuance of RMBS over the last two years, due to a variety of factors that include increased domestic and offshore investor interest. Overall, more than $20bn worth of RMBS were issued in Australia last year, as per S&P.

By contrast, this year hasn’t started as strongly, with around $5bn issued as of April 30, S&P reports. Managing director and lead analytical manager at S&P, Kate Thomson says that global uncertainty in response to China’s slowdown, as well as the Brexit referendum in the UK, APRA’s proposals for APS 120 and Basel regulations, Transparent and Standardised (“STS”) Securitisations in Europe, and amendments to the EU Capital Requirements Regulation have all impacted RMBS growth lately.

Nonetheless, there are still major players in Australia, including Commonwealth Bank and Macquarie Bank, which are the top two RMBS issuers over the 12 month to March 31, S&P says. Other notable issuers include Westpac, ING and Citigroup, and smaller firms like Pepper Home Loans, Firstmac, Heritage Bank and Liberty Bank.

So there’s still a range of opportunities in RMBS for different investors and while it may not be as prominent a vehicle as it once was, the concept is still interesting, says North.

“It [RMBS] manages capital differently, turning cash flow into capital,” he says. “And so if the market ever freed up, it could reassert itself.”

UK Loses AAA Rating – S&P

Rating agency Standard & Poor’s (S&P), the only agency which had previously given the UK a AAA rating, just revised it down. S&P said the the referendum result could lead to “a deterioration of the UK’s economic performance, including its large financial services sector”. They say Brexit will “weaken the predictability, stability, and effectiveness of policy making in the UK”. This follows downgrades from Fitch – from AA+ to AA – forecasting an “abrupt slowdown” in growth in the short-term and Moody’s last Friday cut the UK’s credit rating outlook to negative.

A ratings drop is likely to raise the cost of Government debt on the international markets. Here is the pound US$ chart, which fell further on Monday to a 31 year low.

http://930e888ea91284a71b0e-62c980cafddf9881bf167fdfb702406c.r96.cf1.rackcdn.com/data/tvc_9569275ca51286caf41f1b6b751c34a6.png


Brexit increases ‘stagflation’ risk: Pimco

InvestorDaily reports that the decision by UK voters to leave the European Union has increased the likelihood of a low-inflation/stagnation (‘stagflation’) scenario over the medium term, says Pimco.

In a note to investors titled From Brexit to Stagflation, Pimco global economic adviser Joachim Fels said investors face a “higher chance of stagflationary outcomes” over the next three to five years.

“This would likely come to pass if current or future governments turn more protectionist by erecting barriers to trade and migration, and take up or intensify the battle against inequality by redistributing income from capital to labour,” he said.

The UK’s decision to leave the European Union last week has already had severe consequences for both UK and global markets, with the pound reaching a 30-year record low.

The ASX lost 3.2 per cent on Friday as news of the referendum outcome was known, and AMP Capital’s head of fundamental equities Michael Price noted that the financial and resources sectors were being hit hardest.

Mr Price added that whether investors treat Australia as a safe-haven or a vulnerable economy is yet to be seen, with lower growth and bond yields likely to result in resurgent yield trading.

“The Australian market has rallied for three years without earnings growth and could be considered expensive and vulnerable to a loss of global confidence,” he said.

In the UK, according to JP Morgan, growth will continue to slow down, with a reduction in annualised pace from 1.6 per cent to 0.6 per cent in the second half of 2016.

JP Morgan chief market strategist for the UK, Stephanie Flanders, said inflation is likely to jump to 3.0 or 4.0 per cent by the end of 2017, a significant increase on previous forecasts of 1.7 per cent.

US Households Now Less Likely to Say Using Credit Is OK

Interesting observations about household credit from the US Federal Reserve. In general, fewer households are responding that it is a good idea to buy things on credit. The share with positive answers decreased from 32.4 percent in 2004 to 29.7 percent in 2007 to 25.2 percent in 2013. A similar pattern is observed for answers about vacation, coat/jewelry, car and educational expense categories. The only category with an increase in the share with positive answers is “living expenses.”

Overall, the results suggest that households’ attitude toward credit has changed, signaling a reduction in credit demand. This is an important topic for further research, because the policy recommendations are very different if the reduction in household credit was caused by a reduction in the availability of credit (credit supply) or by households’ attitude toward credit.

In previous articles, we saw that household debt has been declining and why debt has dropped since the financial crisis. Total household debt, which peaked in 2009, stabilized at 13 percent below the previous peak in the first quarter of 2013. One of the most relevant questions regarding this trend is: Was it caused by supply or demand factors?

While credit supply factors capture the behavior of lenders (banks and other financial institutions), credit demand factors represent the willingness of households to borrow. In this blog post, we present data on households’ attitude toward credit to evaluate potential changes in credit demand.

We used data from the Survey of Consumer Finances (SCF). This survey asks households questions on credit attitudes. In particular, households are asked if they think it is generally a good or bad idea for people to buy things by borrowing or on credit. The survey also asked specifically about borrowing money:

  • To cover the expenses of a vacation trip
  • To cover living expenses when income is cut
  • To finance the purchase of a fur coat or jewelry
  • To finance the purchase of a car
  • To finance educational expenses

The figure below shows the percentage of individuals who answered that it is generally a good idea to buy things on credit.

BuyonCredit


ACCC Warns SME’s of Australian Business Funding Centre “Government grants” website

The Australian Competition and Consumer Commission has issued a Public Warning Notice about the conduct of Australian Business Funding Centre Pty Ltd (also known as Australian Business Financing Centre or ABFC) which operates the website www.australiangovernmentgrants.org.

The ACCC alleges that ABFC website, and its sales representatives, purport to offer access to an online database of the Australian government grants and loans available to small businesses. Small business owners paid fees ranging from $497 to $701 to access the database, only to find there were no suitable grants or that they were ineligible for grants listed.

The Public Warning Notice alleges ABFC has made false or misleading representations about the service’s capability and quality, and the role the service has played in assisting small businesses gain government grant funding.

The website also prominently features a range of “success stories” from actual Australian small businesses, but when those businesses were contacted by the ACCC, they said the stories were used without their permission and that they had not obtained any government funding via ABFC.

“The ACCC is issuing a warning in relation to ABFC’s conduct including its australiangovernmentgrants.org website. We are very concerned that small businesses are paying ABFC for a service that does not provide the information and assistance they are have paid for,” ACCC Acting Chair Dr Michael Schaper said.

“Similar websites targeting small businesses in other countries have also come to the attention of regulatory authorities in New Zealand and Canada.”

“Small businesses should take care when assessing offers to assist them in obtaining government grants. The bottom line is that information relating to government grants is generally available free of charge from a variety of state and federal resources online,” Dr Schaper said.

The ACCC says despite the australiangovernmentgrants.org including an Australian address, it is operated by ABFC’s sole director who is based overseas.

Legitimate information about government grants can be obtained for free at www.business.gov.au and other websites ending with .gov.au.

The Public Warning notice is available here: Australian Business Funding Centre Pty Ltd (also known as Australian Business Finance Centre or ABFC)