Inflation subdued in the June quarter 2016

The Consumer Price Index (CPI) rose 0.4 per cent in the June quarter 2016, according to the latest Australian Bureau of Statistics (ABS) figures.

The RBA will probably take this as a signal to cut the cash rate again next week, despite the fact that evidence is mounting that rate cutting at these low interest rate levels will not help much, and create a problem down the track. In fact we should ask if a 2-3% target for inflation is meaningful anymore. Worth reading Mark Carney, Governor, Bank of England comments on this subject. Low inflation appears to carry significant risks, and low interest rates do not help.

CPI-2016-JunThis follows a fall of 0.2 per cent in the March quarter 2016.

The most significant price rises this quarter are in medical and hospital services (+4.2 per cent), automotive fuel (+5.9 per cent) and tobacco (+2.1 per cent). These rises are partially offset by falls in domestic holiday travel and accommodation (–3.7 per cent), motor vehicles (–1.3 per cent) and telecommunication equipment and services (–1.5 per cent).

The increase of 4.2 per cent for medical and hospital services was driven by the annual increase in Private Health Insurance (PHI) premiums, which rise on 1 April every year.

The increase of 5.9 per cent for automotive fuel follows three consecutive quarterly falls, with the rise driven by increases in unleaded, premium and ethanol fuels, as world oil prices increased from a 12-year low last quarter.

The CPI rose 1.0 per cent through the year to the June quarter 2016. This is the weakest annual rise since the June quarter 1999.

There are interesting state variations, with Brisbane recording 1.5 per cent, and Darwin 0 per cent this time.

June-2106-State-CPI


More scrutiny needed on commissions paid to life insurance advisers

From The Conversation.

The proposed changes to commissions for selling life insurance may just tip the system back in favour of the customer. For years paying life insurance advisers by commission was not seen as a conflict of interest, even when it incentivised bad advice and continuous changing of policies.

Life-Insurance-graphicThe changes will reduce the incentives for upfront commissions and allow better monitoring of the cost of the policy relative to the commission, however there is still no legislative cap on total commissions payable.

Problems with the current system

Life insurance covers death, illness, injury and disability. The consumer pays the insurer for their policy and then the insurer pays the adviser who gets a proportion of the premium as a commission.

Up-front commissions can be up to 130% of the first year’s premium followed by 10% of subsequent premiums. “Hybrid” commissions (which sit between upfront and “level” commissions) usually amount to 80% of the first year premium and 20% of subsequent premiums. Level commissions are about 30% of each year’s premium.

The upfront commission is an incentive for advisers to switch clients from one life insurance policy to another in order to keep collecting the high commission. They may churn clients from a suitable life insurance policy, to one that may let them down when they most need it.

Sometimes the policy life insurers recommend is not in the best interests of the client. Some advisers act outside the law.

ASIC has found a high correlation between high commissions and lapsed life insurance policies.

People are holding the same life insurance policy for fewer years and ASIC also found more than a third of life insurance advice didn’t comply with the law ensuring its quality.

Advocates arguethat commissions are about preserving the value of the business, not guarding against under-insurance and the risk to the client.

There are rules to protect consumers from conflicts of interest and conflicted remuneration. However the life insurance industry was successful in securing exemptions from the conflicted remuneration rules in the Future of Financial Advice reforms.

The exception to the exemption from the ban, is a group life policy for a superannuation fund or an individual policy for a member of a default superannuation fund.

How the government plans to fix this

At the time of these reforms the parliament recommended monitoring life insurance and subsequent ASIC studies identified problems. This led to an industry commissioned report.pdf) which put forward concrete measures to minimise conflicts of interest such as a fee for service model and competitive approved product lists.

The (Murray) Financial System Inquiry recommended level commissions, that is, the same commissions on each year’s premium, arguing that the upfront style commission should not be greater than an ongoing commission. In its response to the Murray Inquiry, the Government said it would address this by the end of 2015.

The current bill, which was before parliament prior to the election, removes the exemption of life insurance commissions from the definition of conflicted remuneration, effectively banning these commissions. But it then reinstates these commissions in two circumstances.

Commissions can be paid if the benefit and the cost of the policy is the same for each year, that is, level. It changes the timing of the commission, putting a cap on upfront commissions and evening out payments over the life of the product.

In another circumstance, if the first year plus subsequent years commissions are less than an ASIC determined fair ratio between the commission and the cost of the policy, more commissions can be paid. In fact there is an obligation to repay it if the policy is cancelled or if the cost of the policy is reduced.

The claw back applies only if the insurer gives the adviser an upfront commission. It’s designed to prevent the incentive for switching or churning through policies.

ASIC will have the power to determine an acceptable fair ratio and extra commission, effectively setting the allowed amount of commissions.

The Trowbridge Report.pdf) proposed an initial capped payment for advice that could be paid, only once every five years, plus level commissions capped at 20% of premiums.

There is ongoing debate about fee for service payment for product advice and whether consumers are prepared to pay. The problem is how much does it really cost to prepare advice and how much is it really worth?

The proposed bill gives the life insurance industry further time to reform itself. However the industry has been on notice from at least 2012 that it needs to change and the question is whether it has now been given too much time.

The ASIC review in 2018 could recommend banning all life insurance commissions.

Author: Gail Pearson, Professor, Business School, University of Sydney

Small business concerns continue to rise – ACCC

The ACCC says small business enquiries and complaints to the national competition agency continue to grow, topping more than 7,600 contacts in the first half of 2016.

Small-Biz-Graphic1

“We’re continuing to see an increasing number of contacts from the Australian SME sector. These contacts have been particularly concerned about misleading conduct by other firms, consumer guarantees, and agricultural issues,” ACCC Deputy Chairman Dr Michael Schaper said.

The ACCC’s six-monthly Small Business In Focus report #12 has been released today, providing an update on key developments in the small business, franchising, and agriculture sectors.

For the first time, information on the agriculture sector has been included. The ACCC received more than 200 agriculture-related enquiries and complaints, principally focussed on potential misleading conduct or false representations made by other business operators.

Other key developments in the last six months are also highlighted in the report:

  • there have been more than half a million visits to the ACCC’s business web pages;
  • the ACCC continues to receive reports of losses to scams targeting small businesses, with $1.6m lost;
  • new rules for country of origin labelling have commenced (Country of origin food labelling laws);
  • Coles, Woolworths, and Aldi are now required to comply with the entire Food and Grocery Code
  • there were more than12,000 users of the ACCC’s online education programs.

“The number of small businesses contacting the ACCC with concerns has risen steadily over the past few years. The current review of the Australian Consumer Law (ACL) provides a valuable opportunity for small business to speak up and ensure that their concerns are taken into account during that process,” Dr Schaper said.

“Concerns about changes to new credit card surcharging laws in September, and new changes to the ACL that will extend protections from unfair contract terms in business-to-business dealings in November are expected to generate significant interest from the Small Business community.”

The ACCC has prepared advice for small business on the new credit card surcharging laws (Excessive payment surcharges) and new Unfair Contract Term protections (Business-to-business unfair contract terms).

Small Business in Focus is available at: Small business in focus – 1 January 2016 to 30 June 2016

Fintechs can help incumbents, not just disrupt them

Interesting piece from McKinsey showing that the structure of the fintech industry is changing and that a new spirit of cooperation between fintechs and incumbents is developing. For example, in corporate and investment banking, less than 12 percent are truly trying to disrupt existing business models.

Fintechs,  the name given to start-ups and more-established companies using technology to make financial services more effective and efficient, have lit up the global banking landscape over the past three to four years. But whereas much market and media commentary has emphasized the threat to established banking models, the opportunities for incumbent organizations to develop new partnerships aimed at better cost control, capital allocation, and customer acquisition are growing.

We estimate that a substantial majority—almost three-fourths—of fintechs focus on retail banking, lending, wealth management, and payment systems for small and medium-size enterprises (SMEs). In many of these areas, start-ups have sought to target the end customer directly, bypassing traditional banks and deepening an impression that they are disrupting a sector ripe for innovation.

However, our most recent analysis suggests that the structure of the fintech industry is changing and that a new spirit of cooperation between fintechs and incumbents is developing. We examined more than 3,000 companies in the McKinsey Panorama FinTech database and found that the share of fintechs with B2B offerings has increased, from 34 percent of those launched in 2011 to 47 percent of last year’s start-ups. (These companies may maintain B2C products as well.) B2B fintechs partner with, and provide services to, established banks that continue to own the relationship with the end customer.

Corporate and investment banking is different. The trend toward B2B is most pronounced in corporate and investment banking (CIB), which accounts for 15 percent of all fintech activity across markets. According to our data, as many as two-thirds of CIB fintechs are providing B2B products and services. Only 21 percent are seeking to disintermediate the client relationship, for example, by offering treasury services to corporate-banking clients. And less than 12 percent are truly trying to disrupt existing business models, with sophisticated systems based on blockchain (encrypted) transactions technology, for instance.

Mck-Fintech-Jul-16Assets and relationships matter. It’s not surprising that in CIB the nature of the interactions between banks and fintechs should be more cooperative than competitive. This segment of the banking industry, after all, is heavily regulated.1 Clients typically are sophisticated and demanding, while the businesses are either relationship and trust based (as is the case in M&A, debt, or equity investment banking), capital intensive (for example, in fixed-income trading), or require highly specialized knowledge (demanded in areas such as structured finance or complex derivatives). Lacking these high-level skills and assets, it’s little wonder that most fintechs focus on the retail and SME segments, while those that choose corporate and investment banking enter into partnerships that provide specific solutions with long-standing giants in the sector that own the technology infrastructure and client relationships.

These CIB enablers, as we call them, dedicated to improving one or more elements of the banking value chain, have also been capturing most of the funding. In fact, they accounted for 69 percent of all capital raised by CIB-focused fintechs over the past decade.

Staying ahead. None of this means that CIB players can let their guard down. New areas of fintech innovation are emerging, such as multidealer platforms that target sell-side businesses with lower fees. Fintechs also are making incursions into custody and settlement services and transaction banking. Acting as aggregators, these types of start-ups focus on providing simplicity and transparency to end customers, similar to the way price-comparison sites work in online retail. Incumbent banks could partner with these players, but the nature of the offerings of such start-ups would likely lead to lower margins and revenues.

In general, wholesale banks that are willing to adapt can capture a range of new benefits. Fintech innovations can help them in many aspects of their operations, from improved costs and better capital allocation to greater revenue generation. And while the threat to their business models remains real, the core strategic challenge is to choose the right fintech partners. There is a bewildering number of players, and cooperating can be complex (and costly) as CIB players test new concepts and match their in-house technical capabilities with the solutions offered by external providers. Successful incumbents will need to consider many options, including acquisitions, simple partnerships, and more-formal joint ventures.

Let’s talk about the family home … and its exemption from the pension means test

From The Conversation.

Late last year a Productivity Commission report found including the family home in the means test for the age pension could deliver the government A$6 billion in much-needed revenue.

Despite this, in the lead-up to the federal election, both major parties shied away from reform. Neither was willing to consider rolling back preferential treatment of the family home. This includes capital gains tax exemptions, first home owner grants and the family home’s exemption from the pension means test.

Generic-Houses-9Home ownership is an important source of emotional security, which offers a strong rationale for exempting the family home from the pension means test. But as the population ages and the government’s fiscal problems grow, there’s increasing policy interest in tapping into older people’s accumulated housing wealth to support retirement.

The case for means-testing the family home

Exempting owner-occupied housing from capital gains tax can have adverse equity and efficiency impacts. The family home exemption results in the payment of income support to those with substantial wealth tied up in their principal residence. Public funds are not therefore targeted at those in most need.

The exemption of housing assets in means tests advantages pensioners with most of their wealth stored in the family home relative to those with the same wealth holdings, but spread across a more diversified portfolio. Policymakers describe this as being “horizontally inequitable” – where people of similar origin and intelligence do not have equal access to wealth.

The current system also causes inefficiencies in housing markets. It encourages “empty nester” older households to live in houses that are large relative to their household size. For income-poor older Australians, this can have perverse consequences. Equity released from downsizing could generate income to help meet acute spending needs in old age.

At the same time, wealth portfolios dominated by housing leave owners over-exposed to house price risks that they cannot hedge. Means-testing the family home would cause future homebuyers to scale back their housing investments. As a result, they would be more likely to hold more balanced wealth portfolios.

The case against means-testing the family home

The problem is, older Australians choosing to downsize or access some sort of equity-release product face tax penalties under the current system.

The net proceeds on downsizing are an assessible asset that can reduce income-support payments, while stamp duty eats into the proceeds. And a lack of suitable housing options frustrates many would-be down-sizers who want to stay living in their local communities. Equity-release products also expose owners to investment and credit risks because interest rates are variable and house prices can fall.

Encouraging people to tap the value in their home instead of accessing welfare payments requires stable housing asset values and continuing high rates of home ownership. However, there is already clear evidence of declining rates of home ownership and increasing indebtedness. These trends are not restricted to young Australians; they are also evident among those approaching retirement.

And if in future we witness the sharp declines in house prices that many countries suffered during the global financial crisis, housing equity will prove to be an unreliable asset base for welfare needs.

Is there a pathway to reform?

The challenges facing older Australians who downsize or access home-equity products can be mitigated by the introduction of financial instruments or government-backed schemes that allow owners to hedge house price risks. Stamp-duty exemptions could reduce the financial costs of downsizing.

It also needs to be recognised that current pensioners made their home purchase and investment decisions on the basis of tax-transfer rules that were expected to remain in place. In light of this, grandfathering provisions would need to be part of any reform package. This would enable transitional arrangements, preventing major disruption in housing markets and the lives of current pensioners.

It is important to note if budget savings are the main motivation, the government should look at reforming housing tax concessions. These concessions are largely received by higher-income older home owners. Curbing these concessions would be a more equitable way of achieving budget savings while also improving the resilience and efficiency of housing markets.

Authors: Rachel On,Deputy Director, Bankwest Curtin Economics Centre, Curtin University;  Gavin Wood. Professor of Housing, RMIT University.


More Ultra Low-Rate Mortgage Offers

ING DIRECT has introduced its lowest ever variable rate of 3.79% p.a. on its Orange Advantage loan for owner occupiers.  This new rate is a reduction of 0.15% p.a. off the current rate and is effective from Monday 25 July for Orange Advantage formal approvals with a minimum LVR of 80%.

The bank is also introducing changes across its range of fixed rate residential owner occupier loans, with a rate of 3.69% p.a. available for a three-year fixed term when taken as part of a split package with an Orange Advantage loan.

Further evidence momentum enabled by the shape of the yield curve, which we discussed recently.

Yield-Curve-June-2016

Auction Action Shows Market Distortions

CoreLogic’s data on auction clearances shows that markets remain firm with the combined capitals preliminary clearance rate remaining higher than 70 per cent for the third week running.

This week 1,295 auctions were held across the capital cities, with 1,076 reported results so far.  The preliminary clearance rate of 70.7 per cent is roughly the same when compared with last week’s result which showed 70.5 per cent of the 1,391 capital city auctions cleared.  Melbourne and Sydney are once again showing the strongest clearance rates of 72.4 per cent and 75.3 per cent respectively.  In terms of auction volumes, both Sydney and Melbourne recorded a lower number of auctions this week when compared to last week, while across the remaining capital cities the auction markets were varied.   At the same time last year, the number of auctions held was still substantially higher (2,143) with a success rate of 74.7 per cent.20160725 capital city

A total of 2 auctions have so far been reported with 1 successful result for Tasmania. Across Perth, there were 21 auctions held this week with a preliminary clearance rate of 42.9 per cent. There were 68 auctions in Adelaide and a preliminary clearance rate of 71.8 per cent, whilst in Brisbane there was 135 auctions with a preliminary clearance rate was 53.2 per cent.

New Zealand Banks Will Benefit from Tighter Rules on High-LTV Mortgage Loans – Moody’s

According to Moody’s, New Zealand banks will benefit from tighter rules on high-LTV mortgage loans.It is also worth noting how the market responded to earlier less aggressive macroprudential measures.

On 19 July, the Reserve Bank of New Zealand (RBNZ) released a consultation paper outlining a proposal to limit bank lending to home investors at loan-to-value ratios (LTVs) above 60% to 5% of new originations and lending to owner-occupiers at LTVs above 80% to 10% of new lending. These restrictions are credit positive for New Zealand banks and their covered bond programs because they reduce their exposures to higher-risk lending at a time when house prices are at historic highs.

The proposal will be particularly beneficial to New Zealand’s four major banks, ANZ Bank New Zealand Limited, ASB Bank Limited, Bank of New Zealand and Westpac New Zealand Limited. These four banks hold approximately 86% of all New Zealand residential loans.

The tighter restrictions on LTV limits will benefit banks and their cover pools by providing a buffer against declining house prices before the size of the loan exceeds the value of the property. In the longer run, banks will have fewer high LTV loans to sell into their cover pools, which will strengthen the pools’ credit quality.

The new rules would replace existing limits that restrict new lending to investors in Auckland at LTVs greater than 70% to 5%, lending to owner-occupiers in Auckland at LTVs above 80% to 10%, and all other housing lending outside of Auckland at LTVs above 80% to 15%. The proposal is in response to the boom in New Zealand house prices, which are at historical highs, creating a sensitivity to a sharp reversal in home prices.

Moody-NZ1Although LTV restrictions protect banks against a sharp correction in house prices, it remains to be seen how effective these measures will be in moderating house price appreciation if interest rates decline further. In March 2016, the Reserve Bank of New Zealand reduced its policy rate by 25 basis points to 2.25%, the fifth reduction since June 2015, while also stating that further policy easing may be required. Furthermore, strong immigration and supply shortages continue to support house prices, particularly in Auckland.

The first of New Zealand’s macro-prudential measures, introduced in October 2013, had a sharp but temporary effect on house price growth. Further measures were introduced in 2015 that also immediately reduced house price growth in fourth quarter of 2015. However, prices rebounded and have appreciated in 2016.

Moody-NZ2 The Reserve Bank of New Zealand is inviting market feedback on its proposal until 10 August, after which, a final policy will be released to take effect from 1 September 2016.

WA and Qld slip further in economic rankings

The latest State of the States report from CommSec shows that Queensland and Western Australia have each fallen one place on the list to sixth and seventh respectively, while South Australia jumped them both to be fifth. But in two years Western Australia has gone from first to seventh in the performance rankings.

NSW has retained its top rankings on population growth, equipment investment, retail trade, and dwelling starts and added economic growth. But NSW drifted to second spot on unemployment. NSW improved to third ranked on construction work and drifted to third on housing finance (previously second).

Victoria is solidly in second spot on the economic performance rankings. Victoria is ranked second on a number of indicators (economic growth, population growth, retail trade, business investment, construction work and housing finance). Victoria has moved from second ranked to fourth ranked on unemployment.

Both states are maintaining a healthy lead over the other states and territories.

CommSec-July-2016The Northern Territory holds fourth position and remains in top spot for construction work done and is also now best on unemployment. However the Territory economy is losing momentum, ranked last on population growth, business investment and housing finance, while sixth ranked on retail trade.

The South Australian economy is now fifth-ranked (previously sixth) and improved in the quarter. South Australia is middle ranked on population growth and housing finance and fifth ranked on economic growth. It remains last on retail trade.

Queensland shifts from fifth to sixth spot on the economic performance rankings. While second-ranked on dwelling starts, it is bottom-ranked on construction work and seventh-ranked on economic growth and unemployment.

Western Australia is now seventh and near the bottom of the Australian economic performance table. In two years the mining state has gone from first to seventh. WA is third on retail trade and is middle-ranked on construction work. But WA struggles on unemployment (last) and is ranked seventh on business investment, population growth, and housing finance.

Tasmania is in eighth position. The “Apple Isle” is fifth ranked on four indicators but is last on dwelling starts and economic growth.

There is little to separate the bottom three ranked economies.

Wealth inequality shows superannuation changes are overdue

From The Conversation.

The government is still consulting on superannuation after concerns raised by backbenchers over changes made in the budget. However these changes are more important than ever, as evidenced by the 2016 HILDA statistics on wealth and superannuation.

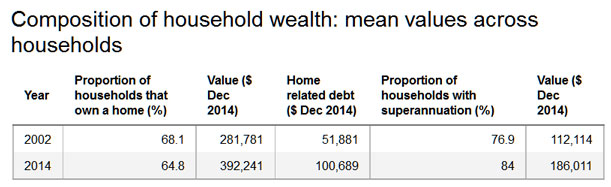
The statistics highlighted changes in the distribution of wealth of Australians since the survey commenced in 2001. The most significant assets held by most Australians continue to be their family residence and superannuation, but policy changes over the time of decade the survey have changed the balance of those investments.

More concerning is the finding that wealth inequality has increased. The data adds strength to the argument that superannuation reforms are overdue, with a small number of wealthy people able to accumulate wealth in superannuation and investment property.

In Chapter 5 of the report, which discusses household wealth, the authors note that superannuation will soon overtake the family home as the major asset owned by Australians. This is the result of two separate trends: increases in superannuation balances and lower net wealth in housing.

HILDA-COnv1Looking at the HILDA data, it’s not unexpected to see that younger age cohorts have experienced the strongest growth in superannuation assets.

Prior to 1993 superannuation was very different to the current system. According to Treasury data in 1986 53.5% of Australian full time employees did not have superannuation coverage, and over 80% of those who did, were members of a defined benefit scheme, which would not generally be reported as an asset. By 2000, 96.9% of full time employees had superannuation coverage, with 86% of those employees in accumulation type funds.

The superannuation guarantee has been a significant contributing factor in the importance of superannuation as a household asset. Notably, the phasing in of the rate of the superannuation guarantee shows in account balances. As can be seen from the HILDA report the increased rate of superannuation guarantee after 2002 has resulted in higher superannuation balances for people at the same age in successive surveys.

The increase in housing values is the second trend which has altered the mix of assets. Over this time residential house prices rose significantly, with ABS data showing an increase in the Residential Property Price Index across eight capital cities from 69.0 in September 2003 to 120.2 in Dec 2014.

Given that in the 2002 data the major asset of Australians was the family home, homeowners benefited disproportionately from the increased value of housing. Even with the significant increases in superannuation, for older Australians the proportion of wealth held in housing has been maintained as their total wealth has increased.

However for younger age groups the story is not as positive. The rate of home ownership is declining as it is becoming more difficult to enter the housing market and home equity is declining among younger age groups as the value of loans has increased.

The HILDA data shows that most age cohorts, including all except the oldest retirees, have seen increases in their superannuation accounts over time. Policy changes effective from 2007 have supported superannuants through tax exemptions and high contribution levels.

Another trend contibuting to this is that people are retiring later. The change in the pension age to 67 has been accompanied by a trend for people to work longer. Not only are they deferring withdrawals from their superannuation fund, but they are also continuing to contribute during this time.

As noted in the Productivity Commission report last year there is some evidence of withdrawals at the time of retirement, but these are generally used to pay outstanding debts, including mortgages against the family home.

Others convert their superannuation at retirement into other financial investments. This cements the family home as the most significant asset held by retirees.

The more concerning finding for policy makers is that wealth inequality has increased, and that superannuation holdings and investment properties are factors in this inequality. HILDA data shows that in 2014 the mean superannuation balance of the top 10% of people aged 50 to 69 was $991,268, up from $650,619 in 2002, compared to $210,798 in 2014 for the sixth to ninth decile and $13,719 for the bottom 50% (although a significant number of retirees in this age group do not have any superannuation balance).

There is a strong correlation between high superannuation balances, income and non-superannuation wealth. People in the top decile have access to higher levels of income to make higher levels of concessional contributions, and the ability to find the funds to make non-concessional contributions into a tax preferred investment environment.

As has been noted previously, the current superannuation system allows high income and high wealth individuals to over-accumulate in tax preferred superannuation, which increases wealth inequality as well as intergenerational inequality.

The Government proposals to restrict the level of contributions and to reduce the amount that can be retained in a tax free environment are important tools to address increasing levels of wealth inequality in our community.
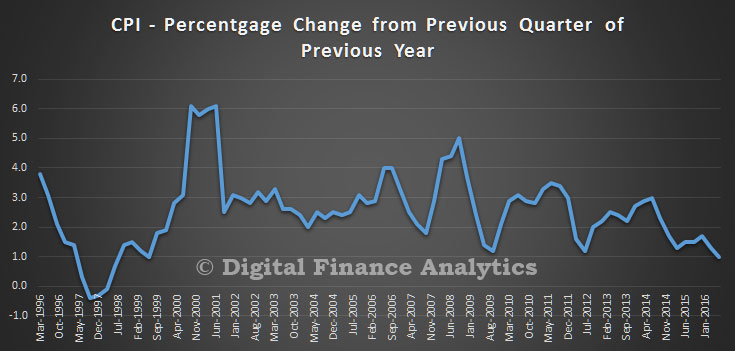
Author: Helen Hodgson, Associate Professor, Curtin Law School and Curtin Business School, Curtin University