ANZ Offers Mobile-Pay Services To Mastercard Customers

ANZ today announced its Mastercard customers can now use their smartphone to make tap and go payments with Android Pay or Apple Pay.

MobilePayFrom today, more than 500,000 ANZ customers with a Mastercard credit card can use contactless payments.

Mastercard was the first in the world to offer contactless payments, and Australians are fast adopters with more than seven out of ten Mastercard transactions now made using contactless technology at over 750,000 terminals across Australia. Consumers are now able to enjoy safe and convenient payments from their devices in store, within apps and soon on the web.

ANZ uses tokenisation security to protect card numbers by never sharing them with the merchant or saving them on the device.

The announcement comes after ANZ became the first major Australian bank to offer Android Pay to customers in July this year and after ANZ this year became the first major Australian bank to offer Apple Pay to customers. ANZ remains the only major Australian bank to offer these services.

Will The Banking Revolution Will Kill Off Credit Cards and Internet Banking?

In the first episode of a three-part series on the future of fintech, Baker & McKenzie explores the vast number of fintech ventures that are innovating at a fast pace, often unencumbered by stringent banking regulations.

Appearing in Episode 1 of Baker & McKenzie’s The future of fintech video series, Rubik chief executive Iain Dunstan said that 60 cents in every dollar is now transacted on a phone or tablet.

“It wasn’t that long ago that phone banking was new. And that died when internet banking came along,” Mr Dunstan said.

Smartphones are likely to have the same effect on internet banking, he said – because that is the way that Generations X and Y want to transact, he said.

“Internet banking now is generally only done between 7pm and 10pm at night. Hardly at all during the day,” Mr Dunstan said.

Just as cheques have disappeared, so too will credit cards – and their demise will be much faster, he predicted.

Baker & McKenzie partner Astrid Raetze said many of the smaller fintech players will get “knocked out” over the next five years, leaving only the companies that provide a quality mobile customer experience.

“The ones who are going to be successful are going to be the ones who are marrying the perfect customer-tailored online experience with the excellent technology that achieves the customer’s purpose,” Ms Raetze said.

“It wouldn’t surprise me if in five years’ time you don’t have a wallet at all and instead everything’s on your mobile phone,” she said.

In the future, the big players in the fintech space could well be some of the major technology companies, said Ms Raetze.

“There are a lot of players who are afraid that if the technology companies get serious in this space, lots of customers are going to move to them because they already trust their relationship with Apple, with Amazon – it’s a good experience that they keep coming back for,” she said.

From FintechBusiness.

Auctions Up and Hot, Again

CoreLogic’s latest auction data shows there were 2,113 auctions held across Australia’s capital cities this week, a rise from last week, (1,795) yet lower than the 2,654 auctions held at the same time last year. This aligns with APM’s data we discussed on Saturday.

It is expected that auction activity will begin to pick up as we head into the spring selling season. The preliminary auction clearance rate was 76.6 per cent this week, higher than last week’s result of 75.2 per cent and representing another year to date high for the combined capitals. One year ago, the final auction clearance rate was recorded at 73.4 per cent, lower than what is currently being observed. Over winter 2016, clearance rates has ranged from a low of 65.7 per cent to a high of 76.6 per cent, compared to last winter where the weekly clearance rate remained above 70 per cent each week for the entire winter season, peaking at 78.5 per cent at the start of June.

20160829 capital city

Will New Home Sales take a new year dip?

The Housing Industry Association (HIA) New Home Sales Report to July 2016, which is based on a survey of Australia’s largest volume builders, suggests new commencements in 2016/17 will slow significantly.

HIA-New-Home-July-2016“The short term outlook for healthy levels of new home construction remains intact – calendar year 2016 will be a record year for new dwelling commencements, but the situation could look very different from next year,” commented HIA Chief Economist, Dr Harley Dale.

“The monthly HIA survey of Australia’s largest volume builders reveals that total seasonally adjusted new home sales fell by 9.7 per cent in July 2016 following an increase of 8.2 per cent in June. The overall trend decline in new home sales is accelerating, signalling a relatively sharp drop (from a record high) in new dwelling commencements from 2017.”

“New home construction has been the kingmaker of the Australia economy, but the cycle has peaked,” noted Harley Dale.

“In all likelihood we will experience sharper falls in new home construction in both 2017 and 2018. The magnitude of decline in new home construction in coming years will of course be exaggerated by where we are coming from – record levels of medium/high density construction and historically healthy levels of detached/semi-detached dwelling construction.”

“There will no doubt be a tendency to sensationalise any negative results for new housing as the trajectory of the down cycle unfolds. We would do well to remember that this down cycle is following a record high that is some 24 per cent higher than the previous (1994) peak and that there is an unprecedented degree of uncertainty this time around as to how the next few years of new home building unfold,” concluded Harley Dale.

In the month of July 2016 detached house sales fell in all five mainland states, after rising everywhere in June. Sales dropped by 12.6 per cent in South Australia and were down by 8.7 per cent in Queensland, 8.2 per cent in Western Australia, 6.2 per cent in NSW, and 6.0 per cent in Victoria.


The Top 10 Mortgage Stress Post Codes In The Melbourne Region

We continue our series on mortgage stress by looking at VIC, and with a focus on the Melbourne region. Using data from our surveys, 23.7% of households are currently in mortgage stress. This is above the national average of 21.3%. You can read about our methodology here. We assess individual household income and expenditure, and do not rely on a simplistic “35% of income rule of thumb” used by many others.

Here is the mapping around Melbourne, showing the relative count of households in stress.

Stress-VIC-Aug-2016Here is the list of the top 10 in the state. Berwick is a suburb 41 kilometres south-east of Melbourne’s central business district and has the highest count. Young growing families are the most strongly represented household segment, and they are under financial pressure thanks to costs of living, including child care. They have an average mortgage of $370,000, on relatively constrained incomes. The current median household income is $1,580 per week.

The next postcode, Essendon, is a suburb 10 km north-west of Melbourne’s central business district. Although a mixed community, young growing families are again under mortgage stress. Mortgages here, on average are larger, typically more than $600,000. the current median household income is $1,600 per week.

The third most stressed postcode is Narre Warren South, 40 km south-east of Melbourne’s central business district. This suburb has been expanding fast in the past decade, including many subdivisions. We classify households here as on the urban fringe and the average mortgage is $285,000.  The current median household income is $1,330 per week.

We have gone into some detail here to illustrate that mortgage stress is multi-faceted, and the characteristics of households in stress varies considerably across postcodes.

Stress-Aug-2016-VICNext time we look at Perth, and WA more broadly.


New Application Form Will Lead to Stronger Conforming Loan Originations

According to Moody’s Last Tuesday, US government-sponsored enterprises (GSEs) Fannie Mae and Freddie Mac released a new joint loan application for residential mortgage loans that requires additional information fields from borrowers and provides standardized definitions for various data fields.

Housing-Key

The new form takes effect on 1 January 2018. The additions to the form will increase the granularity and accuracy of the data that the GSEs collect, which will allow them to refine their automated underwriting models to better differentiate credit risk. This likely will lead to stronger loans originated using the GSEs’ automated underwriting systems and will be credit positive for future residential mortgage-backed securities (RMBS) backed by conforming loans.

The new application form provides the GSEs with more detailed information electronically and allows them to improve credit analysis by linking various borrower characteristics to loan performance. Additionally, standardized definitions of data fields will reduce the GSEs’ reliance on lenders to ensure that the data are correctly defined. The form also will help ensure accuracy in areas where borrowers were previously likely to make assumptions that were inconsistent with the GSEs’ definitions.

Examples of some significant new fields, and fields that now have standardized choices include the following:

  • Total gifts and grants: The new form requires borrowers to identify the source of gifts or grant funds and provides nine sources from which to choose, including a relative, unmarried partner, employer or federalagency. The previous form did not provide such categories and only asked prospective borrowers to identify the amount of gifts and grants.
  • Income type: The new form requires borrowers to itemize income under 20 specific sources, such as automobile allowance, foster care and royalty payments. The previous form only asked prospective borrowers to list types of income, without providing any categories.
  • Borrower assets: The new form provides 13 categories of assets from which to choose, such as checking, savings, bridge loan proceeds and mutual funds. The previous form had fewer categories.
  • Self-employment/business ownership: The new form asks borrowers if they are self-employed or business owners, defines upfront that the prospective borrower must own at least 25% of the business to qualify as a business owner, and asks whether the borrower is employed by a family member. The previous form lacked that kind of detail, merely asking prospective borrowers to check a box denoting whether or not they were self-employed.

Two million Aussies are experiencing high financial stress

From The Conversation.

A new study shows two million Australians are experiencing high financial stress which prevents them from coping in difficult situations, for example, in paying unexpected expenses such as a big mobile phone bill or the fridge breaking down.

Adults face these sorts of scenarios frequently. When they arise, people usually turn to savings, a credit card, or a friend or family member to help out.

Our report, Financial Resilience in Australia, funded by the National Australia Bank, quantifies the amount of Australians: experiencing problems paying debts; meeting the costs of living; and accessing appropriate, affordable and acceptable financial products and services.

It also shows some Australians have trouble accessing social support in times of crisis and may have low levels of financial knowledge.

Our research measured financial resilience by the four key resources that support it: personal economic resources (such as savings), financial products and services (such as insurance), financial knowledge and behaviour (including financial literacy), and social capital (having social support in times of crisis, including friends and families).

Many Australians simply don’t have the resources to bounce back. For example, around:

  • One in two adults have limited to no savings
  • One in two only have a “basic understanding” of financial products and services
  • One in ten have unmet need for credit and/or insurance
  • One in five have limited or no social connections
  • One in 30 stated they needed but did not have access to any form of government or community support.

This has implications for the short and long-term impact on individuals and their families.

Who is most at risk?

Our research found secure housing, steady income, education, being employed and good mental health are strongly associated with financial resilience.

On average, financial resilience is significantly lower among people who are homeless, living in social housing, are short-term renters or live in student accommodation.

Financial resilience increases with the level of education and, unsurprisingly, people with very low personal incomes fare poorly.

Employment status is a key marker. People who are unemployed, underemployed, not in the labour force and those who only work odd jobs are more likely than their full-time employed counterparts to have lower levels of financial resilience.

People with a serious mental illness are significantly more likely to be in severe or high financial stress, are less likely to be financially secure and fare worse on each of the individual resource groups than people without mental illness.

The gender split in financial resilience is fairly even overall. However, the four components of financial resilience are influenced by gender. Women have lower general levels of economic resources than men, but men have lower levels of social capital than women.

People who were born overseas in a non-English speaking country have lower levels of resilience than those who were born in Australia. Finally, the influence of age on financial resilience varies and is often affected by other factors.

One in four study participants reported difficulties accessing financial services. The barriers are varied, but include cost, trust, poor and inadequate services, and (for a few) language, disability and discrimination.

This underscores the importance of making financial information, products and services more user-friendly and accessible. This will ensure these resources are available and accessible to everyone who needs and wants them in society.

The factors influencing financial security are not surprising. People who own their own homes, have a university-level education and have a personal yearly income of more than A$100,000, for example, have higher levels of financial resilience. However, only 35.7% of Australians are financially secure.

The prevailing attitude around financial problems is that individuals are solely responsible for their situation. Our research challenges this ideas as it shows multiple aspects to financial resilience, some out of the individual’s control.

The below shows how interlocked the different components of financial resilience are and when pieces of the puzzle are removed, the most vulnerable people are at risk.

JigSawAt the moment social sector leaders are lobbying the government to scrap proposed budget cuts that will reduce the amount of certain welfare payments. Our research shows these same people have the least resilience to bounce back if they were to lose some financial support.

This is an example of how the government needs to play a more active role in understanding financial resilience and where support is needed. By understanding the often interrelated elements of financial resilience, tipping points and who is most at risk, prevention and intervention can be better tailored.

Authors: Rebecca Reeve, Senior Research Fellow, Centre for Social Impact, UNSW Australia; Kristy Muir, Professor of Social Policy / Research Director, Centre for Social Impact, UNSW Australia

Reporting Season Shows Impact of Low-growth Era

According to The West Australian, there are two main lessons from the 2016 earnings season. First, the Australian economy is well and truly in a low-growth era and second the earnings-growth potential of some of the nation’s favourite blue-chip stocks is not invincible. The economy is now basically a zero-sum game and few companies have any pricing power left. For example, CBA chief executive Ian Narev admitted last week over the medium term the bank could only grow profits at roughly the same rate as GDP.

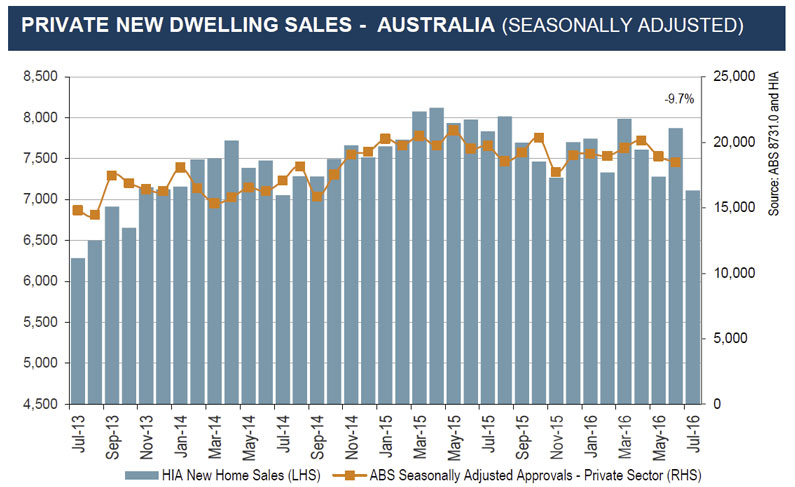
This is creating an inter-generational structural problem, because policy overly skewed to supporting the housing market is continuing the Australian ‘tradition’ of making the community debt slaves to the banks.

Stock-Pic

Solid dividend growth has proved not to be nearly as bankable as many income-dependent investors believed.

The market severely punished companies that missed forecasts or downgraded guidance but, by and large, they have ignored the steady lowering of the earnings bar over which companies are expected to jump.

No doubt most long-term shareholders have not yet lost faith in the profit potential of Wesfarmers, Commonwealth Bank and its three major bank rivals, the corporate behemoths that straddle the Australian continent like no others.

But it can no longer be argued they do not carry real downside profit risks as wage growth limps along at record lows, the workforce is increasingly “casualised” and world-beating household debt levels nudge 125 per cent of GDP, all of which pose severe risks to bad debts and weak spending trends.

This means the economy is now basically a zero-sum game and few companies have any pricing power left.

The management fad of cost-cutting to profit growth is perpetuating a negative feedback loop into deflating nominal GDP growth — growth not adjusted for inflation — that has begun to bite hard into revenue and profit potential in Australia and around the world.

One company’s cost saving is another’s lost revenue but there is little “fat” left to be cut after three years of corporate austerity to pay the juicy dividends investors have demanded.

CBA chief executive Ian Narev admitted last week over the medium term the bank could only grow profits at roughly the same rate as GDP, and that’s true for a Wesfarmers and many of the bigger companies too.

Nominal GDP roughly equates to the sum of the transactions upon which all companies can draw revenues and profits, and it has has sunk to a 60-year low of 2.1 per cent, a third to a quarter of levels prevailing prior to 2007.

That’s why even with a dominant national consumer footprint Wesfarmers’ Coles managed just 4.2 per cent revenue growth as rival Woolworths headed headed into a tailspin, reporting a 1.2 per cent drop in revenue last year. The average of their sales growth equates to nominal GDP growth.

CBA once demanded a 20 per cent price-earnings valuation premium to its rivals but the country’s biggest lender grew earnings just 2 per cent as the banking regulator began to rein in east-coast speculators driving house-price growth at multiples to income growth.

Overall, with just a handful of companies still to report, earnings have dropped about 8.5 per cent, dragged down by an average 48 per cent slump in resource profits — 15 per cent down for miners and a whopping 60 per cent for energy stocks.

Along with banks, industrial earnings have slipped too, down about 3 per cent on average according to Deutsche Bank analyst Tim Baker.

“Momentum is still strong for those with US dollar exposure, and for many domestic cyclicals,” he said.

“But falling profits in food retail and non-bank financials have hurt, as has ongoing softness in resource-exposed earnings.”

But analysts have tried to remain upbeat, supporting high valuations and slimmer dividend yields for now.

UBS strategist David Cassidy said, “defying the naysayers”, the 2017 outlook for S&P-ASX 200 stocks was a positive 6 per cent for the average non-resource stock.

Forecasts are one thing, however, and meeting them another, something all too many company executives and shareholders are learning the hard way after being mesmerised by lofty share prices and fooled by headline “real” GDP and unemployment data.

Over the past six years every rate cut has been forecast to be the bottom by growth optimists and yet nominal GDP has continued to decline deeper into recession levels with little room left to cut further.

“Our nominal growth today is lower than our real growth, by a full percentage point,” Treasurer Scott Morrison said this week.

“This is an uncommon predicament and a core challenge in working to bring the budget back to balance.”

Outgoing Reserve Bank governor Glenn Stevens pointed to the problem two weeks ago when he said “someone, somewhere” needed to be willing to borrow money and spend it.

Strategists at Patersons explained why this was difficult.

“Policy overly skewed to supporting the housing market is continuing the Australian ‘tradition’ of making the community debt slaves to the banks and is a huge disservice to the next generation who also need to afford to buy shelter, along with things like a university education that used to be supplied by the government through the taxation system in a former world where promoting higher community education was seen as economically beneficial and worth supporting,” they said.

“There is too much passive investment in the Australian economy, passive, idle cash sitting in assets like housing and stocks, and not enough funds pushing productivity, technological initiatives and creating real tangible benefits for the economy and wider community.”

More Strong Auction Results Today

According to the latest APM PriceFinder provisional auction results, there was another strong result today. This confirms the strong demand for property, especially in the south-eastern states and points to continued momentum into the spring.

Nationally, there were 1,646 properties listed, with 77.5% clearance, compared with 73.1% last week, and 73.3% this time last year, albeit off a higher number of listings.

In Sydney, 80.7% were cleared from the 574 listings, compared with 78% last week and 72.5% last year. Melbourne achieved 77.9% clearance from the 877 listings, compared with 73.2% last week and 76.9% last year, again from a higher number of listings. Of the 53 listings in Canberra, 79% cleared; of the 86 in Brisbane 49% cleared; and in Adelaide of the 56 listed, 61% cleared.

APM-27-Aug-2016APM-27-Aug-2016-1

Time for degrowth: to save the planet, we must shrink the economy

From The Conversation.

What is so refreshing about the UN’s Sustainable Development Goals is that they recognise the inherent tension between economic development and the ecology of our planet. Or so it seems. The preamble affirms that “planet Earth and its ecosystems are our home” and underscores the necessity of achieving “harmony with nature”. It commits to holding global warming below 2℃, and calls for “sustainable patterns of production and consumption”.

This language signals awareness that something about our economic system has gone terribly awry – that we cannot continue chewing through the living planet without gravely endangering our security and prosperity, and indeed the future viability of our species.

UN Sustainable Development Goals

But if you look more closely, a glaring contradiction emerges. The core of the SDG programme relies on the old model of indefinite economic growth that caused our ecological crisis in the first place: ever-increasing levels of extraction, production and consumption. SDG 8 calls for “at least 7% GDP growth per annum in the least developed countries” and “higher levels of economic productivity” across the board. In other words, there is a profound contradiction at the heart of these supposedly sustainable goals. They call for both less and more at the same time.

This call for more growth comes at an odd moment, just as we are learning that it is not physically possible. Currently, global production and consumption levels are overshooting our planet’s biocapacity by nearly 60% each year. In other words, growth isn’t an option any more – we’ve already grown too much. Scientists tell us that we are blowing past planetary boundaries at breakneck speed and witnessing the greatest mass extinction of species in more than 66m years.

The hard truth is that our ecological overshoot is due almost entirely to over-consumption in rich countries, particularly the West.

Ecological overshoot in action. Canadapanda/Shutterstock

SDG 8 calls for improving “global resource efficiency” and “decoupling economic growth from environmental degradation”. Unfortunately, there are no signs that this is possible at anything near the necessary pace. Global material extraction and consumption grew by 94% between 1980 and 2010, accelerating in the last decade to reach as high as 70 billion tonnes per year. And it’s still going up: by 2030, we’re projected to breach 100 billion tonnes of stuff per year. Current projections show that by 2040 we will more than double the world’s shipping, trucking, and air miles – along with all the things those vehicles transport. By 2100 we will be producing three times more solid waste than we do today.

Efficiency improvements are not going to cut it. Yes, some GDP growth may still be necessary in poorer countries; but for the world as a whole, the only option is intentional de-growth and a rapid shift to what legendary ecological economist Herman Daly calls a “steady-state” that maintains economic activity at ecological equilibrium.

De-growth does not mean poverty. On the contrary, de-growth is perfectly compatible with high levels of human development. It is entirely possible for us to shrink our resource consumption while increasing things that really matter such as human happiness, well-being, education, health and longevity. Consider the fact that Europe has higher human development indicators than the US in most categories, despite 40% less GDP per capita and 60% less emissions per capita.

This is the end toward which we must focus our full attention. Indeed, the surer route to poverty is to continue on our present trajectory, for, as top economist Joseph Stigltiz points out, in a world of ecological overshoot, GDP growth is diminishing living standards rather than improving them.

We need to replace GDP with a saner measure of human progress, such as the Genuine Progress Indicator, and abandon the notion of exponential economic growth without end. Sadly, the SDGs pass this urgent challenge down to the next generation – at the bottom of SDG 17 it states: “By 2030 build on existing initiatives to develop measurements of progress on sustainable development that complement GDP.” In other words, they shelve the problem until 2029.

Relaxation isn’t counted in GDP stats. Maxpetrov/Shutterstock

But what of employment? Whenever I lecture about de-growth, this is always the first question I get – and we have to take it seriously. Yes, de-growth will require eliminating unnecessary production and work. But this presents us with a beautiful opportunity to shorten the working week and give some thought to that other big idea that has captured the public’s imagination over the past couple of years: a universal basic income. How to fund it? There are many options, including progressive taxes on commercial land use, financial transactions, foreign currency transactions and capital gains.

Let’s face it – in an age of rapid automation, full employment on a global scale is a pipe dream anyhow. It’s time we think of ways to facilitate reliable livelihoods in the absence of formal employment. Not only will this assist us toward necessary de-growth, it will also allow people to escape exploitative labour arrangements and incentivise employers to improve working conditions – two goals that the SDGs set out to achieve. What’s more, it will allow people to invest more of their time and effort into things that matter: caring for their loved ones, growing their own food, nourishing communities, and rebuilding degraded environments.

Author: Jason Hickel, Lecturer, London School of Economics and Political Science