Believe it or not, that smartphone in your pocket has more computing power than all of NASA circa 1969. Okay, so it won’t get you to the moon but it can get you a pizza, or anything else. The silicon revolution that spawned the internet has created global companies and upended centuries-old industries. It’s the kind of creative destruction Schumpeter would appreciate, making us (labour, that is) more productive and the companies in which we invest more profitable.
Except that there’s no evidence of that actually happening, at least not since the 1990s. Earlier this month the US announced that non-farm productivity fell for the third consecutive quarter, the longest period of decline since 1979. It’s strange, don’t you think? Here we are in the midst of a transformative era of Uber, AirBnB, gene splicing and coffee cups that give you a kiss* – and the country that’s leading the way is experiencing falling productivity.
Theories abound as to why; from lazy workers and poor data to income inequality and under-investment (a story I will one day get to). Facebook investor Peter Thiel is so concerned he’s lovingly published a beautiful online lament (one must be careful about what one says about dear Peter), titled ‘What happened to the Future?’ It claims the rate of technological innovation is actually slowing, which is why we got Twitter’s 140 characters instead of flying cars.
The truth is more banal; no one really knows why productivity growth has been in long-term decline.
The Treasury chart shows Australia’s performance is better than most, although that’s not saying much. It’s been decades since Western countries experienced the rates enjoyed in the 1950s and ’60s. We might be transitioning away from the mining boom with some success, via an investment-led property boom, but slow productivity growth is a global problem.
This issue looms large over negative interest rates, currency wars and sovereign debt; all of which would be less of an issue if productivity growth were stronger. Rising productivity drives increases in household income, which boosts economic growth and corporate profits. In the long run we can’t expect dividends to increase without it. And yet dividends have been increasing faster than corporate profit growth.
Higher dividend payout ratios mean lower levels of reinvestment but that’s what investors demand, sacrificing higher future income in favour of cash right now. And companies have all the excuses they need to comply. Hurdle rates are ridiculously high compared with interest rates and they, like their customers, are worried about the future. Why not spend earnings on mergers, acquisitions, share buybacks and dividends? So, enjoy the sounds of those fat cheques hitting the doormat over the next few months, they may not be quite as high in years to come.
Reading between the lines, Commonwealth Bank chief executive Ian Narev might hold a similar view. At the bank’s recent results presentation he said that “dividends are not annuities”, a bland statement of fact but a rebuke of sorts to dividend-chasing investors. Our banking analyst, Jon Mills, meanwhile, believes the big banks “are going to find it tough to raise earnings and dividends over the next few years”.
It’s a common view among brokers and fund managers and has been for quite a while. Increased capital requirements and regulatory costs, potentially higher provisioning and slower credit growth could be a drag on the sector’s earnings. Last week, corporate trailing indicator Moody’s joined the slumber party, putting the sector on a negative credit outlook – not an actual downgrade but the threat of one.
Bank shareholders shouldn’t be too concerned. InvestSMART’s research director James Carlisle, who excitedly told me yesterday the banks are within spitting distance of joining the Buy list, certainly isn’t. If investors are reaching for yield, they’re not leaning the banks way.
Perhaps a change is afoot. Wealth manager IOOF Holdings and conglomerate Wesfarmers, both of which in the past have registered extremely high dividend payout ratios, recently announced dividend cuts. Neither were punished for it, which is as it should be. Dividends should reflect the state of a company’s finances and the opportunities it has to reinvest capital. When boards get hung up on maintaining dividends bad decisions can be made on both those fronts.
Kudos, too, to BHP Billiton, where management rather than mine-quality is the problem. It has committed to pay out at least 50 per cent of underlying earnings as dividends. With one hand tied behind its back the company’s capacity to make more overpriced acquisitions is therefore halved. Sometimes, a company unable to reinvest too much capital is a good thing.
There’s another lesson here, too, one that might be echoed in the banking sector should a credit downgrade actually occur. Deputy research director Gaurav Sodhi, in his review of BHP, put it thus: “It’s not good enough to wait for improvements in business conditions before buying shares. Uncertainty and pessimism are what create opportunity and expectations will always lead reality.” Investors aiming to outperform the market must lead, and we can’t do so from the back.
Another factor evident this reporting season is the effect bond yields are having on growth. Low bond rates have caused a weird reversal, one where bonds are purchased for capital growth and shares for income. Highly-leveraged, tick-tock infrastructure stocks like Transurban and Sydney Airport, plus just about every Australian Real Estate Investment Trust (AREIT) you can think of, have enjoyed huge share price increases as a result. We’re currently at the point where high yield usually implies higher share price risk.
Now it’s the turn of growth to get a little love. Earnings growth expectations were low this reporting season and any company that managed to beat them, even by a bit, has benefited. ASX and Trade Me – the latter still on our Buy list and the former only recently removed from it (disclosure: I’m a shareholder) – are good examples. Whether this is the return of common sense or an early preview of another episode of crazy we’ll just have to wait and see.
All of these examples, though, point to the incredible influence the bond market is having on share prices. Bond yields that are either negative or in low single digits are the widespread numerical expression of Larry Summers’ belief in secular stagflation. In non-economists speak, that means structurally lower global growth, accompanied by lower-for-longer rates as a consequence. So common is this thesis it’s hard to find anyone of note that contradicts it. Right now “lower for longer” seems the epitome of a cheery consensus, which is perhaps the best reason to worry about it. Time to kiss the coffee cup for good luck perhaps?
*Korean designer Jang Woo-Seok’s ‘Human Face Coffee lids’:
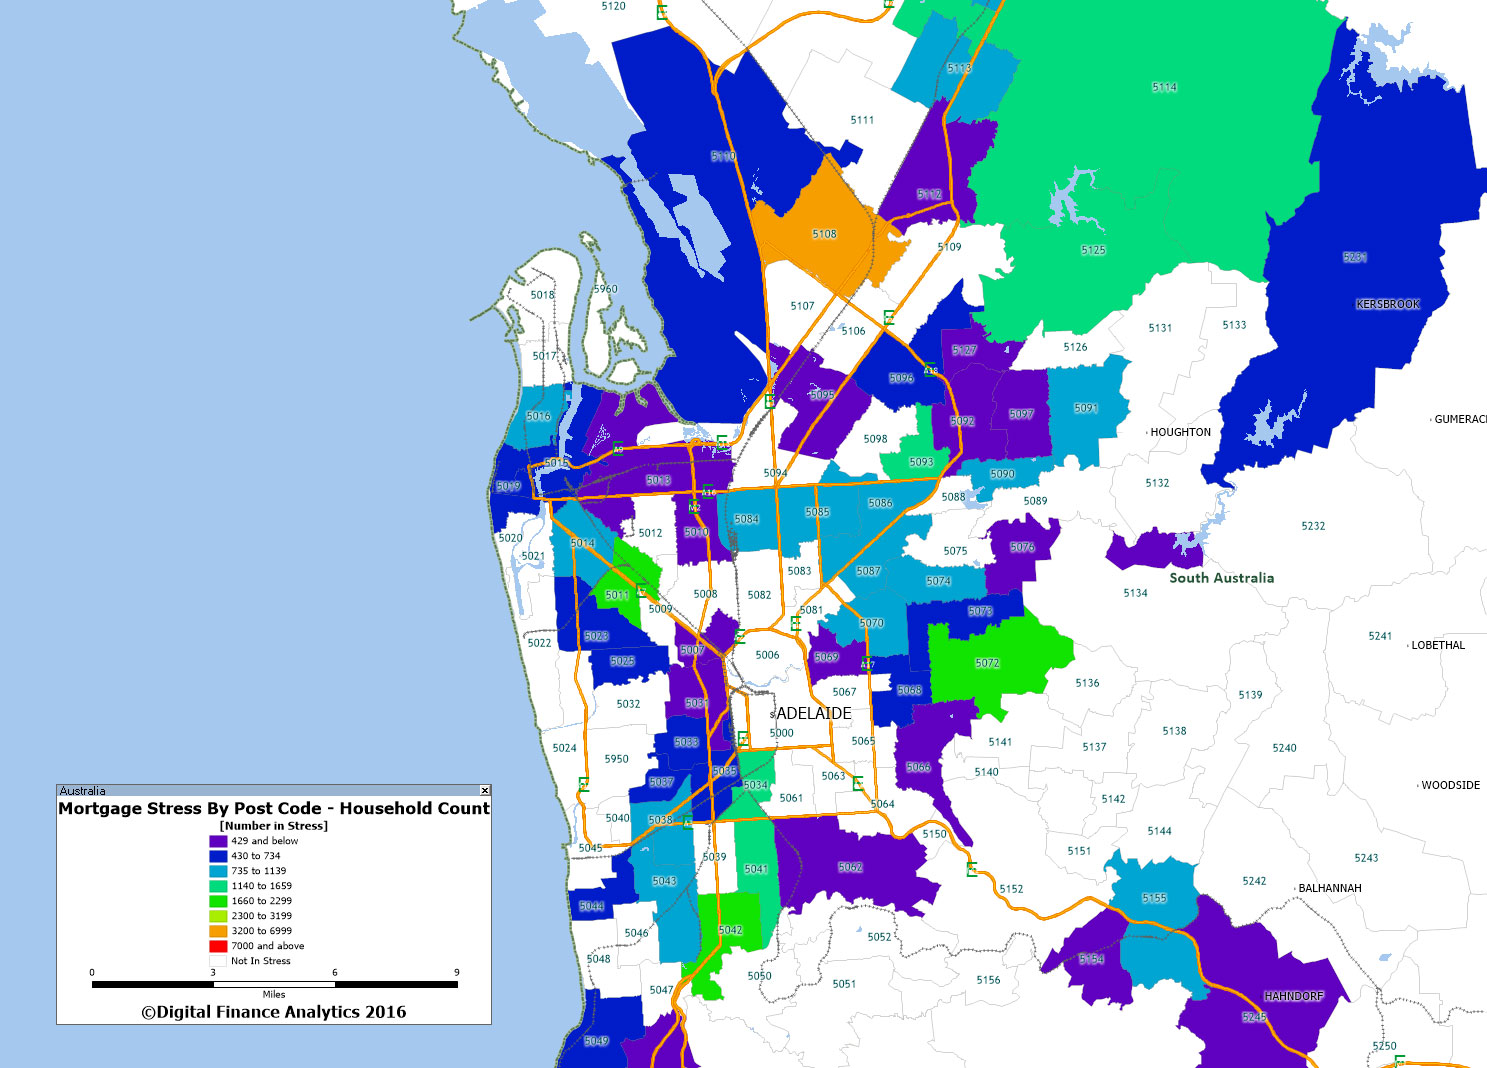
As we continue our analysis of mortgage stress, using data from our household surveys, today we look at South Australia. With 24% of households in mortgage stress across the state, this is one of the higher proportions in the country currently; thanks to limp income growth, higher unemployment and lower absolute income levels. Home prices have not move up so much, but then, the price to income and loan to income ratios are no less extreme than in other states.
Here is the map centred on Adelaide, showing the relative number of households we asses as being in mortgage stress.
Here is a list of the top 10 across the state. The highest concentration is in Paralowie, a suburb in the north of Adelaide, South Australia. It is predominantly a residential suburb. Many of the properties are valued in the range of 250-350k. We have this classified in our outer suburban zone, and the households are predominately battling urban. Next is Woodville West, another suburb of Adelaide, situated about 9 kilometers northwest of the Central Business District. It lies within the City of Charles Sturt. We classify this post code as urban fringe and the stressed household segment is mainly battling urban.
ASIC says the Federal Court has found that the directors of Storm Financial, Emmanuel and Julie Cassimatis, breached their duties as directors. The Court also found that Storm Financial provided inappropriate advice to certain investors.
Since around 1994, Storm Financial operated a system created by the Cassimatises, in which what ASIC considered to be “one-size-fits-all” investment advice was recommended to clients. The advice recommended that clients invest substantial amounts in index funds, using “double gearing” (Storm Model). This approach involved taking out both a home loan as well as a margin loan in order to purchase units in index funds, create a “cash dam” and pay Storm’s fees. Once initial investments took place, “Stormified” clients would be encouraged to take “step” investments over time.
By the time of Storm’s collapse in early 2009, approximately 3,000 of its 14,000 client based had been “Stormified”. In late 2008 and early 2009, many of Storm’s clients were in negative equity positions, sustaining significant losses.
The case that ASIC advanced against the Cassimatises centered around a sample of investors who were advised to invest in accordance with the Storm Model. ASIC alleged that the advice provided to those investors by Storm was inappropriate to their personal circumstances, considering that each of the investors were alleged to be over 50 years old, were retired or approaching and planning for retirement, had little or limited income, few assets and had little or no prospect of rebuilding their financial position in the event of suffering significant loss.
Among other things, it was also alleged that Storm failed to properly investigate the subject matter of the advice given to those investors. As such, ASIC also alleged that Storm failed to do all things necessary to ensure that the financial services covered by its licence were provided efficiently, honestly and fairly.
ASIC further alleged that because the Cassimatises were responsible for the day-to-day significant decisions in relation to the provision of financial services to Storm’s clients and exercised a high degree of control over its systems and processes, they had caused Storm to contravene its obligations under the Corporations Act and did not exercise their powers as directors of Storm with the degree of care and diligence that a reasonable person would have exercised in that situation.
In a 217 page judgment, Justice Edelman found that:
Storm provided advice to certain investors, that was inappropriate to their personal circumstances and failed to give such consideration to the subject matter of the advice and did not properly investigate the subject matter of the advice given.
“A reasonable director with the responsibilities of Mr and Mrs Cassimatis would have known that the Storm model was being applied to clients such as those who fell within this class and that its application was likely to lead to inappropriate advice. The consequences of that inappropriate advice would be catastrophic for Storm (the entity to whom the directors owed their duties). It would have been simple to take precautionary measures to attempt to avoid the application of the Storm model to this class of persons.” (paragraph 833)
Commissioner Greg Tanzer said, “This is an important decision which emphasises the importance of directors’ duties to ensure that they do not cause the companies that they control, to breach the law. The decision also highlights the significant obligation on financial services licensees to provide financial advice that is appropriate to the persons to whom it is given.”
The matter will be listed for a further hearing at a later date to determine what civil penalties and disqualification orders should be imposed on the Cassimatises as a result of the breach of their director duties.
Global banking giant Citi believes time is nearly up on Australia’s apartment building boom, with a glut of supply over the next two years likely to trigger a drop in prices.
The bank’s research team is predicting that, unlike many previous housing cycles, it will be oversupply, and not a rise in interest rates, that brings the boom to an end.
“Housing cycles usually end with monetary policy being tightened. But this monetary policy easing cycle is longer than normal with the latest rate cut only this month,” the bank’s economists observed.
“Low rates therefore will provide continued support for the housing cycle into next year, both for new construction and renovations, although lending conditions have tightened.”
Citi said housing starts have reached a record 230,000 over the past 12 months and, while detached house construction is running around record levels, apartment building has smashed previous highs.
The bank expects the number of starts to fall to 205,000 next year and 172,000 in 2018.
The Citi housing clock puts the market at just over an hour to midnight.
However, the party is not over just yet, and the bank has set its housing clock to just before 11:00pm, where midnight is the turning point where building peaks and prices start falling.
“Apartment completions lag starts by 1-2 years so the developing oversupply will continue to build into 2017 and 2018 with completions probably doubling across the eastern states,” the research note argued.
According to Citi’s equity analysts, that presents another couple of good years for builders and building materials, but risks are already rising for banks, developers and the hotel sector.
Settlement risk looms large for developers, banks
The main threat for developers, and also a big worry for banks, is settlement risk – that is where an off-the-plan apartment buyer who has put down a deposit does not complete the purchase when construction is finished.
Even though developers can chase off-the-plan purchasers for the full contract price of the unit, with many buyers located overseas there is great uncertainty about how successful these pursuits will be.
If a glut of apartments is sending prices downward, it is possible developers, and potentially their lenders, will be left out of pocket.
With oversupply a key element in triggering the price falls that would increase settlement risk, Citi has identified some hotspots of concern.
It said Brisbane is already in oversupply, especially in and around the CBD, while Melbourne is well on the way, with the risk of oversupply concentrated near the city.
While Sydney as a whole is less at risk of seeing supply exceed demand, Citi warned that the Botany council area is in particular danger of excess supply, with Auburn, Lane Cove and Ryde also at some risk.
Citi said that oversupply is seeing rents stagnate or even fall, and may result in home prices following.
“The combination of large rises in house prices over the past few years in Sydney and Melbourne and gradually increasing housing supply relative to demand has seen rising vacancy rates, softer rents and record low rental yields,” the analysts noted.
“At some point a correction in house prices could follow.”
However, the bank said low interest rates, more restrained detached house building and solid population growth should mean any home price falls are moderate.
Likely to be 12-24 months before unit prices fall
It is also expecting any price declines to be a little way off.
“There is a 12-24 month lag to completions and so far the level of dwelling completions is only about half the level of starts across the three eastern states,” Citi observed.
“This suggests that the peak in new supply wouldn’t occur until late next year.
“It will be then that the downward pressure on apartment prices should become more apparent.”
While low interest rates are likely to soften any blow to home prices by propping up demand and reducing the level of forced sales, perversely, Citi said those low rates are contributing to the weak inflation they are supposed to be boosting.
Aside from companies affected by settlement risks, and property buyers who see the value of their purchase slide, Citi analysts warn that hotels could end up being the big losers out of the inner-city apartment glut.
With the rise of Airbnb, many of the CBD apartments struggling to find buyers or tenants may end up as short-term and holiday rentals, competing for business with traditional hotels.
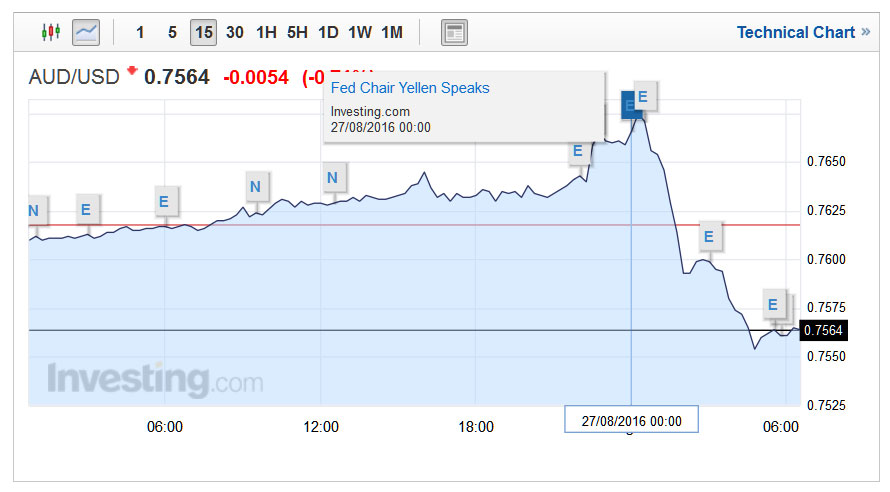
Monetary policy is alive and well, according to the FED, and interest rate rises are on the cards in the US. Chair Janet L. Yellen spoke at “Designing Resilient Monetary Policy Frameworks for the Future,” a symposium sponsored by the Federal Reserve Bank of Kansas City, Jackson Hole, Wyoming, her speech was entitled “The Federal Reserve’s Monetary Policy Toolkit: Past, Present, and Future.”
The AU/US dollar moved in reaction to the speech.
In a nutshell, monetary policy remains relevant, and given the current economic indicators, there appears scope for rate rises later this year, possibly as soon as September. Her comments on how rate adjustments have been simulated are worth reading. It also means that we may see some falls in asset prices as the rises bite, across stocks and property.
A recent paper takes a different approach to assessing the FOMC’s ability to respond to future recessions by using simulations of the FRB/US model. This analysis begins by asking how the economy would respond to a set of highly adverse shocks if policymakers followed a fairly aggressive policy rule, hypothetically assuming that they can cut the federal funds rate without limit. It then imposes the zero lower bound and asks whether some combination of forward guidance and asset purchases would be sufficient to generate economic conditions at least as good as those that occur under the hypothetical unconstrained policy. In general, the study concludes that, even if the average level of the federal funds rate in the future is only 3 percent, these new tools should be sufficient unless the recession were to be unusually severe and persistent. Figure 2 in your handout illustrates this point.
It shows simulated paths for interest rates, the unemployment rate, and inflation under three different monetary policy responses–the aggressive rule in the absence of the zero lower bound constraint, the constrained aggressive rule, and the constrained aggressive rule combined with $2 trillion in asset purchases and guidance that the federal funds rate will depart from the rule by staying lower for longer. As the blue dashed line shows, the federal funds rate would fall far below zero if policy were unconstrained, thereby causing long-term interest rates to fall sharply. But despite the lower bound, asset purchases and forward guidance can push long-term interest rates even lower on average than in the unconstrained case (especially when adjusted for inflation) by reducing term premiums and increasing the downward pressure on the expected average value of future short-term interest rates. Thus, the use of such tools could result in even better outcomes for unemployment and inflation on average.
Of course, this analysis could be too optimistic. For one, the FRB/US simulations may overstate the effectiveness of forward guidance and asset purchases, particularly in an environment where long-term interest rates are also likely to be unusually low.22 In addition, policymakers could have less ability to cut short-term interest rates in the future than the simulations assume. By some calculations, the real neutral rate is currently close to zero, and it could remain at this low level if we were to continue to see slow productivity growth and high global saving.23 If so, then the average level of the nominal federal funds rate down the road might turn out to be only 2 percent, implying that asset purchases and forward guidance might have to be pushed to extremes to compensate.24 Moreover, relying too heavily on these nontraditional tools could have unintended consequences. For example, if future policymakers responded to a severe recession by announcing their intention to keep the federal funds rate near zero for a very long time after the economy had substantially recovered and followed through on that guidance, then they might inadvertently encourage excessive risk-taking and so undermine financial stability.
Finally, the simulation analysis certainly overstates the FOMC’s current ability to respond to a recession, given that there is little scope to cut the federal funds rate at the moment. But that does not mean that the Federal Reserve would be unable to provide appreciable accommodation should the ongoing expansion falter in the near term. In addition to taking the federal funds rate back down to nearly zero, the FOMC could resume asset purchases and announce its intention to keep the federal funds rate at this level until conditions had improved markedly–although with long-term interest rates already quite low, the net stimulus that would result might be somewhat reduced.
Conclusion
Although fiscal policies and structural reforms can play an important role in strengthening the U.S. economy, my primary message today is that I expect monetary policy will continue to play a vital part in promoting a stable and healthy economy. New policy tools, which helped the Federal Reserve respond to the financial crisis and Great Recession, are likely to remain useful in dealing with future downturns. Additional tools may be needed and will be the subject of research and debate. But even if average interest rates remain lower than in the past, I believe that monetary policy will, under most conditions, be able to respond effectively.
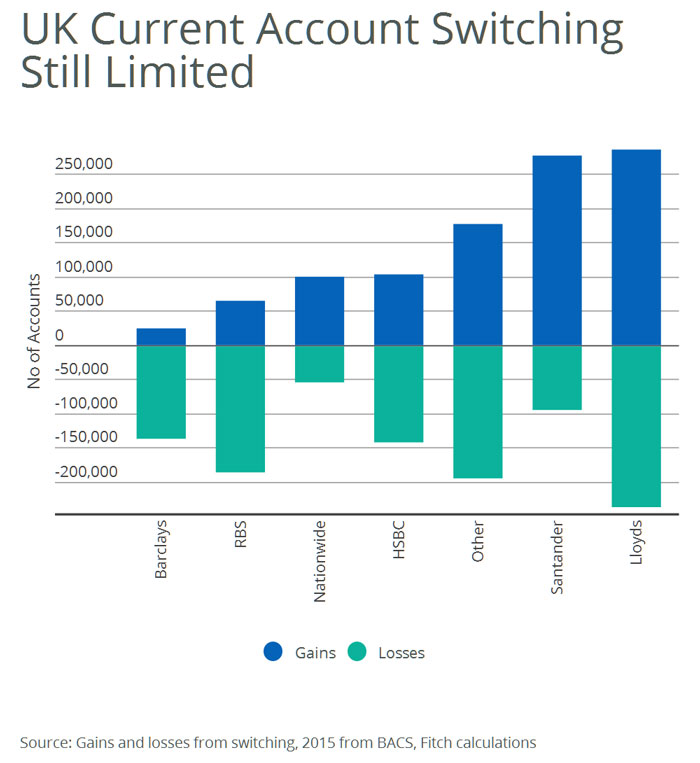
Remedies listed in the Competition & Markets Authority’s (CMA) final report on the UK’s retail banking market could lead to a slow but steady erosion of profitability at the major UK banks, says Fitch Ratings. But the initiative depends on customers being comfortable sharing sensitive financial information with other banks and third parties, which could represent a major barrier.
The remedies hinge on using technology to ensure that customers get the best deal, implying a loss of revenue for the banks. For example, several of the CMA’s remedies are directed at making sure customers can either reduce or avoid overdraft charges, which the CMA says bring in one-third of total revenue generated by retail banking activities in the UK.
UK current account holders are already able to ‘switch’ their account between banks in seven days by using the Current Account Switch Service (CASS), in place since September 2013. CASS was set up by the UK government to improve competition, but switching rates remain relatively low. In 2015, only around one million customers, equivalent to 3% of current account holders, used CASS.
Wealth management company Yellow Brick Road Holdings Ltd has announced a full year loss for FY16 of $9.5m compared with a loss of $2.5m in the prior year. This despite an increase in revenue for the year 31.4% to $217.9m. No dividends were recommended or paid in the financial year. They did not meet their revenue targets and as a result, a period of consolidation and cost cutting is now the order of the day.
Underlying earnings before interest expense, tax, depreciation and amortisation (‘EBITDA’) and excluding impairment charges and other non-operating expenses for the consolidated entity was a loss of $3,901,000 (2015: profit of $1,276,000).
During the year they made a number of acquisitions, and recently announced a significant restructure.
They aspire to become Australia’s leading non-bank financial services company by 2020 through four core activities.
Central is lending activity that provides scale. Group settlements grew by $3.5 billion in FY16, up 28 per cent and with over $37 billion in loans
under management to date. They are pursuing a $100 billion loan book under management which equates to an approximate market share of 5 per cent. With residential lending softening, the group has invested further in commercial lending achieving 32 per cent growth vs PCP. Additionally in November they entered the small business lending market via a partnership with new SME lending platform Valiant Finance.
This lending business provides a foundation and opportunity for warm introductions for wealth management services which provide margin. Wealth management revenue is up 11 per cent against FY15, with insurance premiums under management up 25 per cent and Yellow Brick Road Super funds under management up 19 per cent on the prior comparable period. Their suite of wealth offerings was rounded out in FY16 by the launch of critical gateway and adjacent products including My YBR Account (OneVue) and eight separately managed accounts, Loan Protect (Metlife), and Protected Equities Fund (Smarter Money Investment and NWQ). They are targeting wealth penetration of 30 per cent of their client base.
Using geographic modelling, they are increasing their distribution network of local business owners in all communities across Australia. Ongoing recruitment initiatives have netted 354 additional qualified representatives in the Vow Financial and Yellow Brick Road networks in FY16. New quality benchmarks and onboarding procedures are helping ensure higher productivity of these new members with a particular focus on the first two years of operation. The group now has 1500 qualified members operating in all markets across Australia. The FY17 focus is on maintaining momentum in broker recruitment whilst creating multiple avenues for access to financial planners. The target is 300 branded branches and 1000 broker groups.
Strategic partnerships that leverage scale are an important source of product income. By 2020, they intend to see 10 per cent of income through partnerships, which can be achieve without the complexity or cost of vertical integration.
They say they have faced a number of headwinds in the year.
Lower rates have increased competition and the addition of more players in the marketplace has seen an increase in refinancing behaviour. Customers are more aware of their ability to get a better rate and the landscape is more competitive than ever. This is of benefit to the younger Yellow Brick Road book but does place some challenges on our more established Vow brokers.
An increase in the cost of funding has put pressure on margins across the
industry. As lenders respond to regulatory pressure, borrowers face the hurdle of greater scrutiny on household expenditure measurement (HEM) and income verification, which plays into lower approval rates and impacts market size.
The outcome of the current broker remuneration review will likely further shape the mortgage industry in FY17. For planners, new legislation that mandates a biennial obligation to seek client permission to continue servicing and charging will require significant changes to the servicing model of most.
Australia’s investment lending landscape changed with tougher rules for offshore purchasers and restrictions to lenders’ investor ratios. This has resulted in a restricted environment.
“The completion of a period of heavy investment in brand and distribution build has been met with tough lending conditions and as a result our revenue targets have not been reached. As is appropriate, when macro factors shift in this way, we adapt by shifting to a period of consolidation. This means some tough cost cutting and maintaining strict spending
discipline, while bedding down the recent acquisitions. It also means delivering our technology innovations and leveraging our brand equity”.
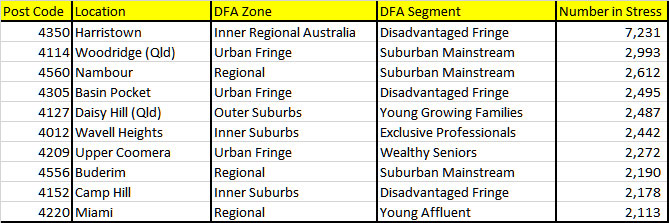
As we continue our series on mortgage stress, today we look in and around Brisbane. This includes the post code with the highest stress count across all Australia. Refer to our earlier posts for the definitions we use.
Here is the geomapping in and around Brisbane showing the relative number of households in stress by post code.
Here is a list of the top 10 across QLD. Depending on the location, the predominate segment varies quite considerably. Harristown, 4350 a suburb of Toowoomba is located to the southwest of the city centre and has the highest count of stressed households across Australia.
Many households have had little or no income growth, are having to cope with large mortgages, and some more affluent segments are finding rental stream growth from investment properties fading.
Next time we will cover postcodes in SA, then VIC and WA.
Truth be told, most Australians live in good housing. This is good news for all of us because our housing is a major determinant of our health and wellbeing. But our very recent research findings, published this month in the Journal of Prevention and Intervention in the Community, and the lessons of history tell us this good news story is at risk.
Ideally, housing provides us with the secure, comfortable shelter that people and their families need to live healthy, productive lives. In general, we have a modern housing stock with good heating and cooling, few major structural problems and few problems with damp and mould. By contrast, bad housing makes it much more likely you will get sick and stay sick once ill.
In Australia’s early years, much of the housing stock was of poor quality, often overcrowded, and posed real risks to people’s health. Slums were common in the inner parts of the major cities and in many country towns.
As late as 1915 bubonic plague was a reality in the poorer parts of our cities and other contagious diseases remained an ever-present risk. Numerous letters to the editor documented a real social concern with the housing standards of the poor.
Government intervention, economic prosperity and tenancy laws all improved housing conditions across Australia. Within a century Australia was defined by good housing and high rates of home ownership. The nation saw off the last of its slums in the late 1940s.
Now the same conditions that gave rise to substandard housing in the 19th century are returning in the 21st, with a likely similar outcome. Recently, the Reserve Bank governor acknowledged young Australians need their parents’ help to buy a home in Sydney. But most Australians don’t have a wealthy and doting parent to fund them into the house of their dreams.
The alternative is to live in lower-quality housing and to make do with a home that is relatively inaccessible, fundamentally unaffordable or both.
A million Australians on the housing brink
The confronting reality is that poor housing conditions are more prevalent in Australia than we think.
We have a sizeable “hidden fraction” of Australians living in poor-quality housing. In particular, many of our most vulnerable have the double disadvantage of also having housing conditions that we might deem as falling below an unacceptable standard.
In one of the few contemporary analyses of this issue, we used the Household Income and Labour Dynamics (HILDA) Survey, a national longitudinal dataset, and find compelling evidence of a substantial stock of poor-quality housing in Australia.
The scale of our findings is somewhat surprising: we found almost a million Australians are living in poor or very-poor-quality housing. Within this total, more than 100,000 are residing in dwellings regarded as very poor or derelict.
These simple findings are important. They show the existence of a significant (and currently little known) population of individuals living in very poor conditions. At the very least, we need to monitor Australian housing conditions in a systematic way if we are to avoid this problem worsening.
Harms of poor housing multiply
Poor-quality housing makes the already disadvantaged even worse off. Younger people, people with disabilities and ill health, those with low incomes, those without full-time (or any) employment, Indigenous people and renters are much more likely to be found in the emerging slums of 21st-century Australia.
Importantly, many of these groups are already disadvantaged and (most probably) have a pressing need for housing that improves or supports their health and wellbeing. People with an existing illness or disability, for example, are almost twice as likely to live in dwellings in very poor condition as people without a disability or illness.
These findings about the size and uneven distribution of the problem should force us to ask what effects poor-quality housing has on people – on their mental, physical and general health? It is clear from our analysis that such housing has measurable impacts on mental, physical and general health. This impact is large enough to be statistically significant.
Given the time it takes to reform policy and plan for our cities and regions, Australia urgently needs to face up to the dismal reality that once again many Australians are living in housing not fit for habitation.
Governments must take steps to ensure the supply of affordable housing of reasonable quality. Otherwise, we are destined to become a nation scarred once again by slums, reduced life chances and shortened lives.
Authors: Emma Baker, Associate Professor, School of Architecture and Built Environment, University of Adelaide; Andrew Beer, Dean, Research and Innovation, University of South Australia; Rebecca Bentley, Associate Professor, Centre for Health Equity, Melbourne School of Population and Global Health, University of Melbourne
The housing market appears to be responding to a number of factors which have spurred further growth in home values. Official interest rates are at historic low levels which has encouraged borrowing for housing and driven housing debt to record-high levels. The low interest rate setting is also seeing significant competition amongst lenders which has resulted in substantial discounts to headline mortgage rates. Furthermore, while the total number of homes available for sale is similar to levels a year ago, there has been significantly fewer newly advertised properties listed for sale over the past few months relative to previous years. The low number of newly advertised dwellings available for sale has created a sense of urgency for buyers in the market, particularly in Sydney and Melbourne, and resulted in further increases in home values over this growth cycle which has been running for more than four years.
While the banking regulator has implemented policies aimed at slowing investment related credit demand, his has not resulted in a significant cooling in the housing market. The pace of investment related credit growth has slowed from a peak of nearly 11% per annum to 5% over the most rent 12 months period, however we are now seeing an uplift in lending to investors once more. Following the most recent interest rate cut, auction clearance rates have elevated to levels not seen for more than a year, particularly in Sydney, the nation’s least affordable housing market.
Interest rates
On August 2, the Reserve Bank (RBA) decided to cut official interest rates by 25 basis points to 1.5%. While interest rates were lowered to historic lows, headline variable mortgage rates were generally reduced by much less, with each of the Big 4 banks lowering their mortgage rates by no more than 14 basis points. Despite the fact that the interest rate cuts were not passed on in full to mortgage holders, mortgage rates below 4% are available for those who wish to move from their current lender. With most mortgages on a variable rate, any cut to mortgage rates will improve a household’s disposable income. Furthermore, it has become clear that it will also give them more confidence to increasingly purchase more expensive homes, well in Sydney and Melbourne at least.
Housing debt
Each quarter the RBA publishes ratios of household finances which include the ratio of household debt to disposable income. The latest data to March 2016 shows that the typical level of housing debt is 134.7% higher than household disposable income. The current ratio is a record-high but it is important to remember that it is a national snapshot and conditions across different housing markets are likely to vary substantially. Since the current phase of growth in home values commenced in the June 2012 quarter, this ratio has lifted from 119.0%.
While the ratio of housing debt to disposable income has increased and is at a record-high, the ratio of housing assets to disposable income has also risen as home values have increased. In the June 2012 quarter, the typical value of household assets was 394.4% higher than household disposable income. By March 2016, the ratio had increased to 470.8% indicating a significant increase in the value housing assets. Again, it should be remembered that this is a national measure and local market ratios are likely to be vastly different especially within areas of very little value growth over that time as well as those areas in which home values have fallen.
Properties listed for sale
Over the four weeks ending August 21 2016 there were 39,676 new (not previously advertised for at least six months) residential properties listed for sale and 229,386 total (includes new and relisted properties) properties advertised for sale. The number of newly advertised properties listed for sale was -3.4% lower than at the same time last year and new listings have been lower each week year-on-year since early June 2016. Meanwhile, total listings are -0.9% lower than they were a year ago and on a weekly basis have been consistently lower year-on-year since early July of this year. New and total listings are now starting to increase as we head closer to the beginning of the Spring Selling Season as they do each year.
While the national figures show fewer listings than a year ago, the trends are very different across individual capital cities, particularly in Sydney and Melbourne where home value growth conditions are strongest.
In Sydney, over the past four weeks there were 6,299 newly advertised and 18,951 total properties advertised for sale. Year-on-year, new listings have now been lower than they were the previous year fairly consistently since last November and are currently -20.6% lower than they were a year ago. Over the past four weeks there were 17,949 total listings in Sydney which was 0.8% higher than a year ago. While total listings are slightly higher than a year ago, there is very little new stock being listed for sale. New listings are arguably more important than relisted properties, especially if the relisted stock has been for sale for a long period of time and vendors aren’t adjusting their price expectations. Even though spring is just around the corner, there is very little fresh stock being added to the market.
It is a similar story in Melbourne where there were 7,177 new and 25,846 total residential properties listed for sale over the four weeks to 21 August 2016. The number of new listings was -9.4% lower year-on-year and total listings were -0.8% lower. Again, with spring just around the corner there is a relatively low supply of newly advertised properties hitting the market for sale.
Mortgage demand
One of the big challenges the RBA has is the quality and regularity of mortgage data collection. While housing finance data is published each month, owner occupier housing finance commitments are published both on a number and value basis while investor housing finance commitments are only published on the basis of value not the number of loans. With the investment segment having become so prevalent, it is a challenge not knowing both the number and value, particularly when investment is so strong in Sydney and Melbourne at a time when home value growth is also so strong. Adding to the challenge of interpreting housing finance data is the lack of clarity about how off-the-plan unit purchases are captured in the data. It is unclear as to whether they are classified as construction of dwellings or purchase of new dwellings. Finally re-classification of large swathes of mortgages from lenders away from investment and toward owner occupiers has made reading the market even more difficult.
The latest housing finance data showed that in June 2016 there was $32.6 billion worth of commitments with the value having increased by 2.3% over the month following a 1.8% rise in May. Although mortgage lending is rising, it remains -2.1% lower than its peak in April of last year. Over the month, there was $20.8 billion in commitments to owner occupiers and $11.8 billion in commitments to investors. Both segments of lending rose over the month however, owner occupier lending is -2.4% lower than its December 2015 peak while investment lending is -22.0% lower than its April 2015 peak.
Owner occupier lending remains quite strong and although investment lending has slowed significantly, there is now scope for it to increase over the coming months. Without additional details on the number of investment loans it is difficult to know whether the increase is being driven by larger loan sizes, a larger number of loans or a combination of both.
Auction clearance rates
Auction clearance rates are one of the timeliest indicators of the housing market and they tend to be indicative of the broader housing market trends. It is important to remember that far more homes sell by private sale than by auction and auctions are only a significant proportion of sales in the Sydney, Melbourne and Canberra housing markets.
Auction clearance rates in Sydney last week were at their highest levels in more than a year. Sydney’s auction clearance rate has been above 70% for 18 consecutive weeks and in Melbourne they have been above 70% for 7 consecutive weeks.
As already discussed, the supply of homes available for sale, particularly in Sydney and Melbourne, is much lower than it has been over recent years. This is particularly evident when looking at auction volumes. Over 2016 so far there have been 18,619 auctions in Sydney compared to 25,399 auctions at the same point in 2015. This represents a -26.7% decline in the number of auctions in Sydney over the year to-date. In Melbourne there have been 23,779 auctions so far this year which is -9.5% lower than the 26,282 auctions to the same point last year. The low volume of auction stock is likely to be resulting in the ongoing strength in clearance rates across each city. Less stock for sale creates a sense of urgency for those looking to purchase.
So what does this mean for Spring?
It is too early to say definitively what will happen this Spring but I would be very comfortable stating that what happens with property listings will have a substantial influence on the market’s performance over the period. Spring is typically characterised by a fairly significant upswing in stock for sale, this is driven by the belief that Spring is the best time of year to sell (that is a topic for another day). As supply increases, the value growth performance can slow and as we saw last year, auction clearance rates can actually start to dip. So the amount of stock which becomes available for sale will be an important factor for the strength of the Sydney housing market.
The recent interest rate cut is another important consideration for the market’s performance. Although mortgages and the availability of them, is calculated on the borrower’s ability to repay the mortgage at a much higher interest rate, lower mortgage rates impact households by giving them the option to reduce mortgage repayments and therefore having more money each week in their pocket. This is because most mortgages are on a variable rate and changes to the interest rate on their largest commitment (the mortgage) have an immediate impact on household balance sheets. With the recent cut to interest rates, it is unlikely to mean that people that could not previously borrow now can, but it does mean that households that previously weren’t considering moving home or buying an investment property may now be more inclined to do so. This may result in more confidence from those looking to upgrade their property to list their home which means that they also become an additional purchaser. If someone is now starting to consider buying an investment property it also means additional demand for housing. How many new buyers there are in Spring remains to be seen but it may encourage an increase in demand for purchase and could result in more people looking to sell their home.
The other major consideration, particularly in Sydney and Melbourne, but also across the rest of the country is what the prospects are for additional increases in home values over the short and medium term. Combined capital city home values have been rising for more than four years now however, this has largely been driven by Sydney and Melbourne due to their much stronger economies. While the economies in these cities remain strong, the increasing cost of housing due to the four plus years of value growth may be starting to deter buyers. When you also consider that rents are increasing at record low levels (falling in some areas) and gross rental yields are at record lows, purchasing a property, particularly an investment, is looking less attractive than it has for some time. Especially when you also factor in the heightened level of housing construction, most of which is inner city units, which is currently underway.
It is going to be interesting to see how all of these factors play out over the next few months and ultimately how the housing market performs.

The Treasury chart shows Australia’s performance is better than most, although that’s not saying much. It’s been decades since Western countries experienced the rates enjoyed in the 1950s and ’60s. We might be transitioning away from the mining boom with some success, via an investment-led property boom, but slow productivity growth is a global problem.
Higher dividend payout ratios mean lower levels of reinvestment but that’s what investors demand, sacrificing higher future income in favour of cash right now. And companies have all the excuses they need to comply. Hurdle rates are ridiculously high compared with interest rates and they, like their customers, are worried about the future. Why not spend earnings on mergers, acquisitions, share buybacks and dividends? So, enjoy the sounds of those fat cheques hitting the doormat over the next few months, they may not be quite as high in years to come.

 Here is a list of the top 10 across the state. The highest concentration is in Paralowie, a suburb in the north of Adelaide, South Australia. It is predominantly a residential suburb. Many of the properties are valued in the range of 250-350k. We have this classified in our outer suburban zone, and the households are predominately battling urban. Next is
 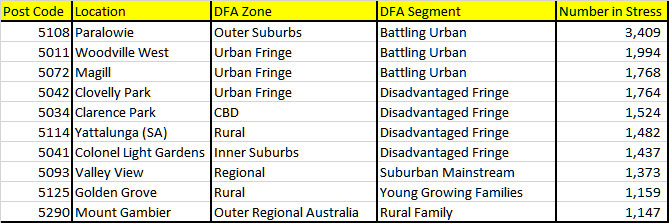 Next time we look at VIC.

 In a nutshell, monetary policy remains relevant, and given the current economic indicators, there appears scope for rate rises later this year, possibly as soon as September. Her comments on how rate adjustments have been simulated are worth reading. It also means that we may see some falls in asset prices as the rises bite, across stocks and property.
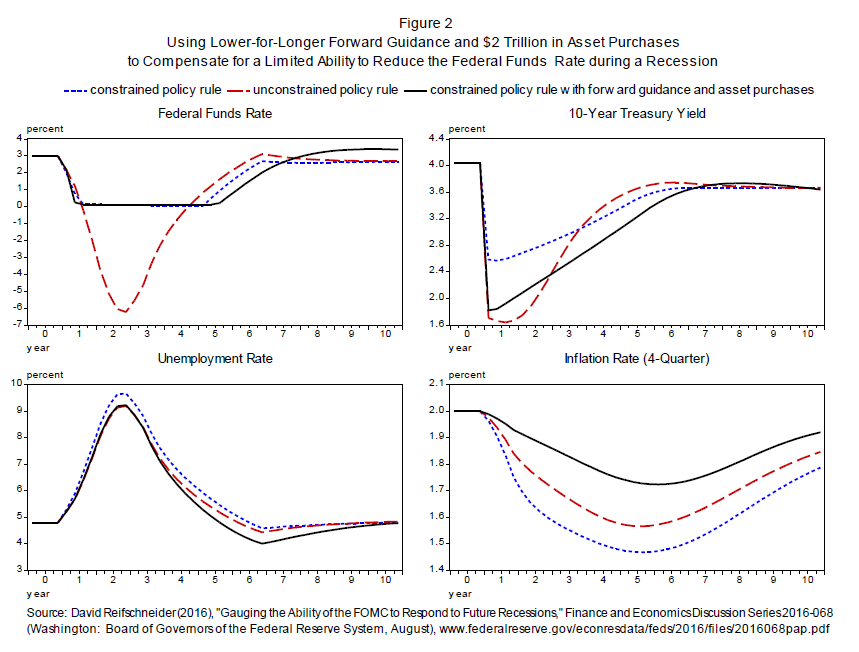
 They aspire to become Australia’s leading non-bank financial services company by 2020 through four core activities.
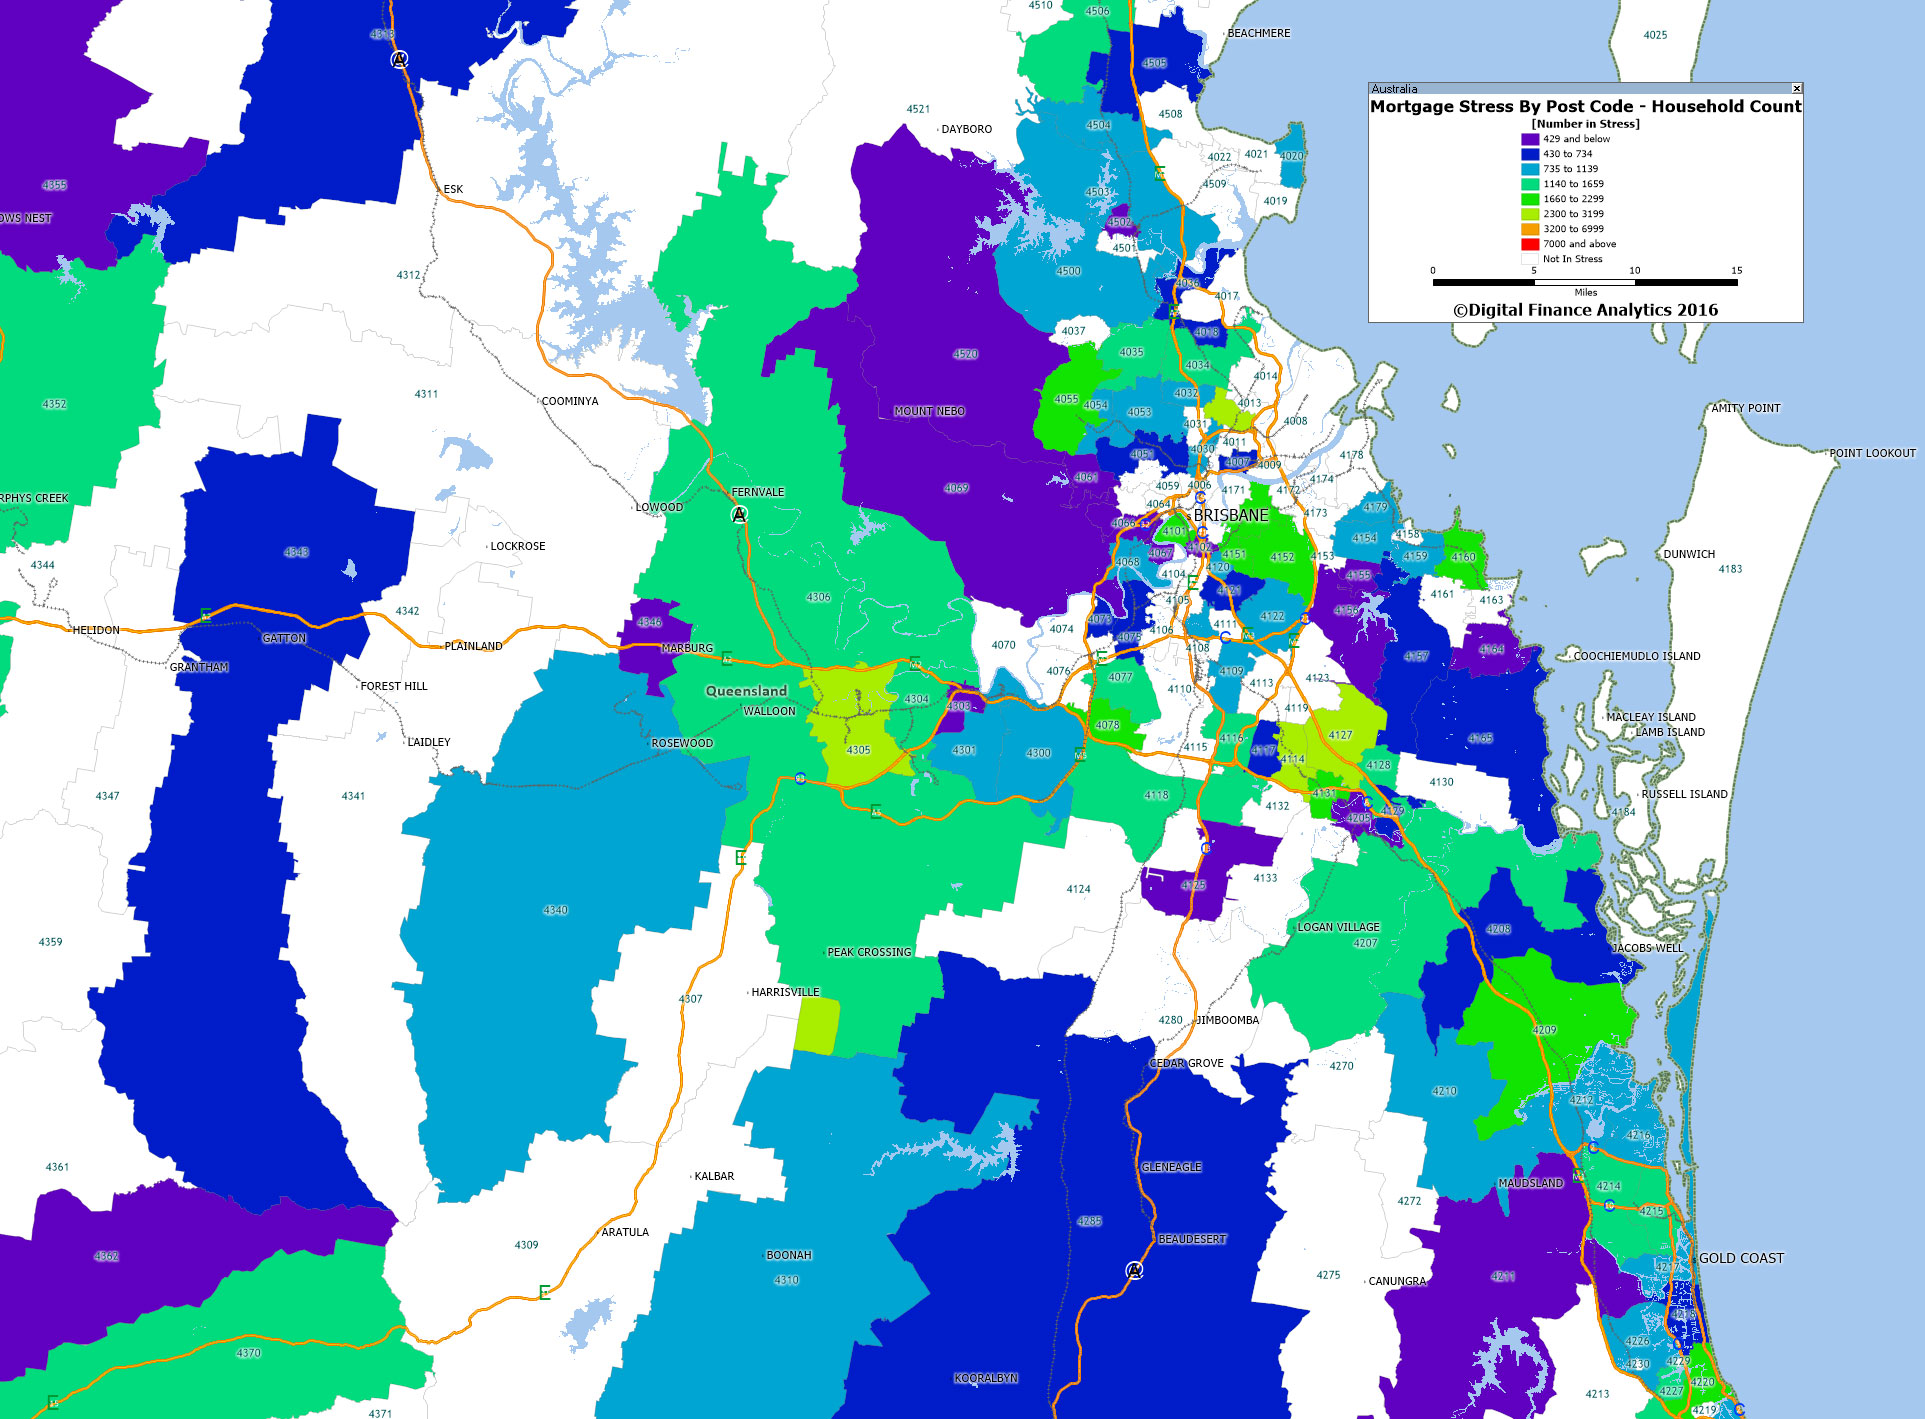 Here is a list of the top 10 across QLD. Depending on the location, the predominate segment varies quite considerably. Harristown, 4350 a suburb of Toowoomba is located to the southwest of the city centre and has the highest count of stressed households across Australia.