Wells Fargo Bank fined $100 million for widespread unlawful sales practices

According to the US Consumer Finance Protection Bureau (CEPB), hundreds of thousands of accounts secretly created by Wells Fargo Bank employees has led to an historic $100 million fine.

Complainy

Today we fined Wells Fargo Bank $100 million for widespread unlawful sales practices. The Bank’s employees secretly opened accounts and shifted funds from consumers’ existing accounts into these new accounts without their knowledge or permission to do so, often racking up fees or other charges.

The Bank had compensation programs for its employees that encouraged them to sign up existing clients for deposit accounts, credit cards, debit cards, and online banking. According to today’s enforcement action, thousands of Wells Fargo employees illegally enrolled consumers in these products and services without their knowledge or consent in order to obtain financial compensation for meeting sales targets.

Bank employees temporarily funded newly-opened accounts by transferring funds from consumers’ existing accounts in order to obtain financial compensation for meeting sales targets. These illegal sales practices date back at least five years and include using consumer names and personal information to create hundreds of thousands of unauthorized deposit and credit card accounts.

The law prohibits these types of unfair and abusive practices.

Violations covered in today’s CFPB order include:

  • Opening deposit accounts and transferring funds without authorization, sometimes resulting in insufficient funds fees.
  • Applying for credit-card accounts without consumers’ knowledge or consent, leading to annual fees, as well as associated finance or interest charges and other late fees for some consumers.
  • Issuing and activating debit cards, going so far as to create PINs, without consent.
  • Creating phony email addresses to enroll consumers in online-banking services.

 Enforcement Action

Under the Dodd-Frank Wall Street Reform and Consumer Protection Act, we have the authority to take action against institutions that violate consumer financial laws. Today’s order goes back to Jan. 1, 2011. Among the things the CFPB’s order requires of Wells Fargo:

  • Pay full refunds to consumers.
  • Ensure proper sales practices.
  • Pay a $100 million fine.

Today’s penalty is the largest we have imposed. Other offices or agencies are also taking actions requiring Wells Fargo to pay an additional $85 million in penalties.

In a discussion on the Knoweldge@Wharton site, they highlight this may not be a one off. The “cross sell” business model underpinning banking is to blame.

More Banks May Be Involved: “It’s not just Wells Fargo,” says Cook. “Fees are a critical part of the profit model for banks in the U.S.” Conti-Brown agrees, and says the practice of cross-selling brings in the fee income that banks badly want. “Cross-selling is one of the reasons Wells Fargo is said to be so successful,” he says of the bank, which along with its parent of the same name, controls some $1.9 trillion in assets. “The [bank’s] incentive structure is flawed,” he says, explaining that deviant practices could occur if top management ties employee rewards to signing up existing customers to more products and services.

The New Regulatory Framework for Surcharging of Card Payments

“Where consumers see a card surcharge, they should check to see what non-surcharged methods of payment are available. Before paying a surcharge, they should think about whether any benefits from using that payment method outweigh the cost of the surcharge; if not they should consider switching to an alternative payment method. This will not only save them money, it will help keep costs down for businesses and will put pressure on card schemes to keep their charges low”. This was Tony Richards, Head of Payments Policy Department RBA, conclusion when he  spoke at the 26th Annual Credit Law Conference and discussed the revised card payment surcharging regime.

In his speech he started by looking at data on average merchant service fees (or MSFs) show that there are very large differences in the cost of different card systems for merchants. These costs ranged from an average of just 0.14 per cent of transaction value for eftpos in the June quarter to about 2 per cent of transaction value for Diners Club. For MasterCard and Visa transactions, the average cost to merchants of debit cards was 0.55 per cent of transaction value, while the average cost of credit card transactions was 0.81 per cent. The average cost of American Express cards was 1.66 per cent of transaction value.

But these averages mask significant variation across different merchants. Many merchants pay up to 1–1½ per cent on average for MasterCard and Visa credit card transactions. And it is not unusual for merchants to pay 2–3 per cent to receive an American Express card payment.
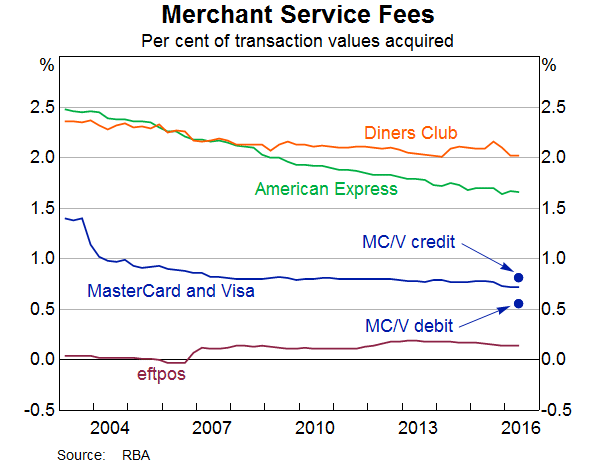
Graph 1: Merchant Service Fees

Then he discussed five key elements of the new framework contained in the Bank’s new surcharging standard and the Government’s amendments to the Competition and Consumer Act.

First, the new framework preserves the right of merchants to surcharge for more expensive cards, but it does not require them to do so. Under the framework, a merchant that decides to surcharge a particular type of card may not surcharge above their average cost of acceptance for that card type.

For example, if on average it costs a merchant 1 per cent of the value of a transaction to receive a Visa credit card payment, the merchant may apply a surcharge of up to 1 per cent for that type of card. The merchant would not, however, be able to apply the same 1 per cent surcharge if the customer chose instead to pay with a debit card that was less costly to the merchant.

Second, the definition of card acceptance costs that can be included in a card surcharge has been narrowed. Acceptable costs will be limited to fees paid to the merchant’s card acquirer (or other payments facilitator) and a limited number of other documented costs paid to third parties for services directly related to accepting the particular type of card. A merchant’s internal costs cannot be included in a surcharge.

Third, a merchant that wishes to surcharge will typically have to do so in percentage terms rather than as a fixed-dollar amount. In the airline industry, this means that surcharges on lower-value airfares have been reduced significantly.

Fourth, the Government has given the ACCC investigation and enforcement powers over cases of possible excessive surcharging.

The Bank’s standard and the ACCC’s enforcement powers apply to payment surcharges in six card systems that have been designated by the Reserve Bank – eftpos, the MasterCard debit and credit systems, Visa’s debit and credit systems, and the American Express companion card system. However, Reserve Bank staff have been in discussions with other card systems that have not been designated and we expect that those systems will all be including conditions in their merchant agreements that are similar to the limits on surcharges under the Bank’s standard. This will mean that merchants that wish to surcharge on payments in these other systems will be contractually bound to similar surcharging caps to those that apply to the regulated systems.

Fifth, surcharging in the taxi industry – which is subject to significant regulation in many other aspects – will remain the responsibility of state taxi regulators. Until recently, surcharges of 10 per cent were typical in that industry. However, authorities in five of the eight states and territories have now taken decisions to limit surcharges to no more than 5 per cent. As new payment methods and technologies emerge, the Bank expects that it will be appropriate for caps on surcharges to be reduced below 5 per cent. The Government and the Bank will continue to monitor developments in the taxi industry with a view to assessing whether further measures are appropriate.

The first stage of implementation of the surcharging reforms took effect on 1 September and covers surcharging of card payments by large merchants. Merchants are defined as large if they meet certain tests in terms of their consolidated turnover, balance-sheet size or number of employees. The framework will take effect for other, smaller merchants in September 2017.

There are a few reasons for the delayed implementation for smaller merchants. Most importantly, these merchants are less likely to have a detailed understanding of their payment costs. Since the new framework involves enforcement by the ACCC, the Bank considered it important to ensure that such merchants have simple, easy-to-understand monthly and annual statements that show their average payment costs for each of the card systems subject to the Bank’s standard. Accordingly, as part of the new regulatory framework, acquirers and other payment providers must provide merchants with such statements by mid 2017. All merchants will be required to comply with the new surcharging framework from September 2017 and ACCC enforcement will apply also to smaller merchants from that point.

Given the new framework has only been effective for two weeks, it is too early to be definitive about how the new surcharging regime applying to large merchants has affected the surcharging behaviour of those merchants. However, based on some corporate announcements and an initial survey of some websites, I think it is possible to make six initial observations.

First, and most prominently, the major domestic airlines have moved away from fixed-dollar surcharges to percentage-based surcharging. This will result in a very significant reduction in surcharges payable on lower-value airfares. The two full-service airlines have introduced surcharges for on-line payments of 1.3 per cent for credit cards and 0.6 per cent for debit cards. A passenger wishing to pay for a $100 domestic airfare by card will now pay a surcharge of $1.30 or 60 cents, as opposed to a surcharge of up to $7-8 previously. Surcharges on some high-value airfares may rise with the shift to percentage-based surcharges. However, the airlines have implemented caps on surcharges of $11 for domestic fares and $70 for international fares, indicating that they continue to prefer to not pass on their full payment costs on purchases of more expensive tickets.

Second, there does not appear to have been any increase in the prevalence of surcharging. It remains the case that companies that face relatively low merchant service fees are tending not to surcharge, while those businesses which receive a high proportion of expensive cards are more likely to surcharge.

Third, the surcharge rates for credit cards that have been announced show significant variation, which is consistent with other evidence that there is a lot of variation in the merchant service fees faced by different businesses. In the case of the Qantas group, for example, Qantas is charging a credit card surcharge of 1.3 per cent while Jetstar – which presumably receives fewer high-cost cards – is charging a surcharge of 1.06 per cent.

Fourth, as required by the Australian Consumer Law, merchants that have announced changes to their surcharges are continuing to offer non-surcharged means of payment. In the face-to-face environment, this typically includes cash, eftpos and sometimes MasterCard and Visa debit cards. In the on-line environment, it typically includes payments via BPAY, POLi or direct debit, which are typically low-cost for merchants.

Fifth, while there are still many instances of ‘blended’ credit card surcharges, there are some early signs of greater discrimination in surcharges. Blending refers to the practice of charging the same surcharge across a number of systems regardless of their cost – say across the MasterCard, Visa and American Express credit systems.

The new framework allows merchants to set the same surcharge for a number of different payment systems, provided that the surcharge is no greater than the average cost of acceptance of the lowest-cost of those systems. For example, if a merchant accepts cards from two credit card systems, which have average costs of acceptance of 1 per cent and 1.5 per cent, it can set separate surcharges of up to 1 per cent and 1.5 per cent, respectively. If it wishes to set a single surcharge, it cannot average the costs and set a 1.25 per cent surcharge for both systems, since it would be surcharging one of those systems excessively. In this example, the maximum common surcharge that could be charged would be 1 per cent.

While I think we are already seeing some reduction in the practice of blended surcharging, it is likely that we will see this trend continue from mid 2017 when new rules on the interchange fees exchanged between banks for card transactions take effect. Without wishing to go into details, the Bank will for the first time be placing a cap on the maximum interchange fee that can be paid on any card transaction. This will significantly reduce the cost of MasterCard and Visa payments for those merchants which currently receive a high proportion of high-interchange cards.

The sixth change has been in the event ticketing industry, where it was previously very difficult to avoid a card surcharge in the on-line environment. Given this, the ACCC had already required the major ticketing companies to show their surcharges as a separate component within their headline, up-front pricing. Effective 1 September, the two major companies have now removed their card surcharges and are now quoting a simple, single price for all payment methods.


Managed Accounts Market Growing Fast

Further evidence of complexities in the investment sector in Australia are demonstrated by the latest estimates from  The Institute of Managed Account Professionals (IMAP) which uses data from their 2016 survey. This shows that based on responses from 29 out of 37 organisations surveyed, total funds under management/administration (FUM) held in managed accounts now exceeds $30.874 billion.

The results show that managed accounts are a very significant part of the retail financial services market – already equivalent to approximately 5% of all the investment assets held on platforms.

managed-accounts-aug-2016In February 2015, IMAP had surveyed the main providers and estimated that the market size exceeded $13 billion in total FUM. Morgan Stanley recently predicted that Managed Accounts would exceed $60 billion by 2020. So there has been significant growth.

Here is the list of entities who responded. There is an interesting  mix of integrated financial services players, and several stand alone organisations and start-ups. Many have fingers in multiple pies!

managed-accounts-aug-2016-listThe results show that managed accounts are a very significant part of the retail financial services market – already equivalent to approximately 5% of all the investment assets held on platforms.

IMAP says the inflow to managed accounts services has been strong through 2015-16 and is likely to continue to grow strongly. The growth since the 2015 survey has been largely in platform based services rather than in “client own name” services, showing the extent to which financial planners and advisers have now adopted managed accounts as a way of delivering their overall advice service.
Over 85% of the FUM measured in this survey would also be counted in a survey of the retail IDPS and Superannuation platforms. Also, this 2016 result is not directly comparable to the total FUM amount measured in the 2015 survey because the survey process this year continues to add new participants. The results also show significant growth for those who have participated in both surveys. Managed Accounts are provided in a variety in legal structures and several organisations can be involved in a single service. This means that there is a risk of overlap between the returns from several organisations, so the numbers are at best indicative.

ASIC says MDA services involve a range of financial products and financial services, such as offering and trading in financial products, operating a custodial and depository service, and giving personal advice. Because of the individualised nature of the range of financial services involved, they will regulate persons contracting with retail clients to provide MDA services as providers of financial services rather than issuers of a financial product. Managed accounts are increasingly considered a mainstream investment management solution and many managed account solutions are made available using a MDA approach.

However, advisers operating a managed discretionary account (MDA) service are expecting new tighter regulations soon.

A large number of industry participants provide MDA services to retail clients using a no action letter issued back in 2004. The no action letter came about because the industry argued that unlike “full service” MDAs, many advisers primarily used discretion to rebalance managed fund portfolios via a regulated platform which took care of administration, custody and reporting. It successfully argued that it wasn’t clear whether they needed to be licensed or not. If the no action letter is removed, Limited MDA arrangements, particularly those with portfolios across a range of instruments, will probably need to gain specific MDA authorisation on their licence to continue their current approach.

ASIC has also flagged plans to increase the capital requirements for MDA
operators so that net tangible assets (NTA) of 0.5 per cent of funds under administration (FUA) up to $5 million will need to be maintained  (assuming custody is outsourced).

CBA pays $180,000 in penalties and will write off $2.5 million in loan balances

ASIC says Commonwealth Bank of Australia (CBA) has paid four infringement notices totalling $180,000 in relation to breaches of responsible lending laws when providing personal overdraft facilities.

CBA reported this matter to ASIC following an ASIC surveillance. CBA conducted an internal review which identified a programming error in the automated serviceability calculator used to assess certain applications for personal overdrafts.

Complaint-TTy

As a result of the error, between July 2011 and September 2015, CBA failed to take into consideration the declared housing and living expenses of some consumers.

Instead, CBA’s serviceability calculator substituted $0 housing expenses, and living expenses based on a benchmark which in some instances was substantially less than the living expenses declared by the consumer. As a result, this led to an over-estimation of the consumer’s capacity to service the overdraft facility.

CBA informed ASIC that between July 2011 and September 2015, as a result of the error, CBA approved:

  • 9,577 consumers for overdrafts which would have otherwise been declined; and
  • 1,152 consumers for higher overdraft limits than would have otherwise been provided.

Some consumers were approved for a personal overdraft, or an increased limit on their personal overdraft, even though their declared expenses were greater than their declared income.

ASIC was concerned that this conduct breached responsible lending laws and that affected consumers would have been unable to comply, or could only comply with substantial hardship, with their obligation to repay their personal overdraft on demand.

CBA has informed ASIC that it will write off a total of approximately $2.5 million in personal overdraft balances.

ASIC Deputy Chairman Peter Kell said, ‘Credit licensees should continuously monitor their internal processes to ensure compliance with the law. This is especially the case with automated decision-making systems where ongoing monitoring is needed to ensure that information is correctly inputted into systems.’

Background

The responsible lending obligations that prohibit lenders from entering into credit contracts which are unsuitable for the consumer are found in the National Consumer Credit Protection Act 2009 (Cth). The laws aim to ensure that credit contracts are not unsuitable for consumers (see s133(1)), and consumers are likely able to afford the credit contract (see s133(2)).

ASIC issued four infringement notices in August 2016 totalling $180,000 for the breaches outlined above.

CBA self-reported the breaches to ASIC, and has co-operated with ASIC’s investigation.

The payment of an infringement notice is not an admission of guilt in respect of the alleged contravention. ASIC can issue an infringement notice where it has reasonable grounds to believe a person has committed particular contraventions of the National Credit Act.

ASIC on mortgage brokers’ interest only loans

ASIC says the volume of interest only loan approvals rose significantly in the June 2016 quarter. But Australia’s home loans industry has improved its performance over the past year, adopting better ‘responsible lending’ practices, though there is still room for improvement.

asic-io

ASIC has released its report (REP 493) ‘Review of interest-only home loans: Mortgage brokers’ inquiries into consumers’ requirements and objectives’ on the responsible lending practices of 11 large mortgage brokers with a particular focus on how they inquire into and record consumers’ requirements and objectives.

It also examined how the changes implemented by lenders in response to the findings from ASIC’s report into interest-only home loans from 12 months ago last year (refer: Report 445) have flowed through to mortgage brokers.

Since the release of Report 445 in August 2015,

  • the percentage of new home loans approved by lenders which are interest-only has decreased by 12%; and
  • the amount that can be borrowed by an individual consumer through an interest-only home loan has decreased, as lenders have adjusted their assessment of consumers’ ability to repay, in line with ASIC’s recommendation in Report 445.

Information provided by the mortgage brokers showed that for the six months from July 2015 to December 2015,

  • the number of new interest-only home loans fell by 16.3%, with total value of these loans reducing by 15.6%; and
  • the percentage of interest-only loans with a term greater than five years reduced by more than half, from 11.2% to 5.1%.

Almost 80% of applications reviewed included a statement summarising how the interest-only feature specifically met the consumer’s requirements and objectives. This compared favourably with Report 445’s finding that more than 30% of applications reviewed showed no evidence the lender had considered whether the interest-only loan met the consumer’s requirements.

‘It is vital that mortgage brokers understand consumers’ requirements and objectives to ensure they are not placed in unsuitable credit contracts,’ said ASIC deputy chairman Peter Kell.

‘ASIC is pleased that our concerns about interest-only loans and responsible lending are being acted on by the home lending industry, but there is still room for improvement.’

ASIC identified practices that place brokers at increased risk of non-compliance with their responsible lending obligations, and identified opportunities for brokers to improve their practices. Key compliance risks identified included:

  • Policies and procedures—Mortgage broker policies and procedures provided only general information, rather than tailored information on specific products and loan features that may impose increased financial obligations or restrict repayment flexibility (such as interest-only home loans);
  • Recording of inquiries—Record keeping was inconsistent and in some cases records were fragmented and incomplete;
  • Explaining the loan choice—More than 20% of applications reviewed did not include a statement explaining how the interest-only feature of the loan specifically met the consumer’s underlying requirements and objectives. The level of detail in these statements varied considerably and in some cases, where an interest-only loan was specifically sought by a consumer (including where this option was recommended by a third party, such as an accountant), the reason for this was not clear;
  • Consumer understanding of risks and costs—In some cases, where the potential benefit of the interest-only loan depended on the consumer taking specific action (for example, allocating additional funds to higher interest debt), it was unclear whether the consumer understood the potential risks/additional costs if the specific action was not taken.

The report details steps that mortgage brokers should take to improve their current practices, including:

  • Ensuring they understand the consumer’s underlying objectives for requesting specific loan products and features;
  • Recording concise summaries of consumers’ requirements and objectives and the reason why a particular product, features and lender was chosen;
  • Providing a statement summarising the broker’s understanding of the consumer’s requirements and objectives, which could also include the reason a particular loan is suggested, for the consumer to confirm before obtaining a loan.
  • Where the potential benefits of a loan feature might require the consumer to undertake specific behaviour, ensuring consumers were aware of the action they needed to take to obtain the potential benefit, as well as the potential costs should this action not be taken.

So Where Are DSR’s Highest?

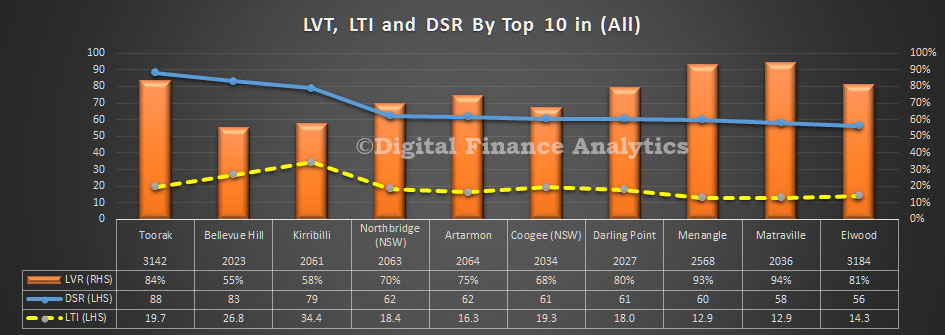
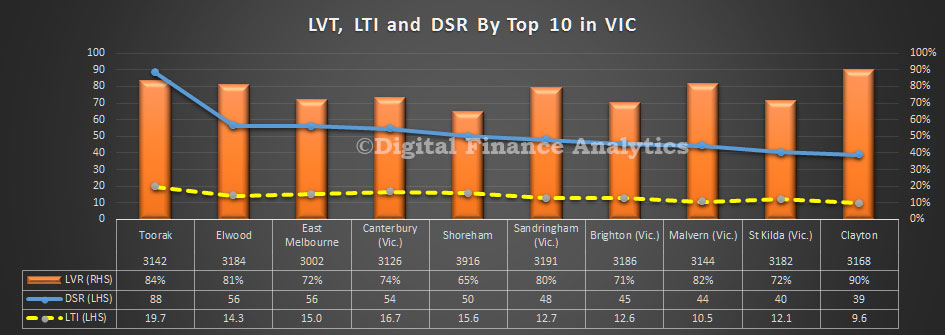
As we continue our analysis of household mortgage debt, and having described the ratios we are using (Loan to Value (LVR), Loan to Income (LTI) and Debt Servicing Ratio (DSR)) we can drill into the more specific data slices. Today we look across the top ten locations by DSR.

complex-sept-2016We see at once that some of the highest DSR ratios are found in some of the more affluent suburbs – such as Torak (VIC) and the lower north shore in NSW. In these locations, home prices are very high, and as a result households have extended their borrowings – with high LVRs, DSRs and DTIs. This suggests that those will more ability to borrow and service large mortgages are most in debt.

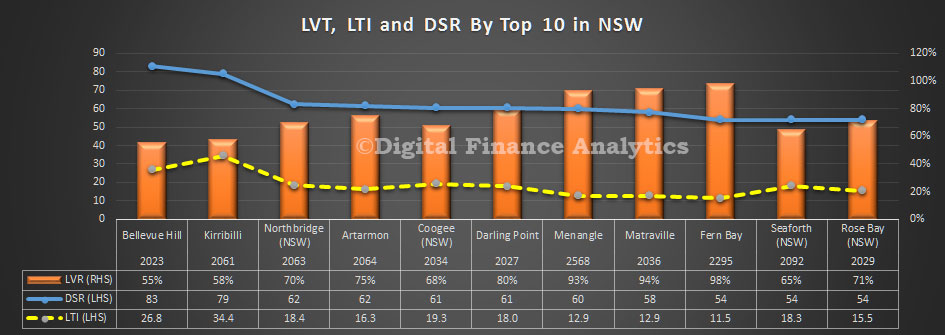
We can then look at each state in more detail. For example, here is NSW.

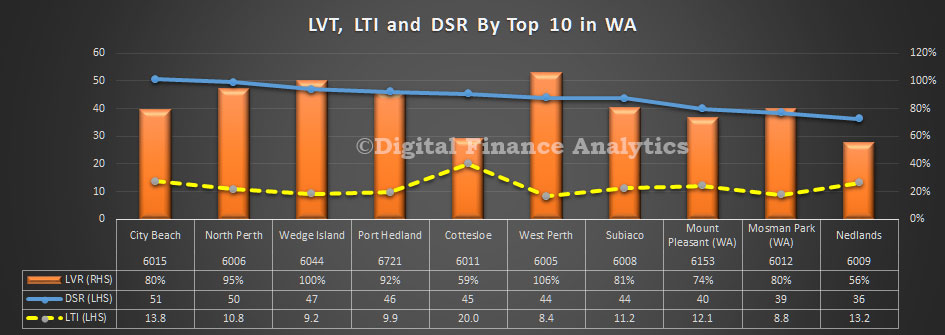
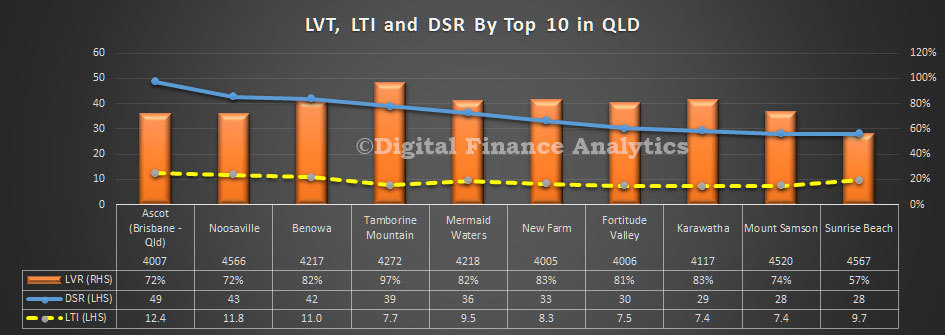
complex-sept-2016-nswAs we go down the list we begin to see a more mixed set of locations figuring in the top 10, though generally still closer to the CBD. We see somewhat similar pictures in WA, QLD and VIC.

complex-sept-2016-wa complex-sept-2016-qld complex-sept-2016-vicOf course averages can be misleading, as we see a small number of mortgages well above $1m. We also see a high penetration of interest only loans, and recent refinancing events. Provided interest rates remain low, and incomes are solid, the risks are probably relatively well contained. It would be a different matter if home prices slipped significantly.

As we go into more detail in later posts, we will identify some other factors are creating more risks within the portfolio.

Mortgage arrears increase over June quarter

From Australian Broker.

Mortgage arrears increased across Australia in the June quarter, driven by conditions in regional markets.

Housing-Key

According to Standard & Poor’s Performance Index (SPIN), the global credit rating agency claims that prime Australian residential mortgage-backed securities (RMBS) transactions more than 30 days in arrears increased to 1.19% over the three months to June, up from 1.13%.

Standard & Poor’s’ data shows regional areas have been hit hardest by the increase in arrears. The past eight months have seen arrears in non-metropolitan markets increase from 1.24% to 1.77%, which the rating agency says reflects the greater vulnerability of regional areas to downturns in key industries or employers.

Though arrears increased nationally over the June quarter, Standard & Poor’s believe conditions will likely improve as 2016 rolls on.

“While prime arrears are up year on year, they are still below their peak of 1.69% and decade-long average of 1.25%. Furthermore, arrears generally start to drift lower in the second half of the year so we expect that arrears are likely to remain at these low levels in most parts of the country over the next quarter,” Standard & Poor’s said in a statement.

“The rate cut by the Reserve Bank of Australia in August will also help. Lower wage growth and higher household indebtedness are no doubt creating a degree of mortgage stress for some borrowers but we expect that relatively stable employment conditions and historically low interest rates will enable the majority of borrowers underlying RMBS transactions to stay on  top of their mortgage repayments,” the statement said.

On a state-by-state basis, the data shows arrears increased in all states and territories over the June quarter, except for New South Wales where they remained unchanged.

Over the three-month period, Western Australia was home to the highest level of arrears at 1.95%, followed by Tasmania (1.62%) and South Australia (1.56%). The continued slowdown of the mining boom is identified as the reason behind conditions in Western Australia, while high unemployment is contributing to conditions in South Australia and Tasmania.

Five of Australia’s 10 worst-performing postcodes in terms of arrears were in Queensland in the June quarter, up from three in the March quarter.

Westpac makes $16.5m investment in Fintech uno

Fintch “uno” has received a $16.5m strategic investment from Westpac.   uno is a digital mortgage service offering households tools to search, compare and settle a better home loan for themselves online, including realtime chat

uno allows consumers to access real-time home loan rates based on their personal situation – not just advertised rates. These next generation tools– that in the past only a traditional mortgage broker would have access to – allow them to calculate their borrowing power across lenders, save and share their data with someone else getting the home loan, and select the option that best suits their needs. The entire system is built on the premise that if people had the right knowledge and access to information, they could do better for themselves.

The entire uno loan application process can be done from a desktop, tablet and smartphone, and is supported by a team of experts who can help with real-time advice, when a consumer wants it.

So it is an alternative to a mortgage broker and so far they say more than $400m loans have been search for via the platform. uno’s home loan experts that provide advice do not personally receive sales commissions. The company says they take out all of the filters and pre-decisions that traditional brokers apply before making a recommendation to a home buyer and instead offers full transparency, putting decision making power in the hands of the consumer.

productshot-mobileThe company says: uno is redefining the way property finance is secured by using a ‘technology plus people’ approach to provide the consumer the power to get a home loan that gives them a better deal – from both major and smaller lenders via any digital device with real-time advice and support. Driven by next generation tools and calculators with the capability to provide real-time home loan rates and borrowing power based on a consumer’s personal situation, uno has reimagined how Australians can buy or refinance a home.

The successful launch of unohomeloans.com.au in May this year has attracted a number of high profile investors, such as Westpac, that have discovered the service’s potential to redefine how Australians buy or refinance their home.

The popularity of the unohomeloans.com.au service has grown rapidly as customers have discovered the benefits of having greater power in the home loan search process, and direct access to the technology and information that traditional mortgage brokers use. uno’s offering also includes full-service support and advice for customers via chat, phone and video, helping customers search, compare and settle in the one place.

Founder and CEO of uno, Vincent Turner, said in the three months since launch, millions of dollars’ worth of loans had been settled as customers reviewed their loan position with uno’s service team to find a better deal in today’s low interest rate environment.

Mr Turner said: “We’ve grown to 34 employees to meet the service demands of thousands of registered customers who have used the platform to compare more than $400 million worth of mortgages. With the support of our investors we’ve worked hard to test and enhance the customer experience, as well as finesse the functionality of our original platform to include options such as new calculators and video chat.”

Chief Strategy Officer at Westpac, Gary Thursby, said: “uno’s success has been impressive and we’re seeing its potential to become a serious player in the home loan market. Westpac has been involved since the concept phase, and today we’re pleased to announce we will increase our involvement in uno as a strategic investor. Westpac is proud of its reputation as a supporter of early stage fintech companies like uno that drive digital innovation and benefit Australians.”

Mr Turner added: “We knew from the start that by creating a platform with direct visibility to lenders’ products and pricing, we could give Australians greater control over the home loan process and the confidence to achieve the best home loan deal. We also challenged the status quo by giving customers the ability to search, compare and settle a home loan in the one place, which has proven extremely useful for busy professionals. “With the healthy investment we need to drive the company forward, we are excited to keep expanding and help more people get a better home loan.”

How Best To Look At Mortgage Serviceability

There are at least three key ratios we consider when examining households and their mortgage commitments.  Today we discuses these in the light of data from our surveys, which follows on from yesterdays post.

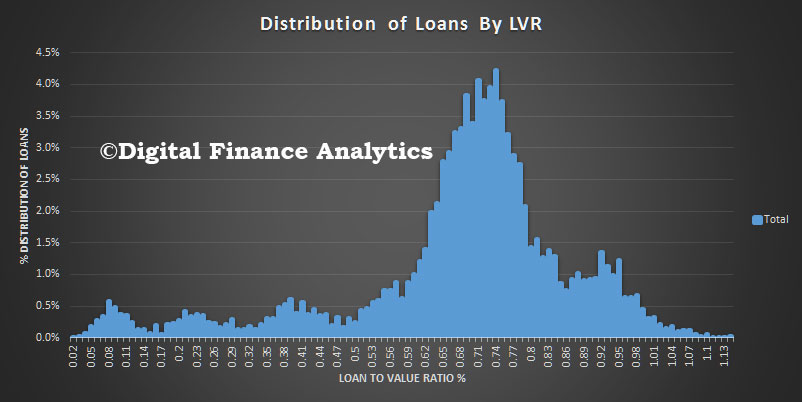
Loan to Value (LVR) calculations tell us about the proportion of a property owner by the home owner, versus the bank.

lvr-summaryHigher loan to value ratios are a sign of potential financial instability, because if prices were to fall the borrower could be left with a mortgage bigger than the value of the property. In Australia, LVR’s higher than 80% will normally require extra lender mortgage insurance, and this in turn has changed the shape of the market. The average marked to market LVR is 68%. Many lenders rely on the LVR at loan inception and use this data in their risk models.

Of course in Australia, home prices have been rising strongly in some states, though we have seen some falls in value in WA recently. Some regulators have imposed specific loan to value limits on lenders, for example the Reserve Bank of New Zealand.  However, LVR ratios have limitations, because as the value of the property rises, the LVR falls. In a strongly rising market, this may mask issues within the portfolio. Recently the proportion of high LVR loans being written has been falling as regulators turn up the heat. However APRA only reports scanty aggregated data.

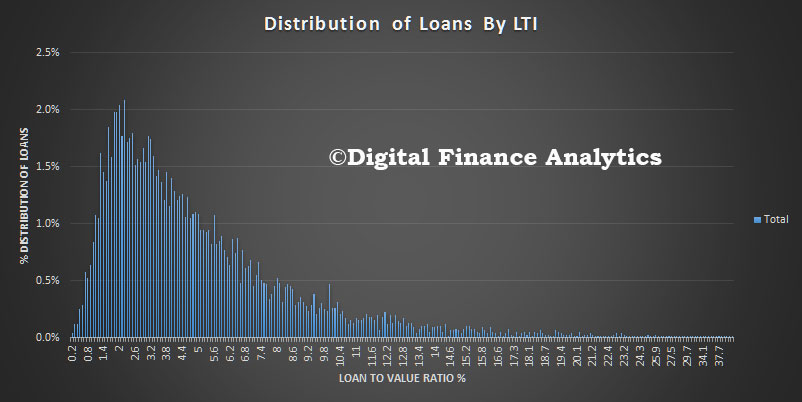
Loan to income (LTI) ratios tell us about the households borrowing footprint. The higher the income ratio, the higher the risk.

lti-summaryOver time the average LTI has risen from around three times income to more than five times income. This illustrates the extra leverage households have been able to create in response to strongly rising prices as lending standards have been relaxed. Some regulators have started to limit high LTI loans. For example the Bank of England.  LTI is sensitive to rising property prices and larger mortgages as well as static or falling incomes. There is no regular LTI reporting in Australia.

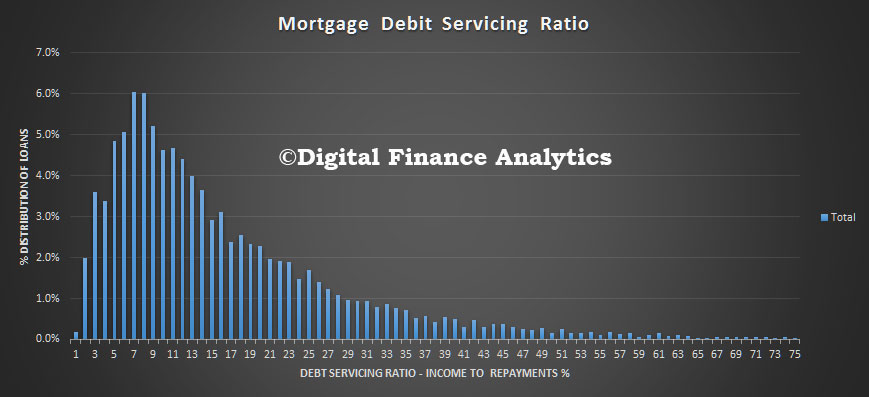
The third is the debt servicing ratio (DSR). This is the ratio between gross household income and the amount paid on the mortgage. The DSR is defined as the ratio of interest payments plus amortisations to income. As such, the DSR provides a flow-to-flow comparison – the flow of debt service payments divided by the flow of income. We think the DSR is an important lens to look at households debt footprint, but the ratio is highly sensitive to interest rates because as interest rates fall, the ratio improves. Current DSR ratios are often seen as reasonable because of the current ultra low rates, but of course that tells us nothing about the impact of rising rates later. The average DSR is 16.8, but there is a very wide spread. In 2015 the BIS published some relative benchmarks and found that Australia was at around 16 one of the highest in the developed world. DSR is the recommended macroprudential measure. There is no regular DSR reporting in Australia.

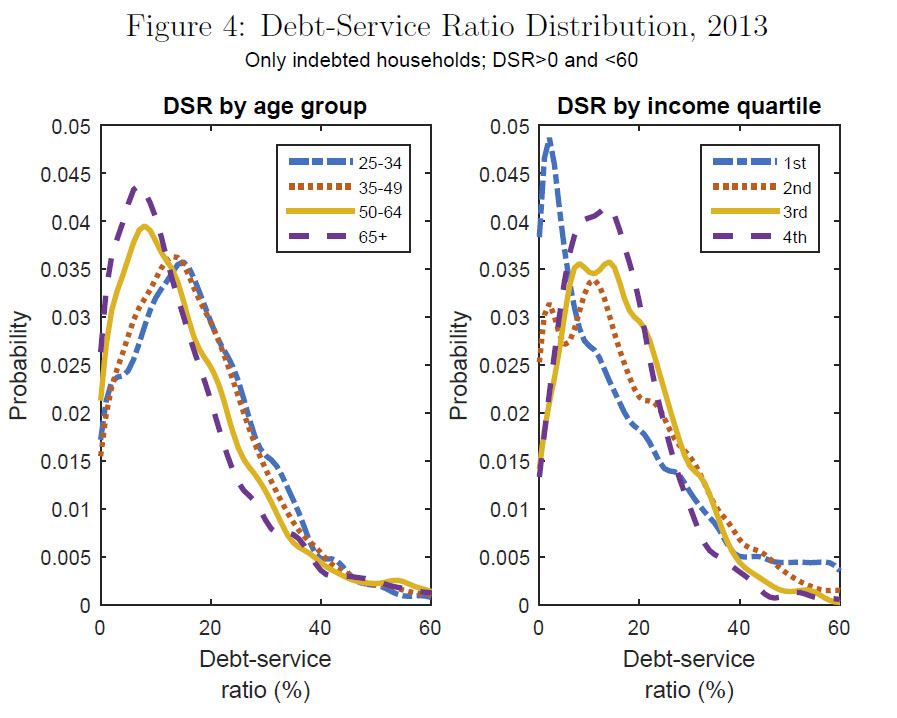
dsr The Bank of Canada has recently been looking at DSR. Here is an example of their findings in their home market.

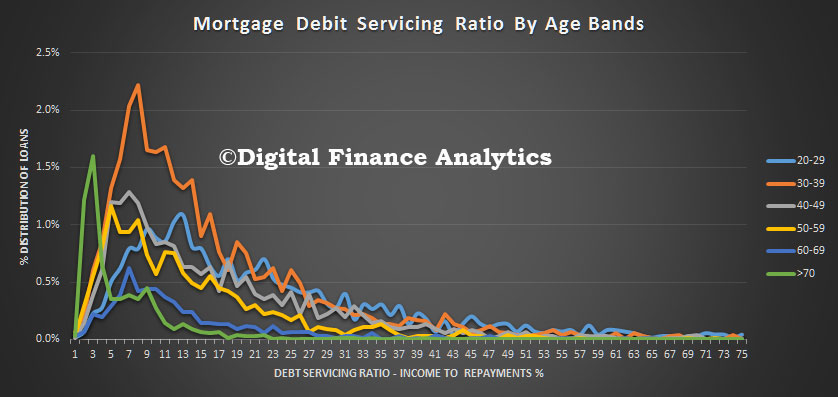
canadian-dsr-summaryWe can look at age and income distribution in Australia.We see that a significant proportion of younger households have a DSR in excess of 20. Older households have on average lower DSR’s.

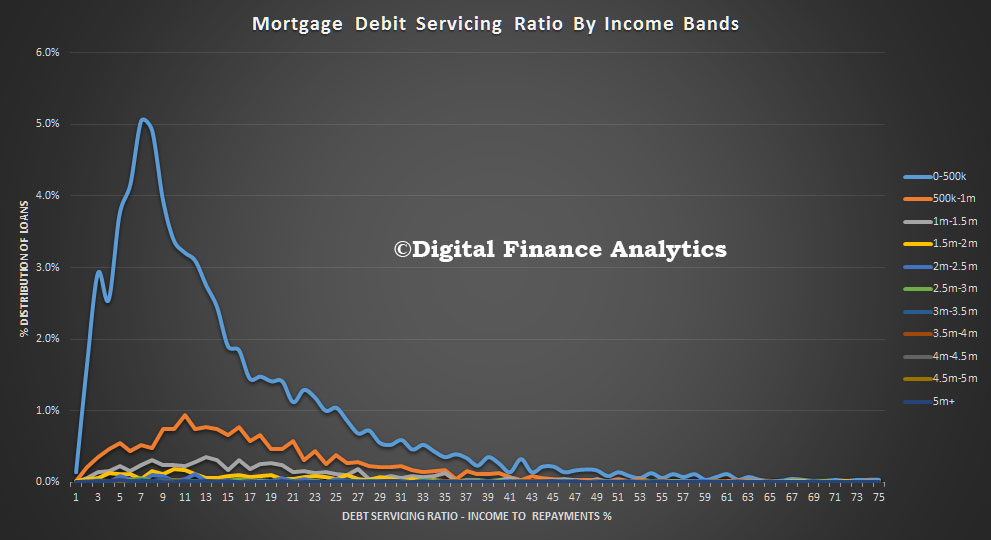
dsr-ageLike Canada, lower income households tend to have higher DSR’s.

dsr-incomeOne important point to consider is whether the ratio should take account of other repayments – such as credit cards – or other living expenses. Most DSR calculations do not factor in other elements, although thanks to regulatory pressure, lenders are now more conservative in their underwriting criteria when it comes to assessing true income.

Next time we will dive further into these metrics by looking across our household segments. The results are surprising.


Wither The Bond Rally?

Speculation by market commentators that the 35-year bond rally is finally coming to an end is nothing new, writes Nikko Asset Management’s Roger Bridges in InvestorDaily today.

Given that the yields on these securities are now negative, it is hard to believe that they can continue to drive global bond yields much lower.

Unless, for some reason, US Treasuries begin to narrow from current spread levels, it is hard to be too bullish on bonds.

However, I don’t believe that means we should necessarily be bond bears. Even if the great bond rally is drawing to a close, that doesn’t mean that it is now going to reverse violently.

It is more likely that we will see a period when bonds trade within a range, with any rally reversing fairly quickly and any sell-off likely to meet the same fate.

Potential causes of a bond sell-off

In my view, it is unlikely that a sell-off will emanate from US Treasury movements as it did in 2008.

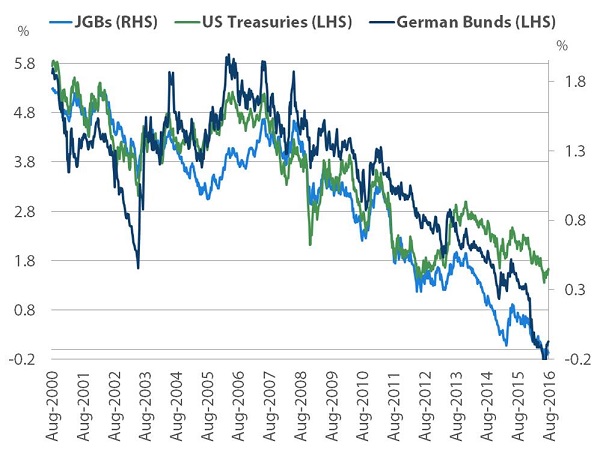
JGBs and Bunds are more likely to be the catalyst for higher global bond yields, as they were in 2003 (JGBs) and 2014 (German Bunds).

Chart 1: 10-year JGB, Treasury and Bund yields

The 2013 ‘taper tantrum’ saw the sell-off in US Treasuries driving global bond yields.

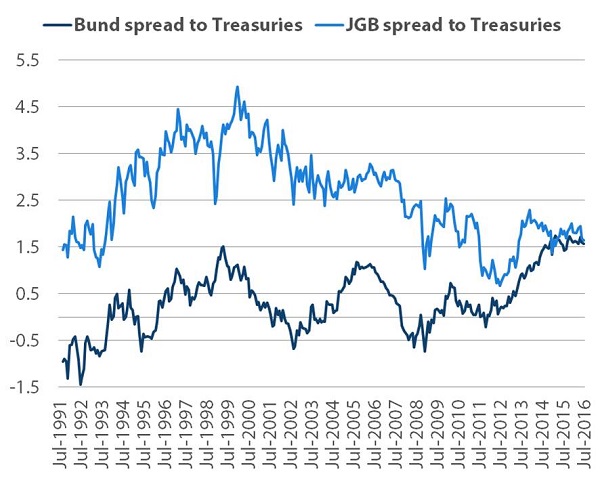
Since then, however, global bond markets (including the US) have been very much dominated by Bund and JGB movements, with their spreads to US Treasuries widening to their current level of around 1.6 per cent for both markets (see chart 2).

Chart 2: Spread of JGB and Bund yields to US Treasuries

This rally in Bunds and JGBs is being driven mainly by the quantitative easing programs of the European Central Bank (ECB) and the Bank of Japan (BoJ).

However, the performance of the bank sector in both those markets also helps to explain bond movements.

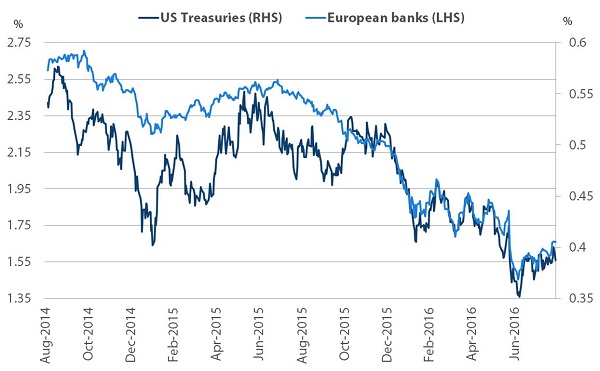
Chart 3 shows that US Treasury yields have been closely correlated to the performance of European banks, particularly in the past year.

Chart 3: Relationship between 10-year US Treasuries and European bank bond yields

In July, we saw a sell-off in JGBs due to market disappointment over the lack of a rate cut from the BoJ.

Since this meant that interest rates weren’t pushed any further into negative territory, Japanese banks outperformed, causing longer-dated JGBs to sell off.

This sell-off was largely contained within the Japanese market and didn’t have much effect on US Treasuries since they were still being supported by the underperformance of European banks.

US Treasuries currently look expensive

Ten-year US Treasuries currently appear quite expensive due to negative interest rates in Germany and Japan and the continuing underperformance of those countries’ banks.

What would be fair value for US 10-year rates? According to the Laubach-Williams model, an estimate for the current neutral level of the Fed funds rate is around 0.18 per cent.

Adding the Federal Reserve’s target of 2 per cent for inflation would give a fair value rate at around 2.2 per cent.

Interestingly, that is in line with the Federal Reserve Bank of New York model for the term 10-year structure of short-term interest rates.

Based on this, the NY Fed’s model sees the current term premium for US 10-year Treasuries at -0.6 per cent.

However, the historical average for the Fed’s favourite measure of inflation is only 1.7 per cent and not 2 per cent, which is not very different from the market’s current pricing for inflation in 5 years’ time at 1.68 per cent.

This back-of-the-envelope calculation puts an upper limit on the current fair value for US Treasuries at between 2 and 2.2 per cent, focusing only on the US and ignoring interest rates prevailing globally.

Bunds and JGBs will be the likely culprits in any sell-off

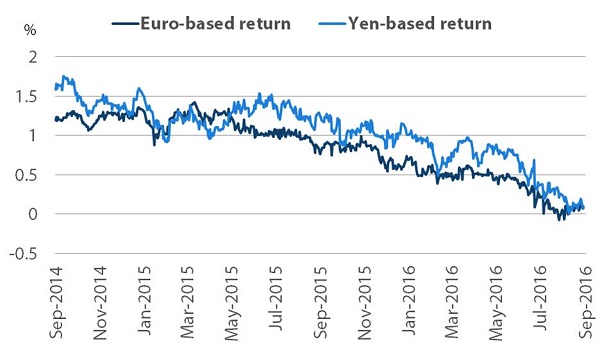
US rates have been fairly range-bound in recent weeks. Hedging costs have increased as a result of the recent rise in 3-month LIBOR for both Euro- and Yen-based investors, which in turn has reduced the hedged return on US 10-year Treasuries for foreign investors (see chart 4).

Chart 4: Return on US Treasuries from 3-month currency hedging for foreign investors

This has resulted from regulatory changes on money market funds which will be implemented in October and so the impact is likely to reverse unless the Fed starts raising interest rates.

The impact on the long end of the US Treasury curve has been minimal, which may suggest that a gradual interest rate tightening by the Federal Reserve may also have limited long-term impacts on that end of the curve.

Over the past three months, the JGB sell-off and the rise in LIBOR rates have had limited effects on US 10-year bond yields.

Since the Federal Reserve is likely to be slow in raising rates, this may indicate that Fed hikes will be tolerated and may in fact provide buying opportunities.

The real risk is that we see both Bunds and JGBs sell off together, reversing the reason for much of the recent bond rally.

The likely cause of such a sell-off would be a reversal of local bank underperformance, which could result from a change in European policy on how non-performing loans are handled or if Japan changes its policy on negative interest rates such that local banks will be less negatively affected.

Perhaps we have seen the end of the bond rally, but a severe reversal is unlikely, in my view. One potential strategic trade in the current environment could be to go long US Treasuries against either JGBs or Bunds.

If the market rallies, then it is likely that this will happen via a US spread narrowing.

A major sell-off is also likely to see spread narrowing as US Treasuries are probably closer to fair value than JGBs or Bunds, the major drivers of the bond market rally in recent years.

Roger Bridges is a global rates and currencies strategist at Nikko Asset Management.