Mortgage arrears go against seasonal trends

From Australian Broker

Credit rating firm Fitch has described an increase in Australian mortgage arrears over the June 2016 quarter as surprising.

Housing-Dice

Released this week by Fitch, the latest Dinkum RMBS Index shows mortgage arrears rose 0.4% to 1.14% over the three months to June. On a year-on-year basis, mortgage arrears are 0.6% higher than they were at June 2015.

According to Fitch, the increase in arrears over the June quarter went against seasonal trends, with arrears that originated in the first three months of the year continuing through the quarter.

“The increase… was mainly in the 90+ days bucket, following the migration of the 30-60 days arrears in 1Q16 into longer-dated arrears,” Fitch said in statement.

“Historically, arrears that materialise in the first quarter are due to seasonal spending and tend to cure themselves in the next quarter. However, recent data indicates households that had financial difficulties in 1Q16 also had them in 2Q16,” the statement said.

While Australia’s unemployment levels are falling, Fitch believes increased levels of underemployment are likely behind the arrears increase.

As of the end of Australia’s unemployment rate sat at 5.6%, while the underemployment rate sat at 8.8%. Underemployed workers are defined as part-time workers who want and are available for more hours of work than they currently have and full-time workers who worked part-time hours during the reference week for economic reasons.

While arrears do appear to be increasing, Fitch said there may be some improvement as the impact of the Reserve Bank of Australia’s August rate cut works its way through the market.

“Monetary policy has not significantly benefitted mortgage performance in 2Q16 and lower mortgage rates only marginally helped 30-60 days arrears,” the Fitch statement said.

“However, the effects may be delayed and households may feel positive outcomes on arrears in 3Q16. The August 2016 rate-cut may also improve 2H16 arrears.”

Fitch expects 90+ days arrears to increase further in Queensland, Western Australia and the Northern Territory as the impact of the mining boom slowdown continues to be felt.

New Governor’s Remarks To Standing Committee

New RBA Governor, Philip Lowe has delivered his opening statement to the House of Representatives Standing Committee on Economics.  He spoke about monetary policy and economic events in Australia and elsewhere. He reiterated that the goal remains for CPI inflation to average between 2 and 3 per cent over time and that GDP is higher than was expected a year ago. He said about three quarters of the mining boom decline is now behind us.

Money-Puzzle-Pic

The Monetary Policy Framework

Earlier this week, the Treasurer and I released an updated Statement on the Conduct of Monetary Policy. These statements – the first of which was released in 1996 – record the common understanding between the Reserve Bank and the Government on key aspects of Australia’s monetary and central banking policy framework. They also set out agreed arrangements that promote the transparency and accountability of the Bank.

Over recent times, there has been quite a lot of public commentary in Australia and elsewhere about monetary policy frameworks. As you would expect, we are always studying the various arguments and have followed the recent debate carefully.

Our view is that a flexible medium-term inflation target remains the right monetary policy framework for Australia. This was reaffirmed in the new Statement on the Conduct of Monetary Policy, which has also been endorsed by the Reserve Bank Board. The goal remains for CPI inflation to average between 2 and 3 per cent over time.

The current framework was introduced in the early 1990s and has served Australia well. It provides the community with a reasonable degree of certainty about how the average level of prices is likely to change over the medium term. This helps people when making decisions about their savings and investments. Low and stable inflation remains an important precondition for strong and sustainable growth in employment and incomes.

It is worth emphasising that ever since the adoption of the current framework, the Reserve Bank has been a proponent of what is known as flexible inflation targeting. We have not seen our job as always keeping inflation tightly in a narrow range. We have not been what some have called ‘inflation nutters’. We have had a more balanced perspective, recognising that some degree of variability in inflation from year to year is both inevitable and appropriate.

In particular, a flexible medium-term target is the best way for us to deliver low and stable inflation in a way that contributes to our other broad responsibilities, including employment and preserving financial stability. We want to ensure that we deliver an average rate of inflation in Australia of between 2 and 3 per cent over time. It is in the public interest that we do this. It is also in the public interest that we pursue this objective in a way that promotes good employment outcomes for the country and preserves financial stability. In this way, we can best contribute to the economic prosperity and welfare of the Australian people as required by the Reserve Bank Act.

Our judgement, then, is that a flexible medium-term inflation target remains the right monetary policy framework for Australia. While there are arguments for other types of arrangements, none of them is sufficiently strong to move away from the current framework, which has helped promote stability and confidence in the Australian economy.

So the new Statement on the Conduct of Monetary Policy represents continuity with the previous Statement. The main drafting change is to make the link between monetary policy and financial stability a little more direct. In the previous Statement, monetary policy and financial stability were dealt with in separate parts of the document. Yet, over the years, financial stability considerations have been a factor in our monetary policy deliberations. Recently, for example, we have considered that a very quick return of inflation to the 2 to 3 per cent range at the cost of a material deterioration in the health of private sector balance sheets was unlikely to be in the public interest. The revised drafting recognises that our inflation target is pursued in the context of the Bank’s broader objectives, including financial stability.

Recent Economic Developments

I would now like to turn to the recent economic data.

Our economy continues its transition following the boom in commodity prices and mining investment. According to the latest national account, GDP increased by 3.3 per cent over the year to June. This was a better outcome than was widely expected a year ago. It is also a little above most estimates of trend growth in our economy. Partly reflecting this above-trend growth, the unemployment rate has declined by around ½ percentage point over the past year. Again, this is a better outcome than was thought likely a year ago.

As is always the case, these aggregate outcomes mask significant variation across industries and regions. Those parts of the economy that benefited most from the resources boom are now experiencing difficult conditions, while other areas are doing considerably better. In these other areas, business conditions have improved, employment has increased and there are some signs of a modest pick-up in private investment.

Overall, the economy is adjusting reasonably well to the unwinding of the biggest mining investment boom in more than a century. This is a significant achievement. We are managing this adjustment partly because of the flexibility of the exchange rate and the flexibility of wages and through the support provided by monetary policy.

The story on income growth has been less positive, with growth in nominal GDP being disappointing. Over the past five years, nominal GDP has increased at an average rate of around 3 per cent per year. To put this number in context, between 2000 and 2007, nominal GDP grew at an average rate of 7½ per cent per year. This is quite a change. It goes some way to explaining the sense of disappointment in parts of the community about recent economic outcomes.

The main reason for the weak income growth over recent times is the large fall in the prices received for our exports. Since the September quarter 2011, export prices have fallen by around one-third. This fall, though, does need to be kept in perspective. Export prices remain considerably higher than they were in the 1990s and early 2000s, relative to the price of our imports. And of course, some of the fall in prices is because of increased production from Australia. So while we are receiving lower prices for our exports, we are selling more.

The recent news on commodity prices has been a bit more positive than it has been for a while. Over the past couple of months, the prices of some of our key exports have risen, partly in response to production cutbacks by high-cost producers elsewhere in the world. While it is difficult to predict the future, if these increases were to be sustained then we could look forward to the drag on national income from falling commodity prices coming to an end.

A second factor that has weighed on growth in nominal GDP is the slow rate of wage increases. This is a common experience across most industrialised countries at present, even those with strong employment growth. In Australia, the current rate of wage growth is the slowest in around two decades. It is part of the adjustment following the resources boom. Importantly, it means that many more people have jobs than would otherwise have been the case.

The low wage growth and lower commodity prices have meant that CPI inflation has been quite low over recent times. Inflation has also been held down by increased competition in parts of retailing and cost reductions in some supply chains. Slow growth in rents has also played a role.

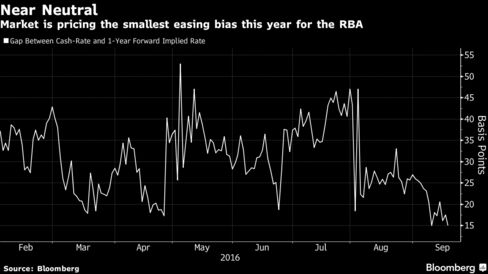
The low inflation outcomes have provided scope for monetary policy to provide additional support to demand. The Reserve Bank Board decided to reduce the cash rate by 25 basis points in May and again in August this year. Lending rates have come down as a result. Deposit rates have, of course, also come down. The Board is very conscious that this means lower interest income for savers. Overall though, our judgement is that this easing in monetary policy is supporting jobs and economic activity in Australia, and thus improving the prospects for sustainable growth and inflation outcomes consistent with the medium-term target.

Looking forward, we expect the economy to continue to be supported by low interest rates and the depreciation of the exchange rate since early 2013. Importantly, the drag from the fall in mining investment will also come to an end. While mining investment still has some way to fall, our estimate is that around three-quarters of the total decline is now behind us.

Inflation is expected to remain low for some time, but then to gradually pick up as labour market conditions strengthen further.

One issue that has attracted a lot of attention of late is the housing market. The construction cycle has a bit more momentum than we expected earlier. This is adding to the supply of housing in the country, which partly explains the slow growth in rents. The rate at which established housing prices are increasing has also moderated, although there remain some pockets where prices are increasing briskly. Credit growth and turnover in the housing market are also lower than they were a year ago. Under APRA’s guidance, lending standards have also been tightened. Overall, then, the situation is somewhat more comfortable than it was a year ago, although we continue to watch things carefully.

If I could now turn to the international environment.

The overall picture is as it has been for some time. The global economy is continuing to expand, but at a rate a little below average. Growth in global trade and investment is subdued. Inflation is also generally low and below most central bank targets. And interest rates in many countries are still very low.

One issue that continues to attract a lot of attention is the global monetary environment.

As we have talked about on previous occasions, at the global level there has been a very heavy reliance on monetary policy to stimulate growth. Some central banks have taken extraordinary actions, including large-scale money creation and setting negative policy interest rates. This has had global ramifications. While these actions have generally not been taken with the direct intention of influencing exchange rates, they have, inevitably, affected international capital flows and exchange rates. We have seen the effects here in Australia. The monetary expansion elsewhere and the low rates on offer overseas have meant that foreign investors have found Australian assets, with their relatively higher returns, attractive. In this way, what is happening elsewhere affects us here in Australia.

In the past 24 hours, there have been much-anticipated policy meetings by the Bank of Japan and by the Federal Reserve in the United States. These meetings followed a reassessment in markets about the potential for further stimulus from some major central banks, which saw bond yields rise from their historically low levels. In the event, the Bank of Japan and the Federal Reserve did not make material changes to their policy stances. In both cases, policy remains highly accommodative. The Federal Reserve’s statement did note, though, that the case for an increase in the federal funds rate had strengthened.

Another area that continues to be watched closely is the unfolding transition in the economy of our largest trading partner, China.

As we have discussed previously, growth in China has slowed as China too makes a difficult economic transition: in its case, from growth being driven by large investments in industrial capacity and property to a more consumption-focused and service-based economy. China is also dealing with the consequences of a large build-up of debt in the private and state-owned business sectors. Overall, the latest available data suggest that there has not been a major interruption to growth, although this is partly because the economy is being supported by fiscal policy, including expenditure on infrastructure. So the Chinese authorities face a difficult trade-off: measures to address industrial overcapacity and high debt levels are necessary over the longer term, but are not helpful in the short term. We all have a strong interest in them managing this trade-off smoothly.

Investors Betting On The Property Market

As we look across our latest household research, today we home in on property investors. We showed yesterday there is strong demand from both portfolio investors (those with multiple investment properties) and from solo investors (those with one or two properties). These segments are being motivated by the tax efficiency of the investment (36%), ongoing expectation of property capital growth (25%, compared with 28% a year ago), attractive overall returns compared with deposit accounts (18%) and low financing interest rates (14%). Overall, these drivers have been consistent through the last property boom cycle.

survey-sep-2016-invDrilling into solo investors, we see the same focus on tax efficiency (30%) and the lure of higher returns compared with bank deposits (35%). Indeed, as cash rates have fallen, we have see more switching from cash to property, one of the trends supporting the market.

survey-sep-2016-solo-invThere are a number of barriers to investors, apart from the obvious one of having already bought a property (43%), around 16% of investors are having difficulty getting the funding they need (16% compared with 4% a year ago) as lenders tighten their underwriting standards and income ratios. Fear of changes to regulation have receded from 21% a year back to 11% now. So essentially the main brake on property transactions is tighter standards. Property supply does not appear to be a problem.

survey-sep-2016-inv-barriersWe see a continued rise in SMSF investors adding property to their portfolio, with around 4% of funds holding residential property.  Once again tax efficiency (31%) and appreciating capital values (25%) are the main drivers, supported by low financing rates (15%).

survey-sep-2016-super-invThe proportion of property in a SMSF varies, with 20-40% being the most popular option.

survey-sep-2016-smsf-distFinally, it is worth noting that SMSF trustees are getting their investment property advice mainly from internet sites or forums (21%) or mortgage brokers (24%, compared with 21% a year ago). They also rely on their own knowledge (16%), Accountants (15%) or real estate agents (11%).  Mortgage brokers appear to be more in favour now as a source of guidance.

survey-sep-2016-trustee-adviceSo, in summary the investment sector is still strong, driven by the market fundamentals of expected capital growth and tax benefits, supported by ultra-low interest rates. Tightening underwriting standards make it harder for some to get the finance they require. However, we conclude the property investment boom is still largely intact.

It is worth also reiterating our earlier observation that many prospective investors are being drawn to the eastern states, irrespective of where they live. These “honey pots” are drawing in the bulk of transactions.

NZ Reserve Bank Holds Rate

The Reserve Bank today left the Official Cash Rate (OCR) unchanged at 2.0 percent.

Bank-Cress

Global growth is below trend despite being supported by unprecedented levels of monetary stimulus. Significant surplus capacity remains across many economies and, along with low commodity prices, is suppressing global inflation. Volatility in global markets has increased in recent weeks, with government bond yields rising and equities coming off their highs. The prospects for global growth and commodity prices remain uncertain. Political uncertainty remains.

Weak global conditions and low interest rates relative to New Zealand are placing upward pressure on the New Zealand dollar exchange rate. The trade-weighted exchange rate is higher than assumed in the August Statement. Although this may partly reflect improved export prices, the high exchange rate continues to place pressure on the export and import-competing sectors and, together with low global inflation, is causing negative inflation in the tradables sector. A decline in the exchange rate is needed.

Second quarter GDP results were consistent with the Bank’s growth expectations. Domestic growth is expected to remain supported by strong net immigration, construction activity, tourism, and accommodative monetary policy. While dairy prices have firmed since early August, the outlook for the full season remains very uncertain. High net immigration is supporting strong growth in labour supply and limiting wage pressure.

House price inflation remains excessive, posing concerns for financial stability. There are indications that recent macro-prudential measures and tighter credit conditions in recent weeks are having a moderating influence.

Headline inflation is being held below the target band by continuing negative tradables inflation. Annual CPI inflation is expected to weaken in the September quarter, reflecting lower fuel prices and cuts in ACC levies. Annual inflation is expected to rise from the December quarter, reflecting the policy stimulus to date, the strength of the domestic economy, reduced drag from tradables inflation, and rising non-tradables inflation. Although long-term inflation expectations are well-anchored at 2 percent, the sustained weakness in headline inflation risks further declines in inflation expectations.

Monetary policy will continue to be accommodative. Our current projections and assumptions indicate that further policy easing will be required to ensure that future inflation settles near the middle of the target range. We will continue to watch closely the emerging economic data.

Fed Holds Rates Once Again

Whilst the Fed highlighted some further improvements in the US economy, and three board members wanted to lift, the decision was to hold. The markets liked the decision, reflecting on the fact that with the November Fed meeting abutting the US election, December is the likely next window.

USA-Economy-Pic

Information received since the Federal Open Market Committee met in July indicates that the labor market has continued to strengthen and growth of economic activity has picked up from the modest pace seen in the first half of this year. Although the unemployment rate is little changed in recent months, job gains have been solid, on average. Household spending has been growing strongly but business fixed investment has remained soft. Inflation has continued to run below the Committee’s 2 percent longer-run objective, partly reflecting earlier declines in energy prices and in prices of non-energy imports. Market-based measures of inflation compensation remain low; most survey-based measures of longer-term inflation expectations are little changed, on balance, in recent months.

Consistent with its statutory mandate, the Committee seeks to foster maximum employment and price stability. The Committee expects that, with gradual adjustments in the stance of monetary policy, economic activity will expand at a moderate pace and labor market conditions will strengthen somewhat further. Inflation is expected to remain low in the near term, in part because of earlier declines in energy prices, but to rise to 2 percent over the medium term as the transitory effects of past declines in energy and import prices dissipate and the labor market strengthens further. Near-term risks to the economic outlook appear roughly balanced. The Committee continues to closely monitor inflation indicators and global economic and financial developments.

Against this backdrop, the Committee decided to maintain the target range for the federal funds rate at 1/4 to 1/2 percent. The Committee judges that the case for an increase in the federal funds rate has strengthened but decided, for the time being, to wait for further evidence of continued progress toward its objectives. The stance of monetary policy remains accommodative, thereby supporting further improvement in labor market conditions and a return to 2 percent inflation.

In determining the timing and size of future adjustments to the target range for the federal funds rate, the Committee will assess realized and expected economic conditions relative to its objectives of maximum employment and 2 percent inflation. This assessment will take into account a wide range of information, including measures of labor market conditions, indicators of inflation pressures and inflation expectations, and readings on financial and international developments. In light of the current shortfall of inflation from 2 percent, the Committee will carefully monitor actual and expected progress toward its inflation goal. The Committee expects that economic conditions will evolve in a manner that will warrant only gradual increases in the federal funds rate; the federal funds rate is likely to remain, for some time, below levels that are expected to prevail in the longer run. However, the actual path of the federal funds rate will depend on the economic outlook as informed by incoming data.

The Committee is maintaining its existing policy of reinvesting principal payments from its holdings of agency debt and agency mortgage-backed securities in agency mortgage-backed securities and of rolling over maturing Treasury securities at auction, and it anticipates doing so until normalization of the level of the federal funds rate is well under way. This policy, by keeping the Committee’s holdings of longer-term securities at sizable levels, should help maintain accommodative financial conditions.

Voting for the FOMC monetary policy action were: Janet L. Yellen, Chair; William C. Dudley, Vice Chairman; Lael Brainard; James Bullard; Stanley Fischer; Jerome H. Powell; and Daniel K. Tarullo. Voting against the action were: Esther L. George, Loretta J. Mester, and Eric Rosengren, each of whom preferred at this meeting to raise the target range for the federal funds rate to 1/2 to 3/4 percent.

Demand For Property “Safe As Houses”

As we finalise the next edition of the Property Imperative, we turn to the latest survey results, looking at household attitudes to property. The growth in volume of loans may be down a little, but their appetite for property is still strong. Recent auction results also underscore this. Today we compare the cross-segment survey responses, before in later posts diving into the more detailed results.

A quick reminder, we use the results from our 26,000 household surveys, and segment the results as described in the “segment cookbook“.

First we look at home price expectations.  Overall households are quite bullish on future capital growth, with portfolio investors most confident (68% expect a rise), 67% of solo investors and 58% of up traders expecting further gains. More than half of holders, and first time buyers also think prices will rise. Down traders are the least positive, here 20% think prices will continue to rise. There were some state variations, but we won’t discuss that here, other than to say NSW and VIC seem most bullish.

survey-sep-2016-pricesDemand for finance is also quite strong, with 92% of portfolio investors looking to borrow more (up from 87% a year ago) and 58% of solo investors up from 51% a year ago also seeking to borrow. Looking at first time buyers, 64% are seeking to borrow, compared with 60% a year ago. Those who are refinancing and borrowing more is also up, 38% compared with 30% a year ago.

survey-sep-2016-borrowInvestors, down traders and refinancers are most likely to transact in the next 12 months. 67% of portfolio investors are looking to buy another property, 49% of solo investors, and 40% of refinancers are in the market. The proportion of first time buyers continues to sit around 9%.  As we will see in later posts, there are more barriers to getting a loan now, thanks to tighter underwriting standards.

survey-sep-2016-transactFirst time buyers are saving hard (despite low deposit account rates and flat incomes), 76% compared with 72% a year ago. The proportion of want to buys (not actively seeking to buy) who are saving is down from 21% a year ago to 19% now. The combination of high prices, tighter lending standards and limited incomes all work against them.

survey-sep-2016-savingFinally, in the overview, those seeking to refinance are most likely to use a mortgage broker (79%, compared with 75% a year ago), then first time buyers (61%) and portfolio investors (51%). Holders apart, down traders are the least likely to seek assistance from a mortgage broker.

survey-sep-2016-use-brokerSo, we are still seeing strong demand for property. The question is whether there is supply of property, and mortgages to meet the demand. Our results also confirm that property investors are back in the game.

Services Employment Up, Economic Outcomes Down

In a CEDA speech “The Changing Nature of the Australian Workforce“, Alexandra Heath, Head of Economic Analysis Department, RBA has highlighted the rise in services sector employment. Much of this is related to a burgeoning healthcare sector, thanks to demographic shifts. Then we see growth in property, and property related sectors. Many other sectors are shrinking.

But we would stress that wages have risen little in the healthcare sector, which is one reason why household income is static, and employment in this sector, (and the property sector), whilst important, does not create new wealth, it merely transfers existing wealth. This lack of new wealth creation is why growth is under pressure. This is a the structural issue which needs to be addressed.

The decline in the share of routine manual jobs in industries such as agriculture and manufacturing as a result of technological change has had a long history (Graph 2). The offsetting increase has been in service sector jobs.

Graph 2
Graph 2: Employment by Industry

The health care & social assistance industry has made the largest contribution to employment growth over the past 15 years or so, and most of this has been in non-routine work (Graph 3). After health care, the two industries that have made the largest contributions to growth in non-routine jobs over this period are professional, scientific & technical services and education & training.

Graph 3
Graph 3: Industry Employment by Skill Type

Some of the increase in health care employment is related to the ageing of the population. Similar demographic trends are also likely to have contributed to the strong increase in employment in social assistance because it includes in-home support services. The stability of relative wages in the health sector over most of the past 15 years suggests that the expansion of demand for health care workers has been more or less met by an increase in the number of people who are able to work in the sector (Graph 4). The vocational education and training system has played an important role in providing qualifications in a range of these occupations, including child care, aged care and occupational therapy.

Graph 4
Graph 4: Changes in Relative Wage Levels

In contrast, education & training, construction and mining have all experienced a trend increase in their relative wages over the past 15 years or so. This suggests that the supply of workers with the right skills has not kept up with the increase in demand from these industries. In the case of mining and construction, the mining boom is an important part of the story (Kent 2016).

The relative wages for professional, scientific and technical services increased over the 5 years to 2013, but have since fallen. One possible explanation for this is that there was some difficulty meeting increasing demand and that supply of qualified workers responded with a lag. Another possibility is that rapid technological change has meant that some of the growth in employment in this industry has been in entirely new jobs that take some time to be captured in some wage measures.


The End of the Rate Cut Cycle in Australia?

From Bloomberg.

After two days in office, the bond market is signaling Reserve Bank of Australia Governor Philip Lowe is likely to preside over the end of his country’s longest monetary easing cycle.

Swaps traders boosted bets the RBA is on hold for the rest of this year to 72 percent as of 5 p.m. on Tuesday in Sydney, up from 51 percent at the end of August. Australia’s cash-rate target, which the central bank trimmed to a record 1.5 percent last month, is seen just 15 basis points lower in 12 months’ time, the smallest easing bias seen this year.

Australia’s economy is benefiting after commodity exports surged 30 percent from a trough this year and from unprecedentedly low interest rates, the RBA said Tuesday in minutes of the Sept. 6 policy meeting at which it left borrowing costs unchanged. The central bank is seeking to maintain a 25-year economic expansion that has faltered in recent years amid the collapse of a once-in-a-century mining boom and the spread of global disinflation.

“Given where rates are, the case to cut further has to be pretty compelling and when the data is mixed on the activity front it is clearly not a compelling case,” said Su-Lin Ong, the head of Australian economic and fixed-income strategy at Royal Bank of Canada in Sydney.


Former central bank governor Glenn Stevens, who went into retirement at the end of last week, cut interest rates by 3.25 percentage points over the past five years. Lowe — his erstwhile deputy — indicated earlier this year that lowering the benchmark cash rate on its own would lose effectiveness as it approaches 1 percent. With the nation currently enjoying an unexpected boost from rebounding global commodity prices, the jobless rate falling and economic growth accelerating, some have speculated that August’s quarter-point easing may have been the RBA’s last for this cycle.

RBA Assistant Governor Christopher Kent said in an address last week that Australia is about three-quarters of the way through the unwinding of its mining investment boom and that the level of export prices relative to import prices is predicted to remain near current levels. Kent’s speech was a signal that the central bank has now shifted to a neutral policy stance, according to Tim Toohey, Goldman Sachs Group Inc.’s chief economist for Australia.

“An adjustment lower in two keys factors — capex and commodities terms of trade — were the main reasons for RBA’s easing cycle since 2011,” said RBC’s Ong. “While the two aren’t tailwinds, we would argue the headwinds and the drag on activity from them are abating and that’s quite significant.”


The dialing back of easing expectations on Tuesday pushed the three-year sovereign bond yield to as much as 1.69 percent, the highest in almost three months. Its premium over the cash rate is near the widest since 2014. The 10-year yield this week climbed to a high of 2.17 percent.

Lowe will make his first public comments as governor on Thursday, when he’s scheduled to appear before a parliamentary committee in Sydney.

“For those who like to parse the RBA’s commentary, the positive flow outweighs the negative by a comfortable margin,” Michael Blythe, Commonwealth Bank of Australia’s chief economist, wrote in a note to clients Tuesday. “There is a growing perception that the need for additional interest rate stimulus is declining and the RBA’s reluctance to provide additional stimulus is increasing.”

Credit-to-GDP Gaps Warn of Financial Crisis

The Bank for International Settlements has released time-series data for the credit-to-GDP gap covering 43 economies starting at the earliest in 1961. The higher the ratio, the greater the risk of a looming financial crisis. Consider these leading indicators.

debt-to-gdp-sep-2016-allIreland has the highest ratio, followed by Denmark, Sweden and Netherlands, but Australia and Canada are rising fast, relative to US, UK and NZ. More evidence of the high debt burden.

Here is a clearer view of a sub-set of the data.

debt-to-gdp-sep-2016

The credit-to-GDP gap captures the build-up of excessive credit in a reduced-form fashion. It is defined as the difference between the credit-to-GDP ratio and its long-run trend, and it has been found to be a useful early warning indicator of financial crises. This data set covers 43 economies, starting in 1961 for the economies with the longest run of data. As input, we use the data on the credit-to-GDP ratio as published in the BIS database of total credit to the private non-financial sector. The credit series capture total borrowing by the private non-financial sector (ie households and non-financial corporations) from all sources.

Across countries, the credit-to-GDP gaps are derived from a standardised methodology and measure of credit to the private non-financial sector, implying that the BIS series may differ from credit-to-GDP gaps that are considered by national authorities as part of their countercyclical capital buffer decisions. The Basel Committee guidance on the countercyclical capital buffer suggests that the credit-to-GDP gap should be considered as one starting point about discussions of determining countercyclical capital buffer levels.

You can read about the basis of calculation, and assumptions here.

ASIC company data should be open and free

From The Conversation.

The Australian government is planning to privatise the management of the Australian Securities and Investments Commission database of companies. This is a potentially damaging move which goes against the government’s own open data policy.

Binary-PeopleOn behalf of the Australian government, ASIC currently charges businesses and individuals around A$50 million each year for company searches. The information covers everything from details of shareholders and company officers (A$19 per document) and their roles and relationships with other bodies, to financial reports and records of charges over company assets (A$38 per document).

It is undoubtedly a great money-spinner to charge members of the public more than A$1 per page for a downloaded pdf document. However, the original legislative purpose of making information about companies publicly available was surely not so that the Australian government could profit from selling that information. Indeed, there is no public policy or economic rationale for the charges.

I am yet to meet an economist who argues that levying costs on public information about companies helps markets operate more efficiently. What we’re actually doing is segregating the market into those who can afford public information about companies and those who cannot.

The movement of company data from public to private hands is likely to entrench the charges for public information about companies. The corporate database is likely to be treated as nothing more than a cash cow.

Inevitably the focus will be on how to fatten the cow. The question asked will not be should we make [so much] money from public information, but how can we make more? The adverse economic consequences and lost productivity benefits that flow from costly public data will not enter the calculations.

Malcolm Turnbull has supported open data

In March 2014 Malcolm Turnbull, then communications minister, made the following salient comments:

To be frank with you, I think it is really regrettable that ASIC’s data is behind a paywall.

I have to say as a matter of principle, I don’t think the government should be charging the public for data.

Obviously these are tough and troubled times from a budgetary point of view – and there will be all sorts of contractual issues – but really, the productivity benefits from making data freely available are so much greater than whatever revenues you can generate from them.

Our goal is … wherever possible to make that data accessible and free.

Our prime minister’s reported comments are consistent with the Australian government’s own 2015 Public Data Policy. This commits to optimising the use and reuse of public data, releasing non-sensitive data as open by default, and collaborating with the private and research sectors to extend the value of public data for the benefit of the Australian public.

I know many accounting academics who wish to conduct research to inform public policy using the financial reports on ASIC’s database. They are prevented from doing so because they do not have a spare A$50,000 lying around to buy the data.

Better corporate and tax regulation

Academics are not the only ones who would benefit from making ASIC’s public data freely available. It would also help individuals to scrutinise corporate affairs and, in doing so, make valuable contributions to the Australian regulatory authorities. This is the Jerry Maguire principle of public administration: help me, help you.

In carrying out its regulatory functions, ASIC relies heavily on complaints and reports of corporate misconduct received from individuals. Let’s do a cause and effect analysis here: the higher the charges for corporate information, the lower the scrutiny of corporate affairs by individuals, the fewer complaints made to ASIC, the weaker and more untimely corporate regulation.

The 2014 Senate inquiry report into the performance of ASIC must have had such an analysis in mind when it recommended that ASIC charges be brought into line with other jurisdictions. Searching for public information about companies is free in New Zealand and the United Kingdom.

The 2010 Senate inquiry report into insolvency practitioners is archetypal of the public policy problem. This committee found overwhelming evidence of bad and illegal practices in the insolvency industry. These practices thrived while there was low scrutiny and costly and missing financial information. ASIC was unaware of the nature and extent of what was going on.

Similar to ASIC, the Australian Taxation Office (ATO) relies on individuals to inform it of taxation misconduct by corporations. The same cause and effect analysis for complaints made to ASIC applies.

In carrying out its functions, the ATO is effectively hamstrung if individuals are unable to freely scrutinise the financial affairs of corporations and make timely complaints or reports. The heaving lifting of scrutiny and accountability in taxation falls on the few and the public purse is worse off because of it.

The 2015 Senate inquiry into corporate tax avoidance was remarkable not so much for the outlandish evidence of aggressive tax avoidance, but the incredulous expressions of senators in the Sydney hearing room as the evidence emerged. It was almost possible to read their thoughts: how could it be that we, the elected representatives of the people, could have missed this disgraceful state of tax affairs and for so long?

The answer, of course, is that there was a lack of timely genuine scrutiny by the public. It finally fell to investigative journalists such as Michael West (then of Fairfax) to blow the whistle after acquiring the financial reports of various multinational companies.

Cutting red tape for small business

Small businesses – often described as the engine room of the Australian economy – could also benefit from freely available company data. Small businesses and contractors should be able to educate themselves about the affairs of their corporate customers without having to pay the government for the privilege.

Unsecured creditors should be able to view the charges held against a company’s assets by secured creditors so they too can make informed decisions.

Employees and their representatives should likewise be able to freely access public information about corporate employers. Employees have an active and ongoing economic interest in a company, not least because of the employee benefits they accumulate such as annual leave, long service leave and superannuation contributions.

It is inefficient for the Australian government to levy charges that discourage timely regular scrutiny of large companies by employees. The social costs can be high when a company fails. Uninformed employees are likely to suffer shock and dislocation. Meanwhile the government often incurs the cost of paying out accumulated employee benefits.

In the public interest

Keeping public information about companies locked up behind paywalls and maintained by private interests is not in the public interest.

Free public information about companies in public hands will contribute to higher transparency, better governance and accountability, and less secrecy, incompetence, fraud and corruption. If the ASIC corporate database is sold, the opposite effects are virtually certain.

Author: Jeffrey Knapp; Lecturer/Accounting, UNSW Australia