The Bank of England issued a staff working paper – “A tiger by the tail: estimating the UK mortgage market vulnerabilities from loan-level data“.
 They have taken data from 14 million mortgages and run modelling across the cohorts to determine the LVR, LTI and DSR of mortgages. This is approach is an alternative to the survey led methods used by the Bank of England. Significantly, they conclude that risks in the system are understated using the survey methods (an analogy would be HILDA here); compared with the granular data. Policy makes are, they say, understating the risks. We agree!
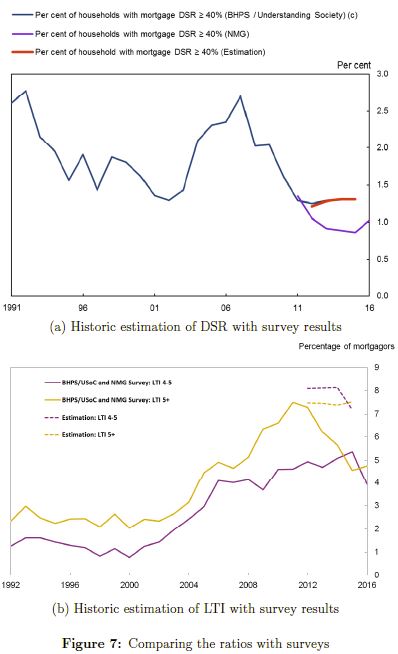
Our estimate provides an alternative source to track the tail of vulnerable borrowers in the UK. It suggests a larger tail compared to the available household surveys. While the Bank of England/NMG survey points to a falling tail of high DSR loans in recent years, our estimations indicate that it remained almost flat. Similarly, our estimations suggest a consistently higher share of high LTI loans over time. These results should make policy makers less sanguine about the developments in the UK mortgage market in recent years, which are traditionally analysed using these surveys.
In the absence of loan-level stock of mortgages in the previous years, policy makers have been relying on survey data to monitor risks to financial stability and calibrate policies. As already discussed, surveys can be subject to biases and small sample issues, so our work provides an alternative estimate of the LTI, DSR and LTV distributions. Notably, we find that size of the tail of vulnerable borrowers might have been higher in recent years than surveys suggest.
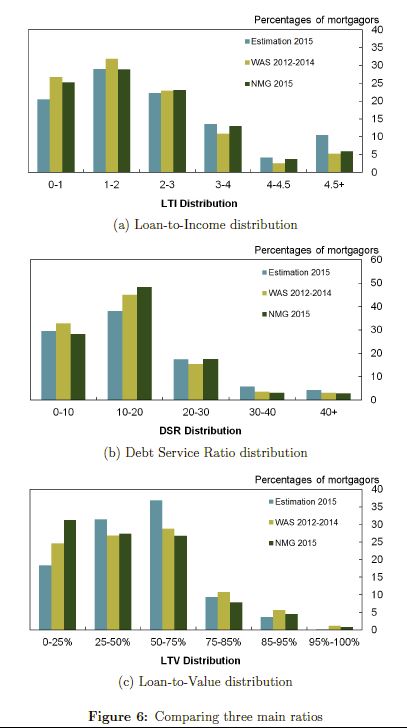
Figure 6 shows LTI, DSR and LTV distributions from our estimation against data from the NMG and WAS surveys as of 2015. Our estimate suggests a larger vulnerable tail (LTI above 4.5 and DSR above 40) compared to surveys. This is consistent with the finding that individuals tend to underestimate outstanding loan amount in surveys or highly indebted borrowers are under-represented in surveys. There is greater discrepancy in LTV distributions, which could be attributed to further bias in how individuals report property values in surveys.
Figure 7 compares the evolution of the tail of high LTI and DSR from our estimate and surveys over time. While the NMG survey suggests that the share of loans with DSR above 40% has decreased in recent years, our estimations indicate that it remained almost flat. Similarly, our estimations for high LTI shares are steadily higher. Our stock estimation can also shed light on the characteristics of specific cohorts of borrowers and loans. To illustrate the type of analysis can be done by using the loan-level estimate, we present the age distribution of high DSR (40%+), high LTI (4.5+) and high LTV (85%+) loans.
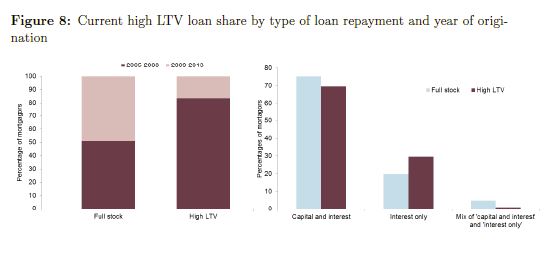
Figure 8 shows the characteristics of current high LTV loans. We find that most of the LTV loans were originated pre-2009, before credit conditions tightened materially in the UK. We also see that a large proportion of outstanding loans with high LTVs (85%+) are interest-only. This suggests that if policy makers are concerned with the tail of high-LTV mortgages that are interest-only, analysing the flow of new loans is unlikely to provide much insight, as interest-only loans are currently very rare. The focus needs to be turned to the high-LTV cohort in the stock and the interest-only loans originated in pre-crisis period.
Our estimate provides an alternative source to track specific cohorts of borrowers in the UK mortgage market. We find that a larger tail of vulnerable borrowers than household surveys suggest. While survey data suggest that the share of high DSR loans has decreased in recent years, our estimations indicate that it remained almost flat. Similarly, our estimate of high LTI shares over time are steadily higher than surveys. All these results suggest that policy makers should be less sanguine about the developments in the UK mortgage market in recent years. As these analyses are based on very detailed granular regulatory data, we believe the results are more reliable than surveys.
Note: Staff Working Papers describe research in progress by the author(s) and are published to elicit comments and to further debate. Any views expressed are solely those of the author(s) and so cannot be taken to represent those of the Bank of England or to state Bank of England policy. This paper should therefore not be reported as representing the views of the Bank of England or members of the Monetary Policy Committee, Financial Policy Committee or Prudential Regulation Committee.


