A home of your own: dream or delusion?

From The Conversation. The appeal of owning a home seems deeply embedded in the psyche of Australians. Yet psychologically, it is not clear the home ownership dream is entirely rational. Achieving the dream may not be all we might have hoped, and chasing it may even do damage.

We’d all like a castle of our own, one day. Image sourced from Shutterstock.com

The psychological reason Australians want to own their own home is perhaps best expressed by Darryl Kerrigan in the uniquely Australian film, The Castle. It continues to be celebrated globally for showing that the house is just a shell that holds heart. To own your own home has a strong sentimental value, as Darryl says: “You can’t buy what I’ve got.”

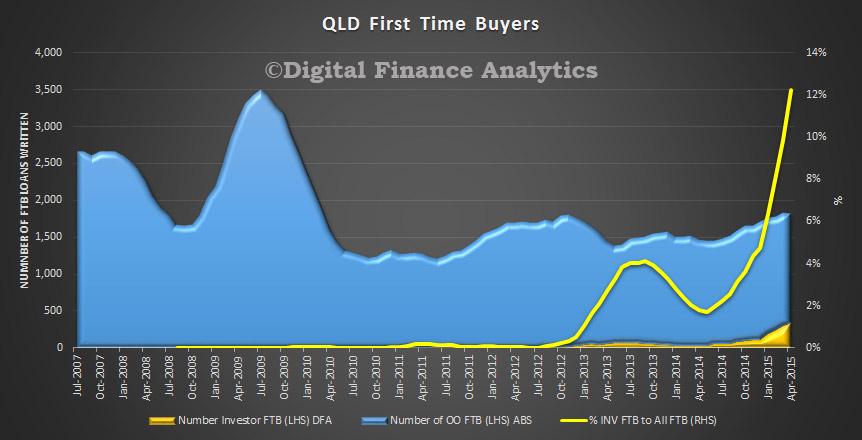
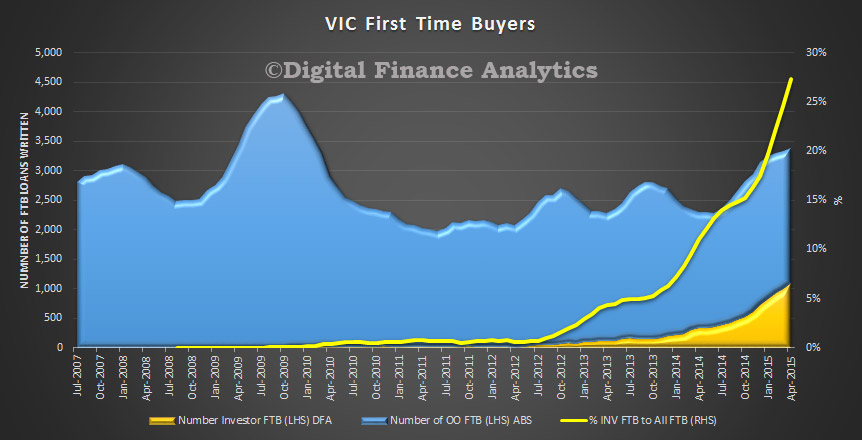
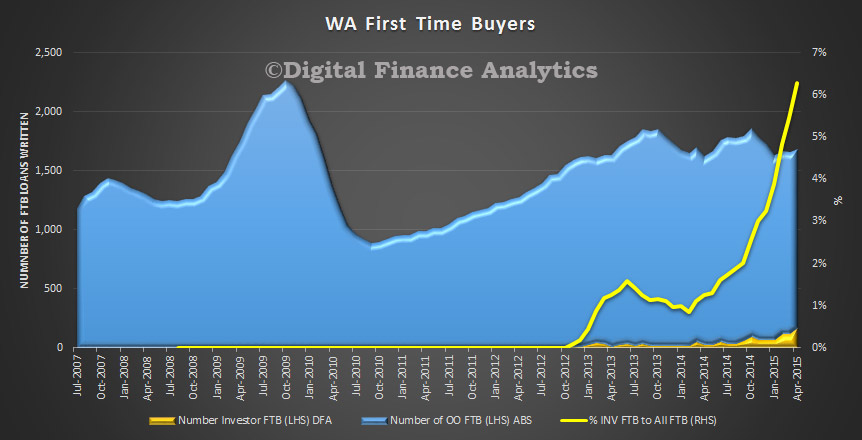
According to data on social trends from the ABS, the dream is not merely a distant aspiration, but one achieved by a majority of the Australian population. More than two out of every three Australians are living in their own home, a figure that has been maintained across a number of decades (see below).

Australian Bureau of Statistics ABS Australian Social Trends 6530.0 & 4102.0

However, the data also show that the proportion who own with a mortgage is increasing (and the proportion without is decreasing). So the dream continues to be made a reality even if home buyers need to borrow more money to achieve it.

Dare to dream

What harm can there be in having dreams? Well, there is a sizeable minority who perhaps do not achieve their dreams. And dreams that keep us awake at night are not good.

Joe Hockey’s recent remarks suggesting would-be home owners “get a good job” were labelled as insensitive and drew a great deal of ire.

The public reaction reinforced the fact that we have a strong attachment to the dream of owning our own home. But why this attachment? While we need a place to live, and housing is for many a form of retirement saving, the desire to own our own home goes beyond these needs.

It’s a global desire, judging by the substantial home-ownership rates around the world – from 98.7% in Romania to 44.0% in Switzerland.

Across cultures and across age groups, one of the motivations for possession of anything is to have the ability to control that possession. In the case of a house, this might be to nail up pictures, paint walls and remodel the place.

The real cost of ownership

But this desire to own, the wish to possess, comes at a cost. First, there is considerable research suggesting we tend to overweight the value of owning stuff as opposed to simply having access to use. Called the endowment effect, it describes the way in which we tend to place a higher value on an item that is owned than on an identical item which is not owned.

Surprisingly, and perhaps of greater concern, is that ownership of a home does not appear to necessarily make people happier. One researcher found that women who owned their own home were no happier than those who rented.

More generally, the rent vs buy debate seems to focus the issue on elements that turn out to be less relevant to our longer-term happiness. We make choices based on big differences (such as rent or buy) when the two dwellings are in most other respects, very much the same.

In this case, we are falling for the focusing illusion whereby we exaggerate the joys of home ownership. Psychologist Daniel Kahneman explains this concept with regard to the myth of California happiness.

And once we get to be a home owner, the pleasure we so anticipated can quickly disappear through the phenomenon of hedonic adaptation. We imagine that owning our own home will make us very happy, and while this may be true in the short run, our happiness levels return quickly to whatever they were before the event.

Hedonic adaptation diminishes both acute negative and positive experiences. And this may explain why home ownership rates and desires bounced back quickly in the US despite the punishing lessons delivered during the global financial crisis of 2008 when many held mortgages of greater value than their home.

We might be inclined to argue that home ownership is a good investment, that “rent money is money down the toilet”, but we may be engaging in a confirmation bias. That is, interest and council rates are a similar “waste”, but we discount this argument because we already believe home ownership is good.

In any case, the walls and roof within which we live do not make the home. While we may justify our dreams with reasons, the truth of the home ownership dream is probably closer to the heart than the head.

Author – Stephen S Holden Associate professor at Bond University

US Industrial Production Wobbles

According to the FED, industrial production decreased 0.2 percent in May after falling 0.5 percent in April. The decline in April was larger than previously reported, but the rates of change for previous months were generally revised higher, leaving the level of the index in April slightly above its initial estimate. Manufacturing output decreased 0.2 percent in May and was little changed, on net, from its level in January. In May, the index for mining moved down 0.3 percent after declining more than 1 percent per month, on average, in the previous four months. The slower rate of decrease for mining output last month was due in part to a reduced pace of decline in the index for oil and gas well drilling and servicing. The output of utilities increased 0.2 percent in May. At 105.1 percent of its 2007 average, total industrial production in May was 1.4 percent above its year-earlier level. Capacity utilization for the industrial sector decreased 0.2 percentage point in May to 78.1 percent, a rate that is 2.0 percentage points below its long-run (1972–2014) average.

Probably not enough negative news to hold off on interest rates rises in the US later in the year, but was enough to drive the markets lower overnight.

Monetary Policy Transmission

Christopher Kent, Assistant Governor (Economic), gave a speech in Canberra at the Australian National University entitled “Monetary Policy Transmission – What’s Known and What’s Changed“. In the speech he dissects the way in which changes to monetary policy flows on through the economy to households and firms.  Its a relevant discussion because the recent monetary easing has not so far translated into the desired outcomes in the current cycle. We think he is correct to assert that segmented analysis of households needs to be incorporated into the thinking, as based on our surveys we see that different household groups, are behaving in very different ways.

In responding to cyclical developments and inflation pressures, monetary policy has a significant influence on aggregate demand and inflation. The transmission of interest rates through the economy can be roughly described as follows. I’ll focus on an easing of monetary policy.

  1. The Reserve Bank lowers the overnight cash rate.
  2. Financial markets update expectations about the future path of cash rates and the structure of deposit and lending rates are quickly altered.
  3. Over time, households and firms respond to lower interest rates by increasing their demand for credit, reducing their saving and increasing their (current) demand for goods, services and assets (such as housing and equities).
  4. Other things equal, rising demand increases the prices of non-tradable goods and services. The price-setting behaviour of firms depends on demand conditions and the cost of inputs, including of labour. Higher aggregate demand leads to increased labour demand and a rise in wages.

The transmission mechanism depends crucially on how monetary policy affects households’ and firms’ expectations. Expectations about the future path of the cash rate will affect financial market prices and returns, asset prices and the expected prices of goods, services and factors of production (including labour). Expectations of more persistent changes in the cash rate will have larger effects.

The extent to which lower interest rates lead to extra demand will depend on how households and businesses alter their behaviour regarding borrowing and investing, as well as consuming and saving. These responses are often described as occurring via a number of different channels.

He concludes that monetary policy is clearly working to support demand, although it is working against some strong headwinds. These include the significant decline in mining investment, fiscal consolidation at state and federal levels and the exchange rate, which continues to offer less assistance than would normally be expected in achieving balanced growth in the economy. Model estimates that control for these and other forces provide tentative evidence that the monetary policy transmission mechanism, in aggregate, is about as effective as usual. However, it may be too early to pick up a statistically significant change using such models.

As usual, dwelling construction is growing strongly in response to low interest rates, and this is making some contribution to the growth of aggregate demand and employment. It may be that in parts of the country, any further substantial increases in residential construction activity might run up against some supply constraints, putting further upward pressure on housing prices. As the Bank has noted for some time now, large increases of housing prices, if accompanied by strong growth of credit and a relaxation of lending standards, are a potential risk for economic stability. Accordingly, the Bank is working with other regulators to assess and contain such risks that may arise from the housing market.

Consumption growth has picked up since 2013. But it is still a little weaker than suggested by historical experience. This may reflect a number of factors including some variation in the ways that the different channels of monetary policy are affecting households according to their stage in life. Some indebted households appear to be taking advantage of low interest rates to pay down their debts faster than has been the norm, perhaps in response to weaker prospects for income growth. Those relying on interest receipts may feel compelled to constrain their consumption in response to the relatively long period of very low interest rates. Meanwhile, the search for yield is no doubt playing a role in driving the strong growth of investor housing credit. This might provide some indirect support to aggregate demand, but this channel is not without risk.

In short, monetary policy is working. The transmission mechanism may have changed in some respects, and this could help to explain lower-than-expected growth of consumption and debt of late. But it is hard to be too definitive. To know more about this, it would be helpful to better understand the behaviours of different types of households using household-level data. To use a botanical analogy, to know more about a plant, it’s helpful to observe how its different types of cells work.

Governor Mark Carney speaks at the Mansion House on 10 June 2015

Bank of England Governor Mark Carney makes a major speech at the Mansion House on 10 June 2015, with Chancellor George Osborne, and Lord Mayor Alan Yarrow. Governor Carney details the reforms that the Fair and Effective Markets Review will bring to ensure real markets and financial services that serve society, free of implicit public subsidy. In the speech, he details reforms under way to market-structures, standards, systems, incentives, training, etc, and outlines the work of the Markets Standards Board. The UK’s global reputation will, he says, be enhanced by the strong reforms under way, which will include individuals taking clear personal accountability for wrongdoing. He also details earlier failings of the Bank of England – as well as its successes.

A transcript of the speech is available.

Rogue Bankers Join the Welfare Cheats on Osborne Hit List

From The Conversation.

Cracking down on bad behaviour. EPA/Andy Rain

“The age of irresponsibility is over” declared the governor of the Bank of England at the annual Mansion House dinner to the great and the good of the financial world. Along with the chancellor of the exchequer, George Osborne, Mark Carney unveiled a host of new sanctions and procedures designed to clean up financial markets.

Delivering the Fair and Effective Markets Review, an annual assessment of the way financial markets operate, they mentioned 11 recommendations ranging from new regulations against manipulating markets to tightening up hiring and training policy in the financial services industry. But the most eye-catching feature of the review was the demand for enhanced criminal prosecutions of “individuals who fraudulently manipulate markets”.

In Osborne’s words, people “who commit financial crime should be treated like the criminals they are”. The review therefore recommended that criminal sanctions for market abuse should be extended to traders in foreign exchange markets and that the maximum sentences for wrongdoing should be lengthened from seven to ten years.

Mervyn King EPA/Franck Robichon

Osborne and Carney were also critical of the Bank of England for failing to identify risks and abuses in the banking system in the run up to the financial crisis. But there are actually far more parallels between Carney and his predecessor, Mervyn King, than you might assume on the evidence of the Mansion House speech.

King, who experienced the banking crises (bail-outs and scandals) in the last few years of his governorship, was also critical of the failures of the largest banks. Carney has followed in his stead, voicing his criticisms of the industry, and has enjoyed new powers as a result of the Financial Services Act, passed in 2012. Strong criticisms have therefore been accompanied by new regulatory bodies such as the Financial Policy Committee and Prudential Regulatory Authority (replacing the old Financial Services Authority).

Culture change

But the real message behind the Mansion House speeches is that the state’s approach to policing the banking system is indeed toughening – precisely because change has been so slow in forthcoming. Amid the creation of new, formal regulatory bodies (FPC, PRA, FCA), a host of other relatively informal, or advisory bodies have emerged too.

These include the Parliamentary Committee on Banking Standards and the Banking Standards Board. Another one was recommended in this latest review – the Market Standards Board. What all these bodies have in common is that they are trying to remedy irresponsible behaviour on the part of individuals working in financial services, and to improve the “culture” of banking.

Improving banking culture has two faces. It is partly a PR exercise aimed at improving consumer confidence in the banks. But it is also about addressing a more substantive threat posed by bad behaviour.

That change in culture has been slow. The recent forex scandal, for example, revealed that corrupt behaviour in these markets was still occurring in the UK up until 2014, long after the Libor, IRSA and PPI revelations.

The market police state

Many in the room at the Mansion House were expecting the big announcement to focus on concessions on the bank levy. The expectation – with half an eye on HSBC’s announcements (read: veiled threats) earlier in the week – was that the chancellor might cede some ground to the largest banks. Instead though, the ominous silence on the bank levy and the tough-talking approach reinforce an important message: that the state is no longer willing or able to turn a blind eye to irresponsible banking.

Bankers are in need of a PR boost. Dominic Lipinski / PA Wire/Press Association Images

What is most noteworthy in the latest review is that it shows the Conservative government – known for its strong stance on welfare cuts and typically labelled a business-friendly party – is also taking a tough stance on the UK’s biggest industry, financial services. But this is not as surprising as it might appear. The same principles that underpin the Tories’ position on the welfare state also underpin their take on individuals who commit fraud and cheat in the financial services industry.

The Conservatives are fulfilling a role assigned to them by classical, liberal thinkers such as Adam Smith – that of a market police ensuring the “better” functioning of the market mechanism itself and maintaining the legitimacy of commercial society. This is because, in the mind of the Conservative government, it is not simply “free-riding” benefit claimants which threaten the market mechanism, but the collusive behaviour of individual bankers as well.

Ultimately, the Fair and Effective Markets Review is more than just another piece of clever political rhetoric. It is being backed up by genuine changes in the regulatory approach to anti-competitive behaviour in the financial services industry.

The hope is that, gradually, the culture of banking will indeed change and legitimacy and credibility can be restored to the banking system. But, as some commentators have also noted with some concern, the UK’s unhealthy addiction to cheap consumer credit, high levels of mortgage borrowing, and consumption-led recoveries, means that Britain’s financial worries run far deeper than just the behaviour of a few “bad apples” in the banking industry.

Author – Huw Macartney – Lecturer in Political Economy at University of Birmingham

Stamp Duty One Part of a Bigger Problem for Housing – HIA

The residential building industry is being weighed down by excessive and inefficient taxation, beyond just Stamp Duty, says the Housing Industry Association (HIA).

In some states the total tax bill amounts to over 40 per cent of the final price of a new home, taxes on new housing are a brake on economic activity, and represent a constraint on housing affordability and labour productivity.

There is no question that Stamp Duty is one of the key offenders, with research undertaken last year for HIA by Independent Economics identifying it as is the most inefficient tax in Australia’s entire taxation system.  As a tax on moving, it discourages households from relocation when this decision may better suit their needs in terms of size, location or employment opportunities. Unfortunately, the economy and the community do not get the best use out of the available housing stock. “However, there are many other taxes on new homes including developer infrastructure levies, which can be over $70,000 on a new house and land package, and which unfairly require new home buyers to fund community assets upfront.

Equally, GST is levied on new homes but not existing properties. Adding tens of thousands of dollars on a new home, GST creates a price differential between new and existing residential properties, which hits affordability, supply, employment and economic activity. Affordability is further eroded by the cascading effect of ‘taxing taxes’, whereby a tax such as stamp duty is levied on an amount that already includes a range of other costs. GST on infrastructure levies alone can add more than $5,000 to the final cost of a new home, while stamp duty on the total GST adds around $3,000. Infrastructure charges, GST and stamp duty add $140,000 and more to the cost of a new home in Sydney, while a plethora of other taxes, levies, fees, changes, rates and duties take the total tax grab to over 40 per cent of a new house and land package.

Taxes add more than $250,000 to the price of a new home in Sydney, accounting for 40 per cent ($1,350 per month) of repayments for the life of a home mortgage.  Incredibly, in supplying shelter for Australians, residential building contributes 13 per cent of all GST revenue collected by the Commonwealth. Sadly, that taxation revenue drives up the cost of housing.

Perspectives on the Housing Debate

Last week amongst all the noise on housing there were some important segments from the ABC which made some significant contributions to the debate. These are worth viewing.

First Lateline interviewed the Grattan Institute CEO on the social and political impacts of housing policy, and also covered negative gearing.

Second The Business covered foreign investors, restrictions on investment lending and the implications for non-bank lenders who are not caught by the APRA “guidance”.

Third, a segment from Insiders on Sunday, dealing with both the economic arguments and the political backcloth.

Next a segment from Australia Wide which explores the tensions dealing with housing in a major growing city, Brisbane. No-one wants building near their backyard, so how to deal with population growth.


Latest Lending Aggregates All About Property

The ABS released their data for April. The total value of owner occupied housing commitments excluding alterations and additions rose 1.3% in trend terms  whilst the value of total personal finance commitments rose 0.5%.

Total commercial finance commitments rose 2.4%. Fixed lending commitments rose 3.4%, while revolving credit commitments fell 0.4%. The trend series for the value of total lease finance commitments rose 1.6% in April 2015.

Lending-Aggregates-April-2015We continue to see strong investment lending with more than half of residential loans in April going to investors.

Property-Lending-Aggrates-April-2015The proportion of commercial lending aligned to investment property rose and this explains much of the rise in commercial lending overall. Investment property lending is relatively unproductive, and makes little contribution to economic growth.

Commercial-Lending-Aggregates-April-2015

The Rise, and Rise, and Rise of Investor First Time Buyers

DFA has just released the latest analysis of survey results which shows that nationally 35% of all First Time Buyers are going direct to the Investment sector. However there are significant state differences, with more than fifty percent of transactions from first time buyers in NSW, and upticks in other states as the behaviour spreads. You can watch our latest video blog on this important subject.

Here is the data we used in the video. The first chart shows the national average picture, using data from the ABS to track owner occupied first time buyers (the blue area), data from DFA surveys to display the number of FTB investment loans (the yellow area), both to be read from the left hand scale, and the relative proportion of loans using the yellow line on the right had scale. About 35% of loans are going to investment first time buyers.

ALL-FTB-June-2015In NSW, the rise of investors has been running for some time, and as a result, more than  50% of loans are First Time Buyer investors. Note the growth thorough 2013.

NSW-FTB-June2015In QLD, until recently there was little FTB investor activity, but we are seeing a rise in 2014, to a peak of 12%

QLD-FTB-June-2015The rise of FTB investors in VIC started in 2013, but is now growing quite fast, to about one quarter of all FTB activity.

VIC-FTB-June-2015Finally, in WA, where OO FTB activity is quite strong, we are now seeing the rise of FTB investors too. Currently about five percent are in this category.

WA-FTB-June-2015 There is a clear logic in households minds. They see property values appreciating in most states, yet cannot afford to buy a property for owner occupation in a place where they would want to live. So they choose the investment route. This enables them to purchase a cheaper property elsewhere by grabbing an investment loan, often interest only and serviced by the rental income. In addition they get the benefits of negative gearing and potential capital appreciation. Meantime they live in rented accommodation, or with families or friends. About ten percent of recent purchasers have received some help from “The Bank of Mum and Dad“. Finally, some see the investment route as a means to build capital for the purchase of an owner occupied property later, though others are now thinking more in terms of building an investment property portfolio. They are on the property escalator, with the expectation that prices will continue to rise.

There are some significant social impacts from this change, and there are probably more systemic risks in an investment loan portfolio, which should be considered. We are of the view that the recent APRA “guidelines” will only have impact at the margin, so we expect to see continued growth in FTB investment property purchases for as long as interest rates stay low and property values rise.

Real Wages Show US Economy is Stronger Than You Think

From The Conversation. Last month’s US employment report, released on Friday, contained a lot of good news.

First, monthly jobs growth exceeded expectations, as employers hired 280,000 people. Second, the labor force participation rate ticked up, indicating that people who had stopped looking for work were becoming more optimistic about finding a job and thus had resumed their search for one.

Finally, average hourly earnings for all production and non-supervisory workers in the private sector grew by 2%, compared with May 2014.

Some people may question why wage growth of 2% would be considered good news. The reason is there was no rise in prices over that period, so the average real wage also grew by about 2%. And it is the real wage, rather than nominal pay without accounting for inflation, that ultimately determines the living standards of the American worker.

While the first two highlights from the jobs report are indeed good news, this last one might be its most important takeaway – though it’s been true for a few months now. We’ve been reading articles for years about how stagnant wages have been without focusing on the impact of the lack of inflation. In other words, while we’re not making a lot more money, it should feel like more because consumer prices have barely budged since the financial crisis – by that measure, wages for most workers are the highest they’ve been in decades.

This matters because it suggests the economy is in better shape than we think and may be what the Federal Reserve has in mind as it considers raising rates this year, with many (including the International Monetary Fund) urging the central bank to wait until 2016.

One of the biggest risks, however, concerns productivity, which is truly stagnant. That and take-home pay are highly correlated, so if productivity doesn’t pick up, the rise in real wages may well evaporate.

The real wage story

The consumer price inflation data for May will not be released until later this month, so the balance of this essay will focus on the real wage rate in the private sector through April – although I would not expect the story to change once we can evaluate the latest data. (Hourly wage data for government workers are not available.)

I would also like to focus on the economic prospects of middle- and lower-income workers, so I will be looking at the earnings of those in production and non-supervisory roles. This group accounts for 82% of all private sector workers, who on average earned US$20.91 an hour in April.

The average hourly real wage for this group since 2007 is shown below (converted to April 2015 dollars). The shape of this graph undoubtedly will surprise many readers given the widely held believe that the middle class has been falling behind economically.

Real wages are now the highest since 1979. Bureau of Labor Statistics

The average hourly real wage did decline during the “Great Recession” and again in 2011 and 2012, but since falling to its recent low of $20.17 in October 2012 it has increased, first at a modest pace and then more rapidly since September as price inflation disappeared.

Perhaps even more surprising for most people is that the average real wage for these employees is now at the highest level since March 1979, although it is still 8.2% below the all-time peak ($22.27) reached in January 1973.

The average real wage for middle-class workers declined during the second half of the 1970s, the 1980s and the first half of the 1990s, reaching a low of $17.97 in April 1995 (data go back to 1964). Since then, wages have tended to slowly increase, with the largest gains when price inflation disappears and the greatest losses occurring when it spikes upward.

Widespread gains

That brings us back to the most recent figures. During the 12 months through April, average hourly real earnings for production and non-supervisory workers increased by 2%. These wage gains are fairly widespread among industries, as is shown in this table.

Real wages are up across the board over the past year through April. Bureau of Labor Statistics

Moreover, the greatest wage gains occurred in some of the lowest-wage industries: in retail trade (up 2.3%), accommodations (4.6%), full-service restaurants (4.7%) and fast food restaurants (3.7%). Clearly some of the lowest-paid workers in America have enjoyed some very substantial real wage gains during the past year.

Real wage gains have also far outstripped productivity gains. From the first quarter of 2014 to the first quarter of this year (most recent data), labor productivity in the non-farm business sector increased by only 0.3%, compared with real wage growth of 1.9% for private sector production and non-supervisory workers over the same period.

The poor rate of productivity growth has been a feature of the current economic recovery. Over the past five years, from the first quarter of 2010 to the first quarter of 2015, output per labor hour has increased by only 2.8%, or 0.6% per year. Over the long run, productivity growth puts a cap on the maximum rate of growth in the real hourly wage rate – meaning if productivity doesn’t start rising, neither will wages.

Why real wage growth is poorly understood

So why are people so convinced that middle- and low-wage workers have been losing ground?

Many people point to the fact that the real hourly wage is less than it was in 1973, but that reflects the decline that occurred between 1973 and 1995. Since then, the average hourly wages have been on a slow upward trend, averaging 0.76% per year – not much, but positive all the same. And as I’ve shown, those gains accelerated in the past year year, with even larger ones in lower-wage industries.

Perhaps the recent wage gains have yet to sink into people’s consciousness, and thus their assessment of the economy will shortly improve. Also, millions of people are still unemployed or have dropped out of the labor force, and their income has not benefited from the increase in average wages.

Or perhaps people are unhappy because they are comparing their financial situation with higher-income households, who have done even better, although income inequality is only slightly worse than it was in 2000, when the middle class seemed much happier (see the excellent work of Berkeley’s Emmanuel Saez).

Or maybe it’s something as simple as our spending desires outpacing the growth in the real wage rate. People clearly were spending a lot of borrowed money through 2007, when the financial crisis sharply curtailed many people’s ability to borrow and spend.

What I do know, however, is that unless productivity growth improves, the real wage gains that the data show will prove fleeting. And then we really will be in a world of hurt.

Author – Donald R Grimes, Senior Research Associate, Institute for Research on Labor, Employment and the Economy at University of Michigan