New Home Sales at Four-Year High – HIA

The latest result for the HIA New Home Sales Report, a survey of Australia’s largest volume builders, shows strong growth in March 2015, taking sales volumes to their highest level since early 2010. Total seasonally adjusted new home sales increased by 4.4 per cent in the month of March, with an 11.3 per cent rise in multi-unit sales and a 2.6 per cent rise in detached house sales.

In March 2015 private detached house sales increased by 5.9 per cent in Victoria, 4.2 per cent in New South Wales and also 4.2 per cent in Western Australia. Private detached house sales declined by 5.8 per cent in South Australia and by 2.3 per cent in Queensland. In the March 2015 quarter, detached house sales increased in Victoria (+5.2 per cent) and Queensland (+4.3 per cent). Elsewhere sales declined: in WA (-6.4 per cent), NSW (-3.6 per cent) and SA (-1.4 per cent).

HIA-To-March-2015

CBA 3Q Trading Update – Is Pressure Rising?

The CBA released their 3Q update today.  We see the same signs of margin pressure and likely slower growth ahead, as in the recent results from ANZ and Westpac. We think the sector will be under more pressure going forwards. Extra capital requirements will also bear down in coming months. Provisions, at the bottom of the cycle were up.

Unaudited cash earnings for the three months ended 31 March 2015 (“the quarter”) were approximately $2.2 billion. Statutory net profit on an unaudited basis for the same period was also approximately $2.2 billion, with non-cash items treated on a consistent basis to prior periods. This was below market expectations.

Revenue growth was similar to 1H15. Group Net Interest Margin continued to be impacted by competitive pressures by around 3 basis points. Trading income remained strong; Expense growth was higher in the quarter, impacted by growing regulatory, compliance and remediation costs, including those associated with a number of legislative reforms (FATCA, FoFA, Stronger Super, LAGIC), provisioning for the advice review program and ongoing regulatory engagement.

Across key markets, home lending volume growth continued to track slightly below system, consistent with the Group’s underweight position in the higher growth investment and broker segments; core business lending growth remained at mid-single digit levels (pa), household deposits growth was particularly strong in the quarter, with balances growing at an annual rate of over 10 per cent; in Wealth Management, Funds under Administration and Assets under Management grew 7 and 8 per cent respectively in the quarter, reflecting strong investment performance, net inflows and FX gains; insurance inforce premiums increased 3 per cent on the prior quarter; ASB business and rural lending growth remained above system and home loan growth was stronger Credit quality remained sound.

In the retail portfolios, home loan and credit card arrears were broadly flat, whilst seasonal factors contributed to higher personal loan arrears. Troublesome and impaired assets were lower at $6.4 billion. Total loan impairment expense was $256 million in the quarter, up from $204m a year earlier, with strong provisioning levels maintained and the economic overlay unchanged. Home loan arrears were higher in Bankwest than the Australian and New Zealand businesses.

CBA-Home-Loan-Arrears-May-2015The Group’s Basel III Common Equity Tier 1 (CET1) APRA ratio was 8.7 per cent as at 31 March 2015, an increase of 20 basis points on December 2014 after excluding the impact of the 2015 interim dividend (which included the issuance of shares in respect of the Dividend Reinvestment Plan). The Group’s Basel III Internationally Comparable CET1 ratio as at 31 March 2015 was 12.7 per cent. They will need to raise more capital on these ratios than we expected.

CBA-Capital-May-2015  Funding and liquidity positions remained strong, with customer deposit funding at 64 per cent and the average tenor of the wholesale funding portfolio at 3.9 years.

CBA-Deposit-Funding-May-2015Liquid assets totalled $144 billion with the Liquidity Coverage Ratio (LCR) standing at 122 per cent. The Group completed $8.5 billion of new term issuance in the quarter.

Basel Compliance Not Linked To Bank Performance

An IMF Working Paper was released today, entitled “Does Basel Compliance Matter for Bank Performance?”.  They conclude that overall Basel compliance has no association with bank efficiency. This is important because the burden of compliance with international regulatory standards is becoming increasingly onerous, and financial institutions worldwide are developing compliance frameworks to enable management to meet more stringent regulatory standards. As regulators refine and improve their approach and methodologies, banks must respond to more stringent compliance requirements. This has implications for risk management and resource allocation, and, ultimately, on bank performance.

However, there is no evidence that any common set of best practices is universally appropriate for promoting well-functioning banks. Regulatory structures that will succeed in some countries may not constitute best practice in other countries that have different institutional settings. There is no broad cross-country evidence as to which of the many different regulations and supervisory practices employed around the world work best. As a consequence, the question of how regulation affects bank performance remains unanswered. Regulators around the world are still grappling with the question of what constitutes good regulation and which regulatory reforms they should undertake.

The global financial crisis underscored the importance of regulation and supervision to a well-functioning banking system that efficiently channels financial resources into investment. In this paper, we contribute to the ongoing policy debate by assessing whether compliance with international regulatory standards and protocols enhances bank operating efficiency. We focus specifically on the adoption of international capital standards and the Basel Core Principles for Effective Bank Supervision (BCP). The relationship between bank efficiency and regulatory compliance is investigated using the (Simar and Wilson 2007) double bootstrapping approach on an international sample of publicly listed banks. Our results indicate that overall BCP compliance, or indeed compliance with any of its individual chapters, has no association with bank efficiency.

From a theoretical perspective, scholars’ predictions as to the effects of regulation and supervision on bank performance are conflicting. The greater part of policy literature on financial regulation has been inspired by the broader debate on the role of government in the economy. The two best-known opposing camps in this field are the public interest and the private interest defenders, who both, nonetheless, agree on the assumption of market failure. For the public interest camp, governments regulate banks to ensure better functioning and thus more efficient banks, ultimately for the benefit of the economy and the society. For the private interest camp, regulation is a product of an interaction between supply; it is thus the outcome of private interests who use the coercive power of the state to extract rents at the expense of other groups.

According to the public interest view, which largely dominated thinking during the 20th century, regulators have sufficient information and enforcement powers to promote the public interest. In this setting, well-conceived regulation can exert a positive effect on firm behavior by fostering competition and encouraging effective governance in the sector. In contrast, according to the private interest view, efficiency may be distorted because firms are constrained to channel resources to special-interest groups. This implies that regulation may not play a role in improving bank efficiency. Kane (1977) suggested that these conflicting views help frame the complex motivations underlying regulatory policies. He argues that officials are subject to pressures to respond to both public and private interests, and that the outcome of such an oscillation depends on incentives. Swings in the approach to regulation reflect the interplay of industry and political forces and the occurrence of exogenous shocks (crises for example). These complex interactions may have conflicting effects on the efficiency of the banking system.

We focus on the adoption of international capital standards and the Basel Core Principles for Effective Bank Supervision (BCP). These principles, issued in 1997 by the Basel Committee on Bank Supervision, have since become the global standards for bank regulation, widely adopted by regulators in developed and developing countries. The severity of the 2007–09 financial crisis has cast doubt on the effectiveness of these global standards; regulatory reforms are under way in several countries. The initial crisis-induced assessment of regulatory failure is now giving way to a more complex regulatory dialogue and detailed evaluation of the principles underlying international regulatory standards as well as the implications of their adoption, in terms of banks’ safety and soundness. In addition, the burden of compliance with international regulatory standards is becoming increasingly onerous, and financial institutions worldwide are developing compliance frameworks to enable management to meet more stringent regulatory standards. As regulators refine and improve their approach and methodologies, banks must respond to more stringent compliance requirements. This has implications for risk management and resource allocation, and, ultimately, on bank performance.

On the regulators’ side, excessive reliance on systematic adherence to a checklist of regulations and supervisory practices might hamper regulators’ monitoring efforts and prevent a deeper understanding of banks’ risk-taking. More specifically, to shed some light on the aforementioned issues, we aim to answer the following questions: (i) Does compliance with international regulatory standards affect bank operating efficiency? (ii) By what mechanisms does regulatory compliance affect bank performance? (iii) To what extent do bank-specific and country-specific characteristics soften or amplify the impact of regulatory compliance on bank performance? (iv) Does the impact of regulatory compliance increase with level of development?

Building on the IMF and the World Bank Basel Core Principles for Effective Bank Supervision (BCP) assessments conducted from 1999 to 2010, we evaluate how compliance with BCP affects bank performance for a sample of 863 publicly listed banks drawn from a broad cross-section of countries. We focus on publicly listed banks, on the assumption that these institutions are subject to more stringent regulatory controls and compliance requirements. This focus should also enhance cross-country comparability because these banks share internationally adopted accounting standards. Further, we categorize the sample countries by both economic development and geographic region.

Our results indicate that overall BCP compliance, or indeed compliance with any of its individual chapters, has no association with bank efficiency. This result holds after controlling for bank-specific characteristics, the macroeconomic environment, institutional quality, and the existing regulatory framework, and adds further support to the argument that although compliance has little effect on bank efficiency, increasing regulatory constraints may prevent banks from efficiently allocating resources. When only banks in emerging market and developing countries are considered, we find some evidence of a negative relation with specific chapters that relate to the effectiveness of the existing supervisory framework and the ability of supervisors to carry out their duties. However, these results need to be treated with caution, because they may also reflect the inability of assessors to provide a consistent cross-country evaluation of effective banking regulation.

RBA Cuts To Record Low – 2%

The RBA cut the cash rate by 25 basis points today, in the hope that i) households who are already carrying record debt will be persuaded to spend and borrow more, and ii) the “quiet word” from the regulator will keep a cap on exploding house prices in Sydney by controlling exuberant investment lending.  The journey back from this record low will be low and painful, and if a real crisis hits, there is so little left in the locker. Worth re-reading the recent Fitch commentary on the US who are facing a high debt, higher interest rate future.

At its meeting today, the Board decided to lower the cash rate by 25 basis points to 2.0 per cent, effective 6 May 2015.

The global economy is expanding at a moderate pace, but commodity prices have declined over the past year, in some cases sharply. These trends appear largely to reflect increased supply, including from Australia. Australia’s terms of trade are falling nonetheless.

The Federal Reserve is expected to start increasing its policy rate later this year, but some other major central banks are stepping up the pace of unconventional policy measures. Hence, financial conditions remain very accommodative globally, with long-term borrowing rates for sovereigns and creditworthy private borrowers remarkably low.

In Australia, the available information suggests improved trends in household demand over the past six months and stronger growth in employment. Looking ahead, the key drag on private demand is likely to be weakness in business capital expenditure in both the mining and non-mining sectors over the coming year. Public spending is also scheduled to be subdued. The economy is therefore likely to be operating with a degree of spare capacity for some time yet. Inflation is forecast to remain consistent with the target over the next one to two years, even with a lower exchange rate.

Low interest rates are acting to support borrowing and spending, and credit is recording moderate growth overall, with stronger lending to businesses of late. Growth in lending to the housing market has been steady over recent months. Dwelling prices continue to rise strongly in Sydney, though trends have been more varied in a number of other cities. The Bank is working with other regulators to assess and contain risks that may arise from the housing market. In other asset markets, prices for equities and commercial property have been supported by lower long-term interest rates.

The Australian dollar has declined noticeably against a rising US dollar over the past year, though less so against a basket of currencies. Further depreciation seems both likely and necessary, particularly given the significant declines in key commodity prices.

At today’s meeting, the Board judged that the inflation outlook provided the opportunity for monetary policy to be eased further, so as to reinforce recent encouraging trends in household demand.

The Macroeconomic Effects of Public Investment

An IMF working paper was released today entitled “The Macroeconomic Effects of Public Investment:Evidence from Advanced Economies”. Six years after the global financial crisis, the recovery in many advanced economies remains tepid. This is highly relevant to the current Australian economic and budget debate.

There are now worries that demand will remain persistently weak — a possibility that has been described as “secular stagnation”. One response that is being considered (see for example the European Commission 2014) is an increase in public infrastructure investment, which could provide a much-needed fillip to demand and is one of the few remaining policy levers available to support growth. But there are open questions about the size of the public investment multipliers and the long-term returns on public capital, both of which play a role in determining how public-debt-to-GDP ratios will evolve in response to higher public investment. To assess appropriately the benefits and costs of increasing public investment in infrastructure, it is critical to determine what macroeconomic impact public investment will have. The paper attempts to shed more light on this subject.

What are the macroeconomic effects of public investment? To what extent does it raise output, both in the short and the long term? Does it increase the public-debt-to-GDP ratio? How do these effects vary with key characteristics of the economy, such as the degree of economic slack, the efficiency of public investment, and the way the investment is financed? To address these questions, the paper examined the historical evidence on the macroeconomic effects of public investment in 17 OECD economies over the 1985–2013 period.

They found that such investment raises output in both the short and long term, crowds in private investment, and reduces unemployment, with limited effect on the public debt ratio. They also found that these effects vary with a number of mediating factors. The effects of public investment are particularly strong when there is slack in the economy and monetary accommodation. In such cases, the boost to output from higher government investment may exceed the debt issued to finance the investment. Government projects are more effective in boosting output in countries with higher efficiency of public investment. Finally, the mode of financing investment matters. They find suggestive evidence that debt-financed projects have larger expansionary effects than budget-neutral investments financed by raising taxes or cutting other government spending.

The findings suggest that for economies with clearly identified infrastructure needs and efficient public investment processes and where there is economic slack and monetary accommodation, there is a strong case for increasing public infrastructure investment. Moreover, evidence suggests that increasing public infrastructure investment will be particularly effective in providing a fillip to aggregate demand and expanding productive capacity in the long run, without raising the debt-to-GDP ratio, if it is debt financed. Finally, the results show how critical increasing investment efficiency is to mitigating the possible trade-off between higher output and higher public-debt-to-GDP ratios. Thus a key priority in many economies, particularly in those with relatively low efficiency of public investment, should be to raise the quality of infrastructure investment by improving the public investment process.

.

ANZ 1H 2015 Results 3% Higher

ANZ released their results for 1H 2015 today. They reported a statutory profit of $3,506m up 3% from 1H14, and a cash profit of $3,676m, up 5% from 1H14. This was slightly better than expected. The result was driven by significant growth in customer deposits (up 12%) and advances (up 10%) and a provision charge of $510 million down 3%. The Group total loss rate saw a modest decline over the year, from 21bps to 19bps and ANZ’s expectation is that the loss rate will stabilise in 2H15. It expects to be operating in a lower growth operating environment going forwards.

A 4% increase in the Interim Dividend to 86 cents per share will see ANZ shareholders receive $2.4 billion, of which around 73% will be delivered to Australian based Retail and Institutional investors. ANZ expects to maintain a payout ratio for the Financial Year 2015 towards the upper end of the 65 to 70% of Cash Profit range.

ANZ’s Capital Ratio at the end of the first half was 8.7%, up 40 basis points (bps) on the same half in 20144. This half the Dividend Reinvestment Plan will operate with a 1.5% discount which is expected to result in a participation ratio of around 20% on a full year basis.

Looking across the divisions, in Australia, profit grew 8%, driven by a 6% uplift in both income and profit before provisions. Customer numbers, business volumes and market share all grew driven by investment in products, sales and service capacity and capability. Additional staff and training, new and improved digital tools including online applications, expanded customer coverage and improved service levels delivered increased Retail loan volumes, up 8% and C&CB loan volumes, up 4%. Deposits increased 3% and 6% respectively. Home lending has now grown above system for five consecutive years. Retail net interest margin fell 5 basis points from 2.01% in 2H2014 to 1.97%. The C&CB Business delivered ongoing growth despite subdued business sector confidence. ANZ’s historic strength in the Small Business Banking (SBB) segment continued with lending up 15% having grown at double digit rates for the past 3 years. Deposits in SBB have also grown strongly and at $31 billion, are more than double the level of loans.

International and Institutional Banking increased profit by 7% with strong contributions from Global Markets customer sales and the Cash Management business along with ongoing benign credit outcomes. PBP increased by 1%. Geographically, Asia Pacific Europe and America (APEA) was the standout, with profit up 18%. In Asia, customer revenues increased 13%, largely through increased focus on lower capital intensity, higher return products like Foreign Exchange, Cash Management and Debt Capital Markets. ANZ is also growing strongly in the region’s key trade and investment flow corridors including those between Australia and Hong Kong, China and Hong Kong and Australia and Singapore.

In the Trade business while volumes were broadly maintained, deteriorating commodity prices reduced the value of shipments, lowering income slightly. Lending growth across the network partially offset ongoing loan margin compression which is being felt most acutely in Australia. The quality of the loan book remains high, at 79% investment grade. Deposits increased 17%, including a 27% increase in deposits in APEA. The percentage uplift in both deposits and lending in part reflects the depreciation of the Australian Dollar during the period. A record Global Markets revenue result was in large part delivered via a record customer sales outcome, most notably in Asia. Increased activity particularly in rates, commodities and FX, assisted sales in the second quarter of the year.

In New Zealand (all figures in NZD), the business has increased momentum, with income growth of 6% and profit before provisions up 8%. Economic momentum has lifted lending volumes.  Profit growth after provisions was up 1% reflected a lower level of provision write-backs than in the prior comparable period. Home lending lifted 6% with market share increasing in key regions like Auckland and Christchurch. Streamlined products and processes along with digital tools helped lift Commercial and Agri business with lending up 6%.

Focussing on the Australian mortgage performance, which made up 69% of the Australian division credit exposure, there was more growth in NSW (1x3x system) than other states. Investment lending share increased, growing at system, and more loans were originated via the broker channels at 1.3x system. ANZ has been growing is mobile lender base, with a 50% increase in NSW.

ANZ-Home-Loans-Portfolio-May-2015Total home lending was $218 bn, up 8% net, with 934k loan accounts. The average balance at origination was $376k, (much higher than Westpac at $235k), the average LVR was 71% at origination (same as Westpac).

ANZ-Dynamic-LVR-May-201543% of the portfolio was ahead on repayments (Westpac was 73%) and 35% of the portfolio is interest only. 90+ day delinquencies were 5.7 basis points with highest rates in Queensland. Note this excludes non-performing loans.

ANZ-Mortgage-Delinqu-May-2015

Building Approvals Up Again, Especially Units In NSW

Australian Bureau of Statistics (ABS) Building Approvals show that the number of dwellings approved rose 1.8 per cent in March 2015, in trend terms, and has risen for ten months. This continued strength was driven by increases in new flats, units or apartments in residential buildings.

The value of total building approved rose 0.9 per cent in March, in trend terms, and has risen for nine months. The value of residential building rose 2.5 per cent while non-residential building fell 2.8 per cent in trend terms.

Building-Approvals-March-2015
The number of dwelling approvals increased in March in New South Wales (4.4 per cent), Tasmania (3.3 per cent), Queensland (3.0 per cent) and Victoria (1.2 per cent) but decreased in Northern Territory (14.6 per cent), Australian Capital Territory (3.8 per cent), Western Australia (1.9 per cent) and South Australia (1.7 per cent) in trend terms.

There are significant state variations with regards to the proportion of approvals relating to houses, lowest in the Sydney region.

Houses-By-state-Mar-2015In trend terms, approvals for private sector houses rose 0.2 per cent in March. Private sector houses rose in New South Wales (1.8 per cent) and Victoria (1.1 per cent) but fell in South Australia (1.3 per cent), Western Australia (1.3 per cent) and Queensland (0.9 per cent).

The trend value of residential building rose 2.5% and has risen for 12 months. The value of non-residential building fell 2.8% and has fallen for four months.  The 6 month average value moments highlights the state variations, with NSW hot, and WA coming off.

Building-Value-By-State-March-2015

Westpac 1H 2015 Result Flat

Westpac announced their 1H results today, with cash earnings of $3,778 million, flat compared with the prior corresponding period and 2% lower than 2H14. Statutory net profit was $3,609 million, flat on 1H14, and 8% lower than 2H14. The expense to income ratio was 42.5% from 41.2% and there was a further improvements in asset quality with impaired assets as a percentage of gross loans falling 16 basis points to 0.35%. Whilst provisions were down, and net margins maintained at 2.01% (excluding treasury), weaker treasury income eroded the overall performance. Overall result was a little below consensus forecasts. The interim fully franked dividend was 93 cents per share, up 3% from 1H14, but 1% from 2H14.

Retail banking did quite well, but the Investment bank earnings were 17% lower due to the $85 million post tax charge as a result of derivative adjustments and a lower impairment benefit, despite customer revenues rising 6% and strong lending growth.

We see indications of building headwinds ahead relating to capital requirements, significant deposit repricing to offset mortgage discounts, and a continued reliance on the mortgage book to underpin growth. We also note a tightening of lending criteria in terms of interest rate buffers, and an intent to reduce investment property lending to below the 10% growth “alert” level. We, in other words, see responses to the dead hand of the regulator.

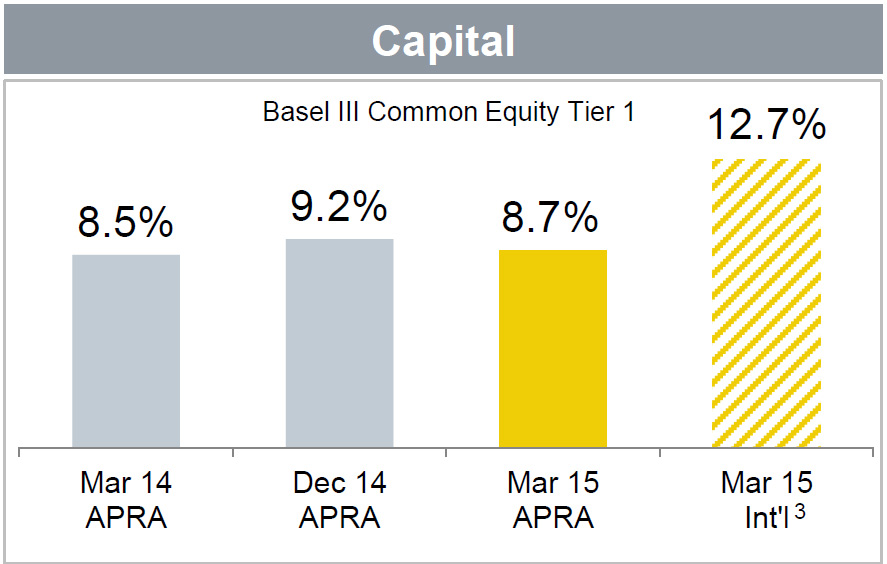
The Group’s common equity Tier 1 (CET1) capital ratio of 8.8% is well above regulatory minimums. However, due to other items, including changes in mortgage risk factors implemented during the half, the ratio is currently at the lower end of the Group’s preferred capital range of 8.75% to 9.25%. Given the current uncertainty over future capital settings, including the introduction of the next set of reforms from the Basel Committee on Banking Supervision, and the Federal Government’s assessment of the final recommendations from the Financial System Inquiry, the Group will operate at the upper end of the preferred capital range. So the Group will issue shares to satisfy the DRP for the interim dividend (at a 1.5% discount), and partially underwrite the DRP to increase CET1 capital by approximately $2 billion.

Overall net operating income was up 1%, and within that, net interest income rose 2%, supported by growth of 3% mostly from rise in Australian mortgages, and customer deposit growth of 3%, with focus on growing efficient deposits. However, net interest margin were down 1bp due to lower Treasury revenue. Margins excluding Treasury and Markets were overall flat. Turning to non-interest income, it was down 2%, whilst fees and commissions were up 1% to $1,478m, wealth and insurance fell 1% to $1,134m, trading income was  down 10% to $425m (up 16% excluding derivative adjustments) and other income was down 17% to $49m.

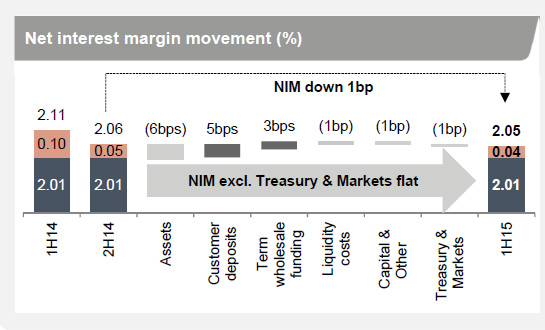
Net Interest Margin was down 1 bp to 2.05%. NIM up across WRBB (1bp), New Zealand (2bps), and slightly down in St.George (2bps). Most margin pressure was in WIB (down 11bps). NIM excluding Treasury and Markets flat at 2.01%. Within that, we see a 6bps decrease in asset spreads primarily from impact of competitive pricing in mortgages. Business and institutional spreads also lower,  5bps increase from improved customer deposit spreads on term deposits, online accounts and savings deposits, partially offset by 1bps impact of lower hedging benefit on low-rate deposits, 3bps benefit from term wholesale funding as pricing for new term senior issuances was lower than maturing deals, 1bp decrease from increased holdings of high quality liquid assets and cost of CLF and 1bp decline in capital and other due to lower hedging rates.  Treasury and Markets down 1bp, reflecting lower Treasury earnings.

WBC-NIM-May-2105
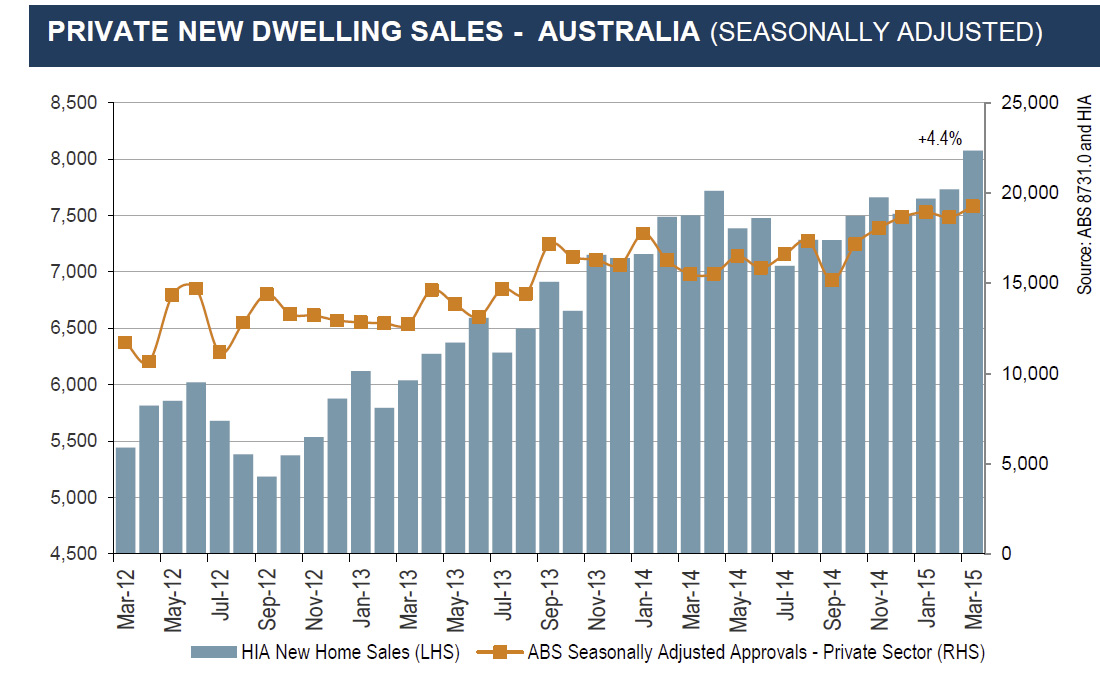
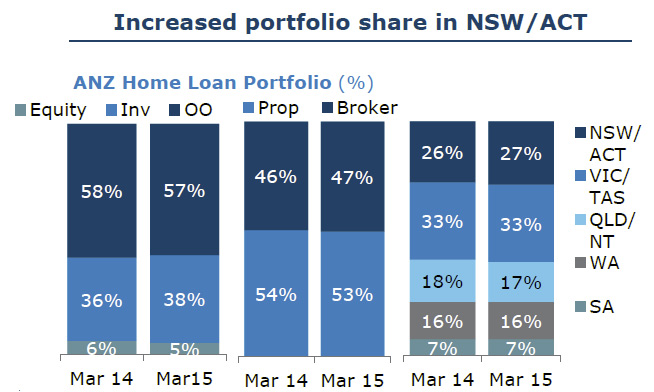
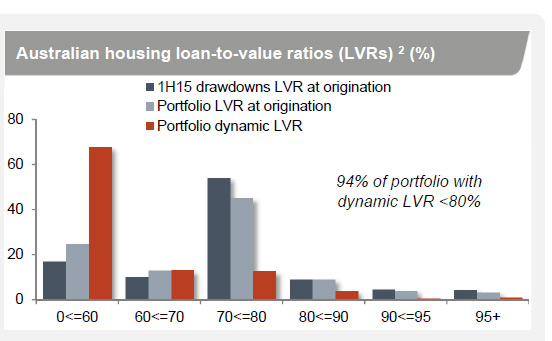
Looking at the Australian mortgage business, they have an Australian mortgage market share of 23.1% and the book grew by 0.9x system. The 3% lift in balances was partly offset by run-off of $25.2bn, up 6%. Around 20% of loans were above 80% LVR, little changed from last period, with the average LVR on new loans at 71%. 53.2% of new loans were through WBC’s proprietary channels, the share via brokers therefore continuing to rise (1H14 was 57.5% through own channels).

WBC---LVR-May-2015
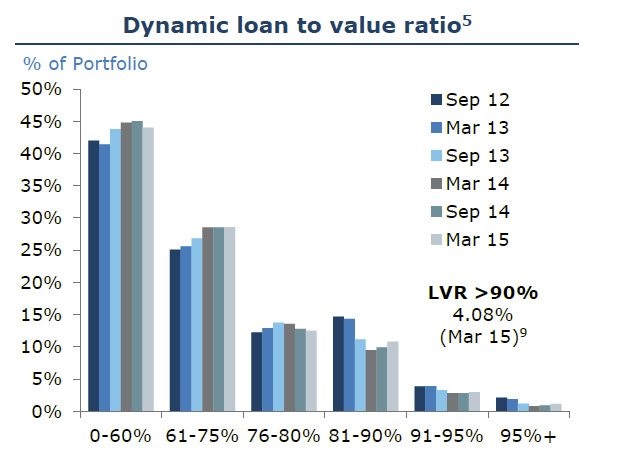
Portfolio losses of $38m in 1H15 represent an annualised loss rate of 2bps (net of insurance claims) and loss rates remain very low by international standards. Mortgage insurance claims for 1H15 were $1m (2H14 $6m, 1H14 $3m).  Properties in possession remain <2bps of the portfolio, however have increased, mainly in Qld, where natural disasters and a decline in mining investment have seen weaker conditions and a review of treatment of hardship will likely see a rise in reported delinquencies in future periods.

WBC-Mort-Del-May-2015
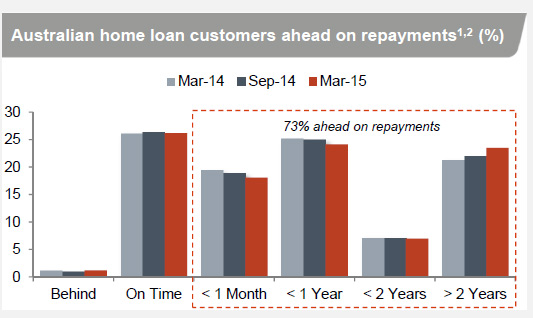
Australian mortgage customers continue to display a cautious approach to debt levels, taking advantage of historically low mortgage rates to pay down debt and build buffers. Including mortgage offset account balances, 73% of customers are ahead of scheduled payments, with 23% of these being more than 2 years ahead. Mortgage offset account balances up $3.3bn or 14% (up 29% 1H15/1H14) to $27bn. Credit decisions across all brands are made by the Westpac Group, regardless of the origination channel.

Westpac has made significant changes to their serviceability assessment. Loan serviceability assessments include an interest rate buffer, adequate surplus test and discounts to certain forms of income (e.g. dividends, rental income). Westpac now has a minimum assessment rate, often referred to as a floor rate, set at 7.10% p.a. The minimum assessment rate is at least 210bps higher than the lending rate and is applied to all mortgage debt, not just the loan being applied for. We note that the minimum assessment rate and buffer has increased from 6.80% p.a. and 180bps respectively – the regulators quiet word perhaps?

WBC-PayAhead-May-2015
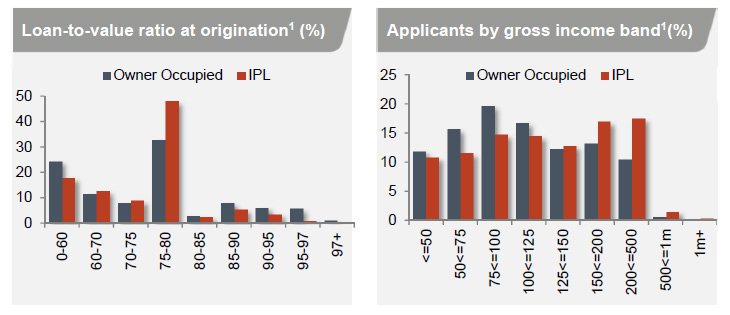
Investment property loans (IPLs) are 46.3% of Westpac’s Australian mortgage portfolio and compared to owner-occupied applicants, IPL applicants are on average older (75% over 35 years), have higher incomes and higher credit scores. 87% of IPLs originated at or below 80% LVR. Majority of IPLs are interest-only, however the repayment profile closely tracks the profile of the principal and interest portfolio, and 62% of interest-only IPL customers are ahead on repayments.  IPL 90+ days delinquencies is 36bps and continue to outperform the total portfolio average. IPL portfolio losses represent an annualised loss rate of 2bps (net of insurance claims) – in line with total portfolio losses of 2bps. Self-managed Superannuation Fund balances are a very small part of the portfolio, at 1% of Australian mortgage balances.

We are told that All IPLs are full recourse and loan serviceability assessments include an interest rate buffer, minimum assessment rate, adequate surplus test and discounts to certain forms of income (e.g. dividends, rental income). In adiditon, all IPLs, including interest-only loans, are assessed on a principal & interest basis and specific credit policies apply to IPLs to assist risk mitigation, including holiday apartments subject to tighter acceptance requirements, additional LVR restrictions apply to single industry towns, minimum property size and location restrictions apply, restrictions on non-resident lending include lower maximum LVR and discounts to foreign income recognition.

WBC-IPL-May-2015Westpac says it had more than 10% growth in investment loans (which may trigger interest from APRA and potentially additional capital), so it is actively managing the number down to 10%. We suspect this translates into tighter underwriting criteria. That said, bank portfolio stress testing indicates that even under extreme scenarios, losses, including those via their captive Lenders Mortgage Insurer would be manageable.

They predict that investment property lending will remain buoyant and that whilst the property market supply is not meeting demand, the market is fundamentally sound.

Turning to capital, Westpac’s preferred common equity Tier 1 (CET1) capital range is 8.75% – 9.25%. The management buffer above regulatory minimums takes into consideration the capital conservation buffer (CCB) requirement from January 2016, stress testing to maintain an appropriate buffer in a downturn, quarterly volatility of capital ratios associated with dividend payments. Given current regulatory uncertainties the Group has decided it is appropriate to move capital ratios to the upper end of the preferred range and will be issuing shares to satisfy the DRP at a 1.5% discount. They flag a number of potential capital headwinds.  These include, RBNZ changes to risk weighting of investor property loans,  BCBS2 initial consultation on standardised approach for determining Credit RWA and consults on RWA capital floors for advanced banks, proposals announced December 2014 with first consultation due mid-2015. BCBS work plan target date for completion end 2015. Implementation date and transition arrangements to be advised.  In addition, they are awaiting Government and APRA response to provide more information on implementation of FSI recommendations, leverage ratio disclosure expected during 2015 and applicable (Pillar 1) from 2018, FSB3 undertaking a QIS4 on TLAC5 during 2015 with rules for G-SIBs expected to be finalised at G20 summit in 2015. D-SIB impacts unknown and risk model enhancements and recalibrations – IRRBB. Net net, as we have discussed we expect capital demands to be raised in the future, and this will require the bank to lift its capital buffers.

AU$ Movements Before RBA Rate Releases Were “Normal” – ASIC

ASIC today released an update on their investigations into AU$ trading movements around the time of recent RBA target rate announcements. Whilst their investigations are ongoing, ASIC says the movements are related to liquidity positions and computer based trading, and do not indicate cases of market misconduct.

ASIC today provided an update on its investigation into the movements in the Australian dollar shortly before the Reserve Bank’s monetary policy decisions for February, March and April 2015.

The enquiry is investigating trading in the dollar in the minute prior to the RBA’s interest rate decision statement at 2.30pm.

ASIC has made extensive enquiries into the management of the information flow regarding the RBA’s interest rate decision prior to the announcement of this decision.

ASIC’s current focus is on reviewing the trading behaviour of a number of foreign exchange markets and platforms including interest rate futures markets and CFD platforms providing foreign exchange markets. Notices to produce trading information have been sent to many financial institutions and platform providers to understand the basis of the trading on these markets at the point in time of interest.

ASIC’s enquiries are ongoing as to the cause of the swings in the currency markets. Preliminary findings reveal moves in the Australian Dollar ahead of the announcement to be as a result of normal market operations in an environment of lower liquidity immediately ahead of the RBA announcement. The reduction in liquidity providers is a usual occurrence prior to announcement in all markets. Much of the trading reviewed to date was linked to position unwinds by automated trading accounts linked to risk management logic and not misconduct.

In particular, ASIC has observed liquidity being withdrawn from the market at the same moment as participants already positioned were considering their risk exposure too large ahead of the announcement and reducing their position. This lack of liquidity distorted the execution logic in the algorithms of some participant systems. This, along with a fall in trading volumes leading up to the release of key market data, means trades may have had a more pronounced impact on the price than they otherwise would.