New Vehicle Sales Up, A Little

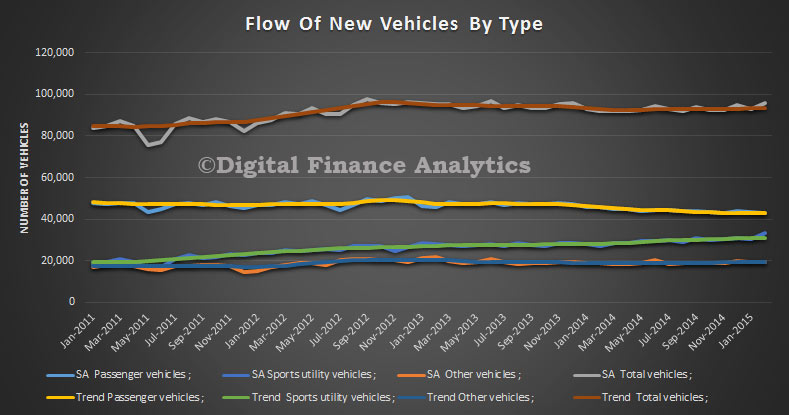
The ABS released the February 2015 New Vehicle Sales data today. In trend terms, February 2015 (93 432) has increased by 0.2% when compared with January 2015, whilst the seasonally adjusted estimate (95 737) has increased by 2.9% when compared with January 2015.

Sales of Sports utility and Other vehicles increased by 0.7% and 0.1% respectively. Over the same period, Passenger vehicles decreased by 9 units, whilst the seasonally adjusted sales of Passenger and Other vehicles decreased by 0.9% and 0.3% respectively. Over the same period, Sports utility vehicles increased by 10.5%.

Feb-Vehciles-By-TypeFive of the eight states and territories experienced an increase in new motor vehicle sales when comparing February 2015 with January 2015 in trend terms. Tasmania recorded the largest percentage increase (1.7%), followed by Queensland (0.6%) and both Victoria and South Australia (0.3%). Over the same period, Western Australia, the Northern Territory and the Australian Capital Territory all recorded decreases in sales of 0.3%.
All states and territories experienced an increase in new motor vehicle sales when comparing February 2015 with January 2015 in seasonally adjusted terms. The Northern Territory recorded the largest percentage increase (22.4%) followed by South Australia (8.8%) and the Australian Capital Territory (5.9%).

Is Higher Market Volatility The New Normal?

Chris Salmon, Executive Director, Markets, Bank of England, gave a speech “Financial Market Volatility and Liquidity – a cautionary note”. He suggests that financial market conditions have changed quite noticeably over the past year or so, with significantly higher volatility. For example, on 15 October and 15 January the immediate intra-day reaction to the news was unprecedented. The intra-day change in 10-year US bond yields was 37 bps, with most of this move happening within just an hour of the data release. The intraday range represented nearly eight standard deviations, exceeding the price moves that happened immediately following the collapse of Lehman Brothers. On 15 January, the Swiss franc appreciated by 14%. The intraday range was several times that number, and market participants continue to debate the highest traded value of the franc on the day.

Could such events could imply that a number of major asset markets may have become more sensitive to news, so that a given shock causes greater volatility? Is this the new normal?

If so, what is the root cause? We know the macroeconomic outlook has changed and perhaps become less certain. Central banks have reacted, and in some cases pushed the innovation envelope further. Unsurprisingly these developments have been associated with more volatile financial markets. Given that policy-makers have previously been concerned that persistently tranquil financial markets could encourage excessive risk-taking, this development is not necessarily an unwelcome development. But recent months have also seen a number of short episodes of sharply-higher volatility which coincided with periods of much impaired market liquidity. There are good reasons to believe that the severity of these events was accentuated by structural change in the markets. There must be a risk that future shocks could have more persistent and more widespread impacts across financial markets than has been the case in the recent past.

Whilst market intelligence suggests that uncertainty surrounding the global outlook has been one factor; itself in no small part a consequence of the unexpected rough halving in the price of oil since last summer. This uncertainty can be seen in the recent increase in the dispersion of economists’ forecasts for inflation in the US, UK and euro area during 2015. Central banks themselves have reacted to the changed global outlook and monetary policy makers have been active in recent months. Indeed, so far this year 24 central banks have cut their policy rates. Moreover, the decisions by the ECB and three other central banks since last summer to set negative policy rates have raised questions about where the lower bound for monetary policy exists.

But he suggests there are two other factors in play, which may indicate a more fundamental change, and lead to continuing higher volatility.

First, market makers have become more reluctant to commit capital to warehousing risk. Some have suggested that this reflects a combination of reduced risk tolerance since the financial crisis, and the impact of regulation designed to improve the resilience of the financial system. This reduction in market making capacity has been associated with increased concentration in many markets, as firms have been more discriminating about the markets which they make, or the clients they serve. And this trend has gone hand-in-hand with a growth in assets under management by the buy-side community. The combination has served to amplify the implications of reduced risk warehousing capacity of the intermediary sector relative to the provision of liquidity from market makers during times of market stress relative to the past.

The second is the evolution of the market micro-structure. Electronic platforms are now increasingly used across the various markets. In some cases regulation has been the cause but in others, such as foreign exchange markets, firms have over a number of years increasingly embraced electronic forms of trading. This includes using ‘request-for-quote’ platforms to automate processes previously carried out by phone. Electronic platforms are effective in pooling liquidity in ‘normal’ times but may have the potential, at least as currently calibrated and given today’s level of competition, to contribute to discontinuous pricing in periods of stress if circuit-breakers result in platforms shutting down. There has been much commentary about the temporary unavailability of a number of electronic trading platforms in the immediate aftermath of the removal of the Swiss franc peg.

Regulatory Changes And The Fixed Income Market

Guy Debelle, Assistant Governor (Financial Markets) gave a speech on “Global And Domestic Influences on the Australian Bond Market.” He covered some of the important up coming regulatory changes.

One global development that has garnered a large amount of comment of late is the effect of reduced market-making capacity in fixed income. The Bank for International Settlements (BIS) Committee on the Global Financial System (CGFS), issued a report on this topic late last year. That report documents the intended effect of regulation in bringing about this reduction. There is a debate as to whether the reduction has gone too far, but the fact that market-making activity is lower than it was pre-crisis is a desirable outcome given liquidity risk was under-priced pre-crisis.

Rather than describing it as a reduction in market-making, I think it is more useful to think of it as a reduction in the risk-absorption capacity of intermediaries. Their ability to warehouse portfolio adjustments of asset managers is curtailed. In the past, asset managers were dealing bilaterally with individual trading desks that each had their own limit. Now these limits are applied holistically across the trading desks so that selling one part of a portfolio to one desk will reduce the capacity to sell another part of the portfolio to another desk in the same institution. Asset managers need to take account of these changes in market dynamics in thinking about how they adjust their portfolios. Transactions costs are higher and, in particular, liquidity costs are higher. I am not sure that all market participants have fully appreciated this yet and are fully cognisant of the impact of the post-crisis changes.

The second development to note is in the asset-backed security space. As many of you know, as of 30 June this year, the Bank will introduce mandatory reporting requirements for repo-eligible asset-backed securities (ABS). The Bank continues to work with the industry to ensure the timely implementation of these requirements. The required information, which must also be made available to permitted users, will promote greater transparency in the market, supporting investor confidence in these assets. These requirements will also provide the Bank with standardised and detailed data on ABS, which are a major part of the collateral eligible to be used under the CLF.

In preparation for the introduction of these reporting requirements and to facilitate industry readiness, the reporting system for securitisations was made available for industry testing in November 2014, with voluntary reporting accepted from 31 December 2014. The Bank is currently working with a number of institutions undertaking test submissions, with some institutions expecting to commence regular reporting shortly. The industry is strongly encouraged to undertake testing early to ensure readiness for the commencement of mandatory reporting on 30 June 2015.

The third development is the proposed changes to the settlement convention to T+2 for over-the-counter (OTC) transactions in domestic fixed income securities. The Bank strongly encouraged this initiative. The current standard of T+3 settlement in the Australian market compares unfavourably with many other jurisdictions that have already progressed to shorter settlement cycles for OTC transactions in their domestic fixed income markets. A shorter settlement cycle will reduce the risks associated with settlement, in particular, counterparty risk. Market makers in OTC fixed income securities may particularly benefit from the reduced period of counterparty exposure, as any given trade will count towards internal credit limits for a shorter period of time.  This could boost market turnover and trading capacity for participants. Further, moving to T+2 is likely to encourage straight-through processing, which could reduce the risk of an operational issue affecting the settlement of OTC fixed income securities. Ideally, this would be implemented by the end of 2015.

GE ANZ Consumer Lending Business Sold

GE Capital has sold its Australian and New Zealand consumer lending business to a consortium in a deal valued at US$6.3 billion. This transaction, which needs regulatory approval, will see its three million customers transferred to KKR (the lead bidder), Deutsche Bank and Varde Partners.

The GE business provides personal loans and credit cards to consumers in Australia and New Zealand, as well as interest-free financing for products sold by local retail partners including homewares and electrical-goods retailer Harvey Norman. GE Capital will keep its commercial-finance unit, which provides loans and leasing to midsize businesses in Australia and New Zealand.

Other bidders who missed out, included Apollo Global Management which was a consortium that included Macquarie Group and Pepper Australia and a syndicate headed by TPG Capital, which industry observers had viewed as the most likely winner.

GE is focusing on its industrial businesses in Australia & New Zealand.

The WSJ commented

“the sale of the Australian unit also follows a trend of global banks looking to sell down their consumer-finance businesses as they focus on core operations and free up capital. Standard Chartered PLC in December agreed to sell its consumer-finance units in Hong Kong and Shenzhen as part of its strategy to dispose of noncore businesses, as the Asia-focused lender battles with declining profits and slower growth.

Earlier this month, Citigroup Inc. agreed to sell consumer-finance unit OneMain Financial for $4.25 billion to Springleaf Holdings, as the sprawling global bank continues to pare its operations in the wake of the financial crisis.”

Latest Lending Data Investment Boom

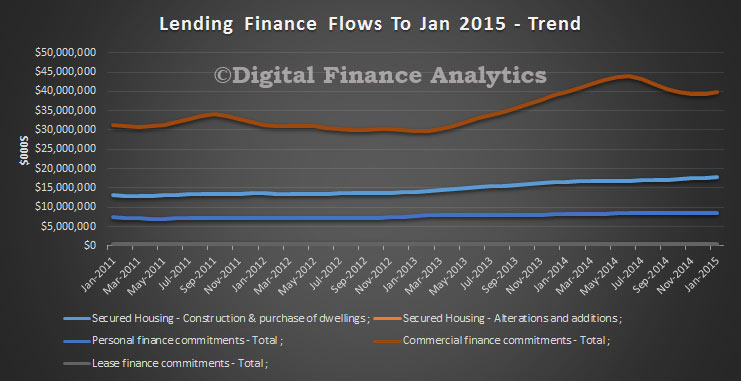
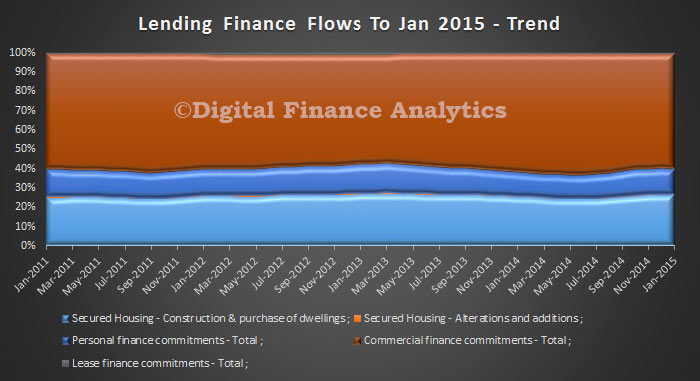
The ABS released their Lending Data to January 2015. The recent trends continue, with a growing investment housing lending sector, at the expense of  other commercial lending. In trend terms, The total value of owner occupied housing commitments excluding alterations and additions rose 0.8%. The trend series for the value of total personal finance commitments fell 0.1%. Revolving credit commitments rose 0.2%, while fixed lending commitments fell 0.3%. The trend series for the value of total commercial finance commitments rose 1.1%. Revolving credit commitments rose 6.6%, while fixed lending commitments fell 1.0%. The trend series for the value of total lease finance commitments fell 2.5% in January 2015.

LendingMixJan2015We see a slight fall in relative terms in commercial lending, (and in this data. lending for investment housing is included in the commercial category. )

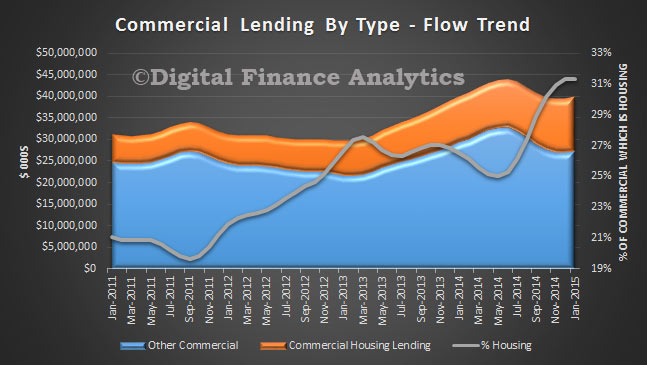
LendingMixPCJan2015But, splitting out the investment housing we see that more than 31% of all commercial lending is for investment housing – and note the consistent trend up from 19% in 2011.

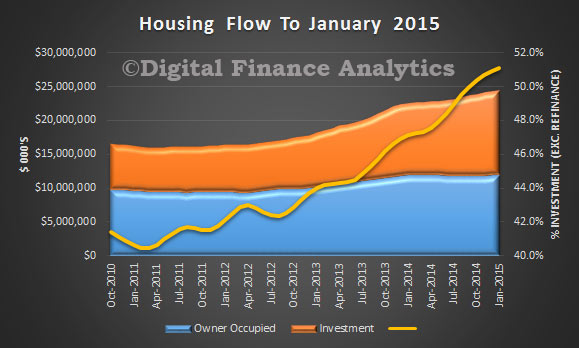
LendingCommercialMixPCJan2015Turning to housing lending, we see investment loan flows were more than 51% of all new loans written (excluding refinance).

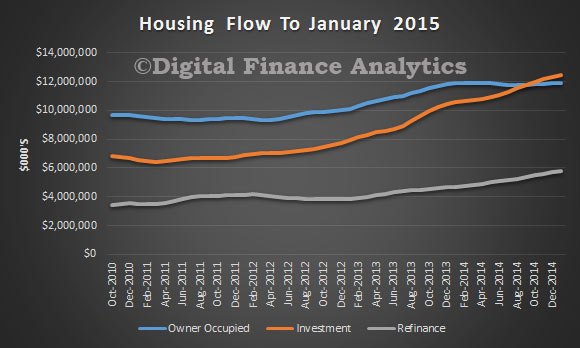
LendingHousingMixPCJan2015In other words, more investment loans than owner occupied loans were written in January 2015.

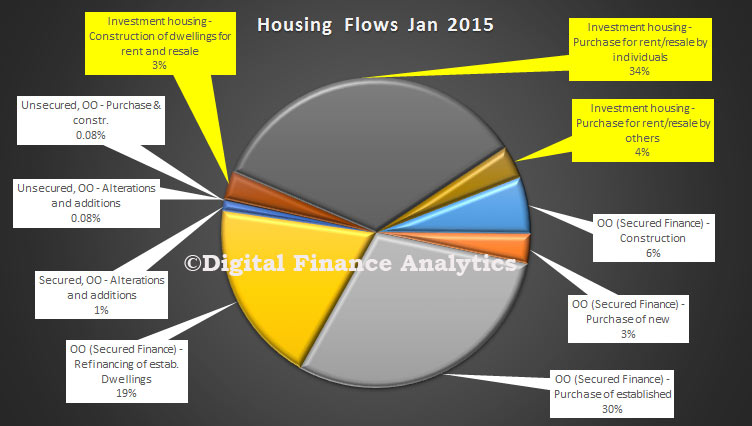
LendingHousingMixJan2015Finally, looking across all housing categories, we see that investment loans made up 41%.

LendingFinancePieJan2015  This momentum in investment lending continues to distort the market. We need proactive intervention, like the recently announced initiatives in New Zealand. I have to say I think APRA is just not cutting the mustard.

US Rates To Stay Low, Thanks To Dollar – Moody’s

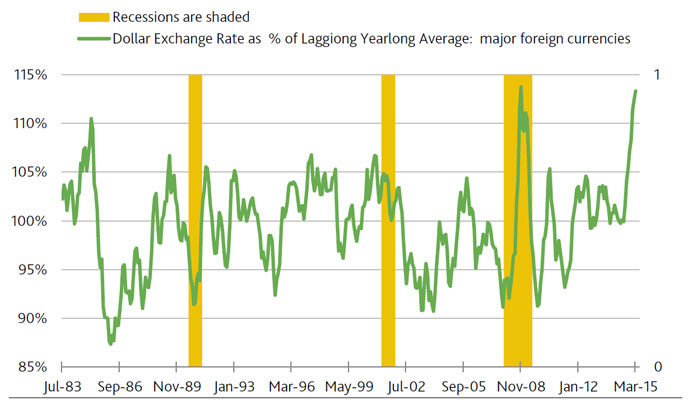
According to Moody’s latest, conceivably, dollar exchange rate appreciation might substitute for a fed funds rate hike. All else the same, the need for a higher fed funds rate recedes as the dollar exchange rate strengthens. A persistently strong dollar is likely to weaken the pricing power of US businesses and labor. Since bottoming in the summer of 2011, the US dollar has soared higher by a cumulative 29% against a basket of major foreign currencies. In the context of an economic upturn, the dollar’s ongoing ascent is the steepest vis-a-vis major foreign currencies since the cumulative 31% surge of the five years ended 2000, or when core PCE price index inflation grew by merely 1.6% annualized, on average, notwithstanding real GDP’s comparably measured growth rate of a scintillating 4.3%.

MoodyMar2015Lately, the strong dollar has put downward pressure on the prices of US exports and imports. February 2015’s -5.9% annual plunge by the US export price index was the deepest such setback on record for a mature US economic recovery. The dollar’s earlier surge of the five-years-ended 2000 saw the US export price index slide by -0.8% annualized, on average. Moreover, February’s price index for US imports excluding petroleum products fell by -1.8% annually. Expect more of the same according to the -1.3% average annualized drop by the US core import price index during the five-years-ended 2000.

Is Low Inflation Good Or Bad?

Mark Carney, Governor, Bank of England, gave a speech on Inflation. I have summarised his arguments in this post because the current low inflation rates around the world have profound implications, and current inflation targets and assumptions reflect earlier responses to hyper inflation, which may not be so relevant now. That said, low inflation appears to carry significant risks, and low interest rates do not help.

16 of 18 inflation targeting economies had inflation below target in January 2015. These include US, UK, Canada, euro area, Norway, Sweden, Switzerland, Australia, China, India, Indonesia, Malaysia, New Zealand, Philippines, South Korea, Taiwan, Thailand and Brazil. 11 of those countries have inflation rates below 1%.

InflationJan2015For example, the Reserve Bank of New Zealand, said yesterday:

“Annual CPI inflation is expected to fall to around zero in the March quarter and remain low over 2015, reflecting the high exchange rate, low global inflation, and the recent falls in petrol prices. Inflation expectations appear to have fallen recently, and we will be closely monitoring the impact of this trend on wage and price setting behaviour, especially in the non-traded sector.”

There are some significant implications of this low inflation environment, especially bearing in mind that these countries are using central bank monetary policy to try and wrangle inflation above 2%. This 2% inflation seems to reflects the lessons of the past, including the fight against high inflation in the 1970s and 1980s, as well as the deflationary disasters that have followed past financial crises. The target is set by government, but managed by the central bank. Indeed, the banks have to explain to the politicians if inflation falls outside the target band. Mark Carney has just written an open letter to the UK Chancellor addressing the current low inflation there.

Whilst high inflation damages growth, in part, because high inflation also tends to be volatile, generating uncertainty that makes important economic decisions more difficult. In contrast, a little inflation ‘greases the wheels’ of the economy, helping it to absorb shocks. A positive average inflation rate also gives monetary policy space to respond to negative shocks by cutting interest rates. Persistently low inflation can be difficult. Deflation proper is potentially dangerous. During the Great Depression, sharp falls in prices reinforced collapsing output and skyrocketing unemployment.

A commonly cited reason is that falling prices prompt households and firms to delay spending and investment. The subsequent reduction in demand causes further reductions in prices through higher unemployment. That further reduces incomes and spending, drawing the economy into the vortex. But there is a more clear and present danger arising from the balance sheets of households and firms should deflation persist. When a household takes out a mortgage or a firm secures a loan, the amount owed is denominated in cash terms – that is, not adjusted for inflation. Unexpected, generalised, and persistently falling prices then mean the real value of debt increases: the same amount of money is owed, but that money now buys more goods and services. As a result, more consumption or investment needs to be foregone to service the debt. This debt-deflation dynamic was at the core of the Great Depression and in the Japanese malaise following the collapse of the asset bubbles of the 1980s. It would be a particular concern if the pace of wage growth were to follow prices down.

Whilst falling oil prices have impacted inflation, even “core inflation” which strips out such volatile factors continues to fall.

Core-Inflation-Jan-2015In some major economies there are additional disinflationary forces. For example, in the euro area, a series of necessary internal devaluations are weighing on wages and prices. In China, a rebalancing of investment and consumption risks generating further disinflation. The producer price inflation rate has been negative for 35 months in a row, reflecting long-standing overcapacity in industries such as concrete and steel, while the more recent weakness in the property market could further increase excess capacity in related sectors. All this suggests a persistent period of low inflation globally is a possibility, and could itself create a self-fulfilling fear of a bad outcome. Concerns that household or government debt will weigh on demand could cause firms to delay further their already weak investment spending. Such rational corporate caution is consistent with the behaviour of many financial asset prices, which appear to be pricing the possibility of material downside tail risks, such as that economic weakness and persistently low global inflation become mutually reinforcing. Those expectations matter as they feed into the wage and price setting processes that ultimately determine inflation.

Protracted global weakness could heighten the challenge of returning inflation quickly to target. That’s because weak global conditions would tend to push down on the equilibrium interest rate that would maintain demand in line with supply and inflation at the target. This equilibrium rate has likely been falling for the last three decades and turned sharply negative in the downturn. This meant central banks had to turn to unconventional policy tools to stimulate their economies in order to return inflation to target. In the cases of the UK and the US, these measures have been effective in supporting domestically generated inflation. Inflation is likely still to be negative in many countries, reflecting an excess of saving over investment.

RBNZ Left Rate Unchanged

The NZ Reserve Bank left the Official Cash Rate unchanged at 3.5 percent.

Global financial conditions remain very accommodative, and are reflected in high equity prices and record low interest rates. However, volatility in financial markets has increased since late-2014 following the sharp drop in oil prices, continued uncertainty about the global outlook and US monetary policy, and policy easings by a number of central banks.

Trading partner growth in 2015 is expected to continue at a similar pace to 2014. Growth remains robust in the US, but has slowed recently in China.

World oil prices are about 50 percent below their June-2014 peak, more reflecting increased supply than demand factors. The fall in oil prices is net positive for global economic growth, but will further reduce inflation in the near term, at a time when global inflation is already very low.

The domestic economy remains strong. The fall in petrol prices has increased households’ purchasing power and lowered the cost of doing business. Employment and construction activity are strong. Net immigration remains high, and monetary policy continues to be supportive. The housing market is showing signs of picking up, particularly in Auckland. However, there are a number of factors weighing on domestic growth, including drought conditions in parts of the country, fiscal consolidation, reduced dairy incomes, and the high exchange rate.

On a trade-weighted basis, the New Zealand dollar remains unjustifiably high and unsustainable in terms of New Zealand’s long-term economic fundamentals. A substantial downward correction in the real exchange rate is needed to put New Zealand’s external accounts on a more sustainable footing.

Annual CPI inflation is expected to fall to around zero in the March quarter and remain low over 2015, reflecting the high exchange rate, low global inflation, and the recent falls in petrol prices. Inflation expectations appear to have fallen recently, and we will be closely monitoring the impact of this trend on wage and price setting behaviour, especially in the non-traded sector.

Monetary policy remains focused on ensuring inflation settles at 2 percent over the medium term. As the economy expands, inflation returns gradually towards the midpoint of the target range.

Our central projection is consistent with a period of stability in the OCR. However, future interest rate adjustments, either up or down, will depend on the emerging flow of economic data.

Reforms To Offshore Banking Units

On 6 November 2013, the Government announced that it would proceed with certain reforms to the Offshore Banking Unit (OBU) regime.These reforms address a number of integrity concerns with the existing regime while ensuring the OBU regime targets mobile financial sector activity. They are now seeking input on proposed changes. Consultation closes for submissions on Wednesday, 8 April 2015

By way of background, an OBU is a notional division or business unit of an Australian entity that conducts OBU activities. To be considered as an OBU, an entity must be declared by the Treasurer as an OBU. An OBU receives concessional tax treatment in respect of eligible OB activities, provided additional criteria are met. One kind of eligible OB activity is a trading activity. Amongst other things, trading activity includes trading with an offshore person in shares, securities and units of an offshore entity, as well as options or rights in respect of these shares, securities and units. As a result, trading in the shares, securities or units (or the associated options or rights) of an offshore subsidiary may constitute an eligible OB activity. This has the effect of allowing the conversion of ineligible non-OB activities to eligible OB activities. That is, the offshore subsidiary may undertake ineligible activities and the OBU may claim the same economic benefit as assessable OB income by trading in the shares it owns in the subsidiary.

Potential activities which could be included:

  • Unfunded lending activities (Unfunded lending is where an OBU makes funds available to an offshore person but the funds are not drawn down, or are yet to be drawn down. Income in the form of fees for making the credit available is mobile income and will be treated accordingly as assessable OB income.)
  • Syndicated lending activities (A syndicated lending arrangement involves a number of financial institutions lending to a borrower. Syndicated arrangements are common in large capital raisings. In addition to committing to lend their own capital, an OBU may be involved in arranging contributions from a syndicate of other lenders. The OBU may also be involved in underwriting some of the credit risk. The OBU will earn a fee for these services.)
  • Guarantee activities and connections with Australia
  • Trading in commodities
  • Securities lending and repurchase agreements
  • Non-deliverable forward foreign currency contracts
  • Portfolio investment asset percentages
  • Advice on disposal of investments
  • Leasing activities

The proposed amendments in the draft Bill are:

  • limit the availability of the OBU concession in certain circumstances where it could otherwise be used to convert ineligible activity into eligible activity by trading in a subsidiary;
  • codify the ‘choice principle’ to remove uncertainty for taxpayers;
  • introduce a new method of allocating certain expenses between the operations of a taxpayer’s domestic banking unit and the OBU;
  • modernise the list of eligible activities; and
  • treat internal financial dealings (for example, between an Australian bank and its offshore branch) as if they were on an arm’s length basis.

OBUThe proposals are likely to lead to greater transparency and clarity, and will offer less wriggle room for financial engineering. Though the changes are mainly technical in nature there could be some implications for banks in Australia.

DFA Household Finance Confidence Index Fell In February

Using data from our household surveys, we have updated our household finance confidence index to end February. We compare the confidence of households now, compared with 12 months ago. The overall index, which is still below a neutral setting, fell slightly again in the month,  despite the RBA rate cut of 25 basis points in February. Households are less confident about their financial health than anytime since December 2012. To calculate the index we ask questions which cover a number of different dimensions. We start by asking households how confident they are feeling about their job security, whether their real income has risen or fallen in the past year, their view on their costs of living over the same period, whether they have increased their loans and other outstanding debts including credit cards and whether they are saving more than last year. Finally we ask about their overall change in net worth over the past 12 months – by net worth we mean net assets less outstanding debts.

FSI-Index-Feb2015Looking at the composite elements in the index, with regards to savings, those comfortable with what they have saved, fell by 1.7%, reflecting mainly lower deposit rates, especially amongst females. Those less comfortable rose a little (0.6%). Those in part-time work had similar ratings to those households unemployed, in contrast to those full time employed. In these charts, the blue is data 12 months to January, and orange is 12 months to February.

FSI-Savings-Feb2015Those households who think their real incomes have grown, fell by 1.8% in the month, whilst those households whose real incomes fell, rose by 1.3%.

FSI-Income-Feb2015Looking at household debt, households who were comfortable with their level of debt fell by 1.1%, though we found males more comfortable with their debt position than females. A slightly higher proportion were as comfortable as 12 months ago.

FSI-Debt-Feb2015Those whose costs of living stablised over the last 12 months rose by 0.5% to 59.3%, helped by lower interest rates, petrol and electricity bills.

FSI-Costs-Feb2015More than half of the households said their net worth had increased over the past year, up by 1.1% for last month. Less households had seen a fall in net worth (down 1.85%)

FSI-Net-Worth-Feb2015Finally a slightly smaller number of households thought their jobs were as secure as a year ago, (down 1.1% to 61.6%), those who felt their jobs were more secure fell (down 0.9%), whilst those felling less secure rose a little (up 0.3%).

FSI-Job-Feb2015Our take is that household financial confidence is still in the doldrums, despite ultra low interest rates and sky high property prices. Their future spending patterns will remain conservative, and we will not see a sudden change in consumption patterns anytime soon. We will update the index again next month.