Digital Business On The Rise – But Potential Untapped

When we released our Small Business Survey, we included a section on the impact of digital business and the internet was having on them. So we were interested in the latest ABS data on IT Use and Innovation in Australian Business. They found that more than one in four Australian businesses had a social media presence as at 30 June 2013, up from one in five the previous year, and nearly a third of Australian businesses received orders via the internet during 2012-13. These orders were worth close to $250 billion, which is an increase of almost $10 billion from the year before.

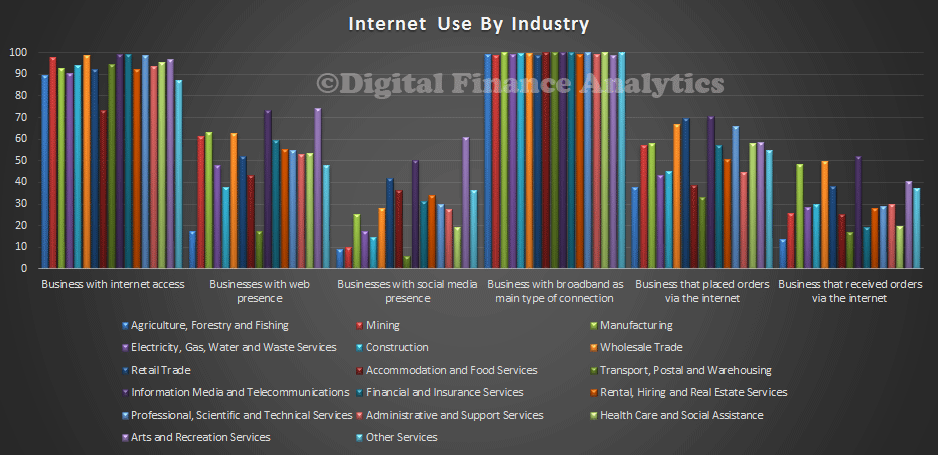
Looking in detail at the data. we find that internet penetration and usage varies by industry. Whilst most businesses now have some form of internet connectivity, a web presence was quite varied, with Arts and Telecommunication/Media most likely to have a web presence, whilst Transport was the least likely. Less than half of Retail businesses receive order via the internet, although more will place orders themselves. Social Media presence varied, with Arts and Media most likely to use this channel. Around 30% of financial services companies use social media, despite the rise of digital banking, as we highlighted in our recent report, the Quiet Revolution.

BusinessIndustry
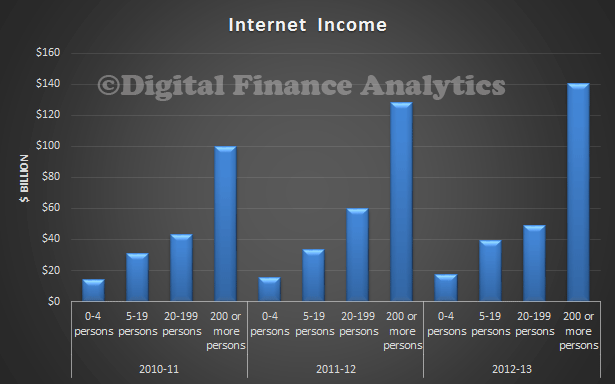
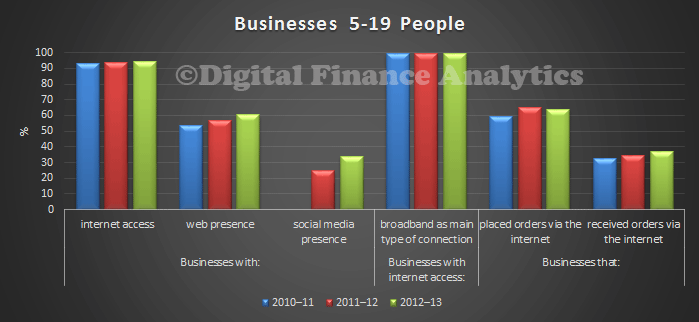
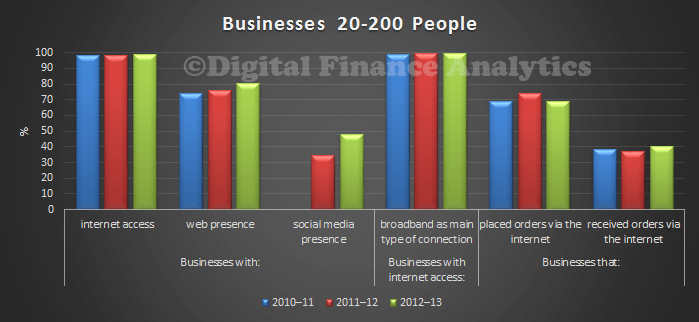
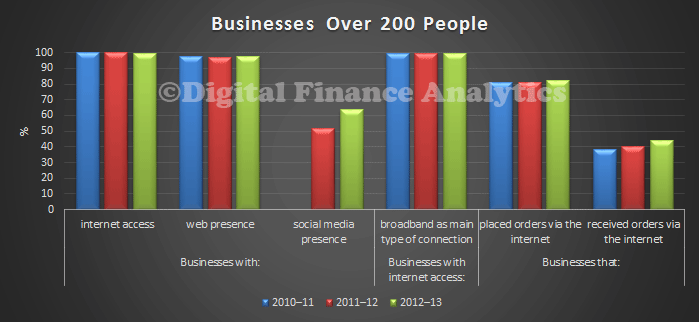
Internet revenue has been rising, and larger business are generating more revenue relative to smaller business.

BusinessInternet
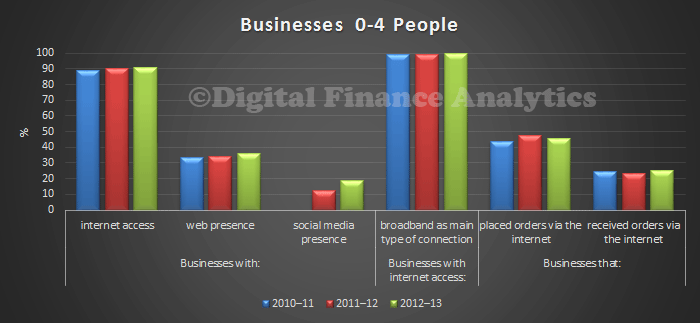
Smaller business tend to be less likely to have a web presence, use social media or receive orders via the internet. Our surveys show that many small business are too busy to exploit digital business, or do not see the true potential of the opportunity.

Business0-4Business4-19 Business20-200 Business200+Overall, we believe that many businesses are yet to fully to embrace the potential of digital business. Consumers are highly connected, mostly via mobile devices, so there is huge potential for innovation. The potential is immense, but requires new ways of thinking.


Investors Still Good To Go – Tax Breaks Ahoy!

Today we look at property investor trends in our household surveys series. We have been following the strong growth in investment lending, so was interested to see what property investors were thinking. Their appetite to invest appears to be slowing as we showed in our earlier post. Looking at those who are thinking about transacting, we find they are still attracted by the potential appreciation of property values, and the tax efficient nature of these investments. Low finance rates are a little less important, whilst getting returns better than deposits was up.

InvestorTransactDFAJun14Turning to the SMSF property investment area, the drivers are quite similar, although the potential for tax efficient investments is significant. They are also attracted by the leverage they can obtain.

InvestorSMSFTransactDFAJun14We have seen some interesting shifts relating to where potential SMSF property investors are getting their advice. The role of real estate agents has diminished in recent months (perhaps in reaction to the strong warnings from ASIC?) whilst mortgage brokers and internet forums and other sites have become more significant. We also see increasing personal knowledge guiding the trustees.

InvestorSMSFAdvisortDFAJun14Our last data point relates to the proportion of superannuation which is aligned to residential or commercial property. The most significant move was in the 10-20% range.

InvestorSMSFDistDFAJun14

How Household Property Buying Intentions Have Changed Since 1995

Today we continue our series on the latest results from our households surveys. Following our recent posts, we had several people ask about trends around some of the metrics we use. We have been running these surveys since 1995. So in this post we present a summary of trends from 1995 onwards. It provides an interesting perspective on how households have changed their behaviour in recent years.

IntentionsDFAJun14To explain the data, the bars show the rising trend in those households who are property inactive (inactive because they do not own property, and do not intend to in the foreseeable future). We show the percentage as a raw split, and also an adjusted split, to take account of population growth across states. The ratio of active to inactive households varies across individual states, and across geographic bands within states.

We also show the proportion of households who said they intended to transact in the next 12 months, and also their expectations, at the time, of house price movements for the next 12 months. Intention to transact was sitting at around 15% of households, until it fell as a result of the GFC. Since that time, it has powered ahead, and is significantly above long term trend – though note the recent fall. Turning to the proportion of households expecting property prices will rise in the coming 12 months, this is more variable, although the long term average prior to the GFC was close to 50%. If fell significantly in 2008 and 2009, before recovering, and reaching a high of 80% in 2013. It is still above long term trend, though falling slightly.

This data highlights the significant demand pressures on the property market, and helps to explain the high prices being achieved, although our interpretation is that the peak is now passed.

Next time we will consider households considering investment property.


Trading Up and Trading Down – Latest Survey Results

We continue our series on the results from our latest household surveys. Today we look at those seeking to trade up, and trade down. These are important segments, as they are both shaping the market.

Looking at up-traders first, these are households looking to sell to buy a larger property. Over one million households fall into this category. There are a number of reasons why households might do this, more space is the single most significant, then comes consideration of the investment potential of their property. Other reasons include life-style changes or job changes. From a trend perspective, the investment aspects of property have become slightly more important.

UpTradersDFAJun14Turning to down-traders, there are about 1.2m households looking to sell with the prospect of buying a smaller property, and/or an investment property. Increased convenience is the most significant reason to move, followed by the wish to release capital for retirement, and next, a switch to an investment property. Other reasons to trade down include illness, death of spouse, and unemployment. From a trend perspective, the demand to release capital for retirement is stronger, whilst unemployment is less significant now. Down traders are less bullish on future property price growth than other sectors. Only 30% of down traders think prices will rise in the next 12 months, whereas across the market 60%+ of households think prices will rise further in coming months.

DownTradersDFAJun14We can look in more detail at households over 60 years. The largest group resides in New South Wales, then Victoria.

State60+DFAJun14Within this group, we find a considerable number of down traders, most of whom are looking to down shift into a smaller place for owner occupation, although some prefer investment properties.

DownTraders60+DFAJun14We can look at where and what they want to buy. We find that the most significant demand from down traders over 60 years is for property closer to the city, and that more than half of these households prefer a unit. About 6% would consider property in a retirement village setting.

DownTradersPropertyType60+DFAJun14We find that certain factors will strongly influence over 60 down-traders considering a retirement village. Here are some of the most important. Price is the most significant factor, followed by access and facilities.

DownTradersRetirementV60+DFAJun14Next time we will look at investors.

Latest First Time Buyer Intentions

We continue updating our findings from our household surveys. Today we look at households who desire to enter the market. We highlighted yesterday that there are more people excluded from the market, but what of those who would like to buy? We start with a summary of households by type. This is the national picture, by segment:

CountChartDFAJun14Here is the data which highlights the large number of want to buys, and the relative small number of first time buyers (defined as those actively seeking). We will discuss the other segments later.

CountDFAJun14Looking at the want to buys, we see the most significant barrier is the level of house prices, in trend terms this is becoming an even more significant issue. Whilst fears of unemployment have fallen a little, concerns about future interest rate rises are up a little and costs of living continue to be a barrier for some.

WanttoBuysDFAJun14Turning to first time buyers, we see high house prices stand out as a constraining factor, whilst finding a place to buy has eased, a little.

FTBDFAJun14We found that there has been a swing towards units, and further from the city. We also see a rise in those who are unsure of what or where to purchase. This is a national picture, and there is considerable state variation which I won’t cover here.

FTBTypeDFAJun14We see some first time buyers continue to consider an investment property alternative, as a way to at least get on the property ladder, even if its in an area in which they do not wish to reside. They are most likely to consider an investment property around edge of the city. Even here they may well be competing with overseas investors!

FTBLocaleDFAJun14Finally, today, we look at which segments are most likely to use a mortgage broker. First time buyers are a little more likely, and well over 50 per cent would consider a broker.

BrokersDFAJun14Next time we will look at some of the other segments.

Property Inactive Households Rise Again, As Market Outlook Slows

Today we start a series on our updated household surveys, which will in due course feed into our next edition of the Property Imperative, due be released later in the year. The current edition, is still available, but there are some significant changes in household intentions since then.

We run our surveys continually, and so incorporate new data each week. The results we will discuss relate to data up to 13th June. We start by looking at the mix of households who are property active and inactive. We define property active households as those who either own, or intend to own a property to live in, or are investing in property, or both. We find that 25.88% of households are inactive. These households will rent, live with family or friends, or have other housing arrangements.

InactivePieDFAJun14Looking at the inactive status trend, we see that more households than ever are excluded from the property market.

InactiveDFAJun14We also see some state variations, with the highest proportion of inactive households founds in Tasmania and South Australia, whilst households in Western Australia, then New South Wales and Victoria have a lower mix of those inactive. That said, the absolute numbers are still increasing in these states too. This is the continuation of a long term trend.

StateInactiveDFAJun14So, next we turn to the active households and begin to look at the more detailed data. We start by looking across our segments, later we will dive more deeply into specific segmental analysis. We start with saving activity trends over time. We see that first time buyers (defined as those seeking to buy for the first time) are still saving hard, but other segments are less inclined or less able to save to purchase a property. Want to buy households (defined as those who would like to buy, but who cannot), are less likely to save than in 2013.

Saving-DFAJun14 Looking at transaction intentions over the next 12 months, we see a significant fall in those investors expecting to enter the market. First time buyers are still being squeezed out, and those seeking to refinance an existing loan are now slightly less likely to transact. Down traders are still active (these are households seeking to sell to buy a smaller property, to release capital, or other factors), though we detect a slowing here too. Therefore we predict that demand for property will decline from recent levels in coming months. This is especially the case in New South Wales and Victoria.

Transact12MonthsDFAJun14 Looking next at borrowing intentions, we see that property investors and up traders are most likely to seeking funding. First time buyers are needing to borrow more also, though as highlighted above they are less likely to transact. Therefore we expect to see some ongoing demand for investment housing funding, but at lower levels than those we saw last year. Funding for owner occupation will likely grow more slowly.

BorrowMore-DFAJun14

Finally, today we look at house price growth expectations. Overall expectation are still quite bullish, but we see a general small fall in the households who believe that house prices will rise in the next 12 months. Down traders are the least bullish.

PrceExpectations12MonthsDFAJun14So our initial findings highlight that we expect momentum in the property market to ease in coming months, even before any interest rate rise. In fact we think that the fall in momentum may postpone potential rate rises, and may begin to turn expectations towards a rate cut, especially if the proposed budget cuts are passed, and the international political scene gets more unstable.

Next time we will start to look at segment specific factors, as each segment exists in its own micro market, and dynamics are quite different.

Housing Finance Was Highest Ever In April

Continuing our analysis of the ABS April 2014 lending data, it is worth looking at the overall housing finance data. Total lent, including owner occupied and investment secured lending, refinance, and unsecured was $28.3 billion, a record. The previous highest was $28.0 billion in February (both figures are seasonally adjusted).

April14HousingLendingLooking at the percentage splits, in April, 33% went to secured finance of existing dwellings, 32.5% on investment housing by individuals, 17.3% on refinancing and 6.1% on finance for owner occupied construction. On the investment side, 3.4% went to investment housing purchases by other entities, including companies and self-managed superannuation, and 2.86% went to investment housing construction.

April14HousingLendingTypeThe long term percentage mix from 2000 onwards shows the inroads investment lending is making into the overall portfolio.

April14HousingLendingTypePCFrom2000We can also show this by looking at the percentage relating to investment lending as a percentage of all housing lending, currently at 38.8%. This is a high.

April14InvestmentTrendWe still hold the view the current policy settings are wrong. Too much lending is pouring into an inflated housing sector. Interest rates are too low. The banks are lending too freely, and benefiting from inflated balance sheets and profits as a result. Households have more debt than everThe IMF is right.

Commercial Lending Outstrips Housing Growth In April

The ABS released their Lending data for April 2014. In the last month, commercial lending was up 5.8% seasonally adjusted, to $43,802 million whilst housing finance was up 1.4% to $16,911 million. Personal finance and lease finance were both down. This data presents the monthly flows.

April14LendingAcross the sectors, ABS reports:

HOUSING FINANCE FOR OWNER OCCUPATION –  The total value of owner occupied housing commitments excluding alterations and additions rose 0.4% in trend terms, and the seasonally adjusted series rose 1.4%.

PERSONAL FINANCE –  The trend series for the value of total personal finance commitments fell 0.3%. Revolving credit commitments fell 0.5% and fixed lending commitments fell 0.2%.  The seasonally adjusted series for the value of total personal finance commitments fell 2.2%. Revolving credit commitments fell 3.3% and fixed lending commitments fell 1.4%.

COMMERCIAL FINANCE – The trend series for the value of total commercial finance commitments rose 2.0%. Revolving credit commitments rose 3.3% and fixed lending commitments rose 1.6%. The seasonally adjusted series for the value of total commercial finance commitments rose 5.8% in April 2014, following a rise of 3.9% in March 2014. Fixed lending commitments rose 6.3%, following a rise of 1.6% in the previous month. Revolving credit commitments rose 4.3%, following a rise of 11.4% in the previous month.

LEASE FINANCE – The trend series for the value of total lease finance commitments fell 1.0% and the seasonally adjusted series fell 20.3%, after a rise of 7.5% in March 2014.


IMF Warns On Housing, Launches New Index

The IMF has launched its Global Housing Watch, a selected set of data highlighting potential pressures in the housing market across countries. “Housing is an essential sector of every country’s economy, but it has also been a source of instability for financial institutions and countries. Understanding the drivers of house price cycles, and how to moderate these cycles, is important for economic stability.In its first release, they warn of high prices, and tensions between central bank policies and broader economic issues”. They argue that housing has been the subject of “benign neglect”.

Here are the initial findings, with Australia highlighted where appropriate.

First, the Global House Price Index is a compilation of average housing prices in different countries that tells us if prices are going up globally. The global house price index highlights the fact that after the GFC in 2007, there was only a minor correction, so house prices remain high by historic standards.

IMFJun14-0Year on year growth in prices does vary by country, Australia is towards the top of the growth trend, although New Zealand is even higher, and the Philippines is top.

IMFJun14-3Looking at relative price to income, Australia is on average third highest (they do not split out specific markets in countries). Belgium is the most expensive, Japan the least.

IMFJun14-2Finally, the ratio of house prices to rent also highlight that Australia is at the high end, behind Canada, New Zealand, Norway and Belgium. Japan is the lowest.

IMFJun14-1They conclude:

We do have a set of policy tools that can help – sometimes these are referred to as “Mip-Map-Mop.” Microprudential (Mip) policies look at an individual bank’s balance sheet, for example to determine if it is making too many real estate loans. But it could be that the individual banks are doing what seems healthy for them, but what the banking system as a whole is doing needs results in an unhealthy growth in lending.

So, in addition, macroprudential regulations (Map), operating at the level of the financial sector as a whole, come into play. The most commonly used measures cap how much individuals may borrow relative to their income. These prudential measures are being increasingly used by countries to prevent an unsustainable build-up in debt.

Finally, there is the monetary policy (Mop) that involves the central bank raising interest rates if they want to cool off the housing sector. This can be tricky, because sometimes the economy is weak but the housing sector is booming, and raising the interest rate can harm the overall economy.

We have argued for some time that Australia need to use macroprudential  policies to help to bring the run-away housing market under control. Focus on investment lending should be first priority. Over emphasis on lending for housing sucks the air from the broader economy and makes it harder for potentially productive businesses to get the lending support they need. Households servicing larger debts have less spending power, which dampens economic activity.

Is Peer To Peer Lending Going Big Time?

On the day, Sarv Girn, the Chief Information Officer at the RBA gave a speech entitled Digital Disruption – Opportunities for Innovation and Growth to the Committee for Economic Development of Australia (CEDA), the AFR reports that Peer-to-peer lender SocietyOne has attracted the interest of James Packer and Lachlan Murdoch, although nothing is signed yet.

This is on top of the  $5 million investment Westpac Banking Corporation equity stake in the business made through its venture capital fund, Reinventure Group. The Australian head of global private equity giant KKR, ­Justin Reizes, has also invested in SocietyOne in a personal capacity.

In a recent article, SocietyOne is said to have made almost 150 loans, totalling $2 million. About 11% of applications are accepted. SocietyOne’s default rate at June 30 was 2.3 per cent. The market place includes auction functionality like ebay to match borrowers and investors.

You can read our recent article on P2P lending here. We included a summary of SocietyOne. Recently SocietyOne introduced a personal loan rate for prime borrowers at more than 5 per cent lower than the major banks. For example, borrowers with excellent credit that translates to a comparison rate of 9.80 per cent per annum which is 5.48 per cent lower than the average personal loan rate from the big four banks.

We think P2P Lending has the potential to be a disruptive force and could change the face of regular banking, quite soon. As the AFR concludes:

Westpac’s interest in SocietyOne was partly driven by a desire to be close to the development of such technology. Investor interest in SocietyOne also illustrates the extent to which banking is fast becoming a technology business. The winds of change may have arrived late to an industry historically defined by high barriers to entry and oligopolistic structures, but they now blow hard.