
The Bank of Queensland have announced FY18 cash earnings after tax of $372 million, down two per cent on FY17. Statutory net profit after tax of $336 million, was down 5%.
Being a regional is a tough gig, and they continue to drive significant digital transformation, but despite some accounting wizardry, the cracks are showing in our view. The tighter home lending sector, and reduce fee income both hit home. As a result capital is weaker than expected.
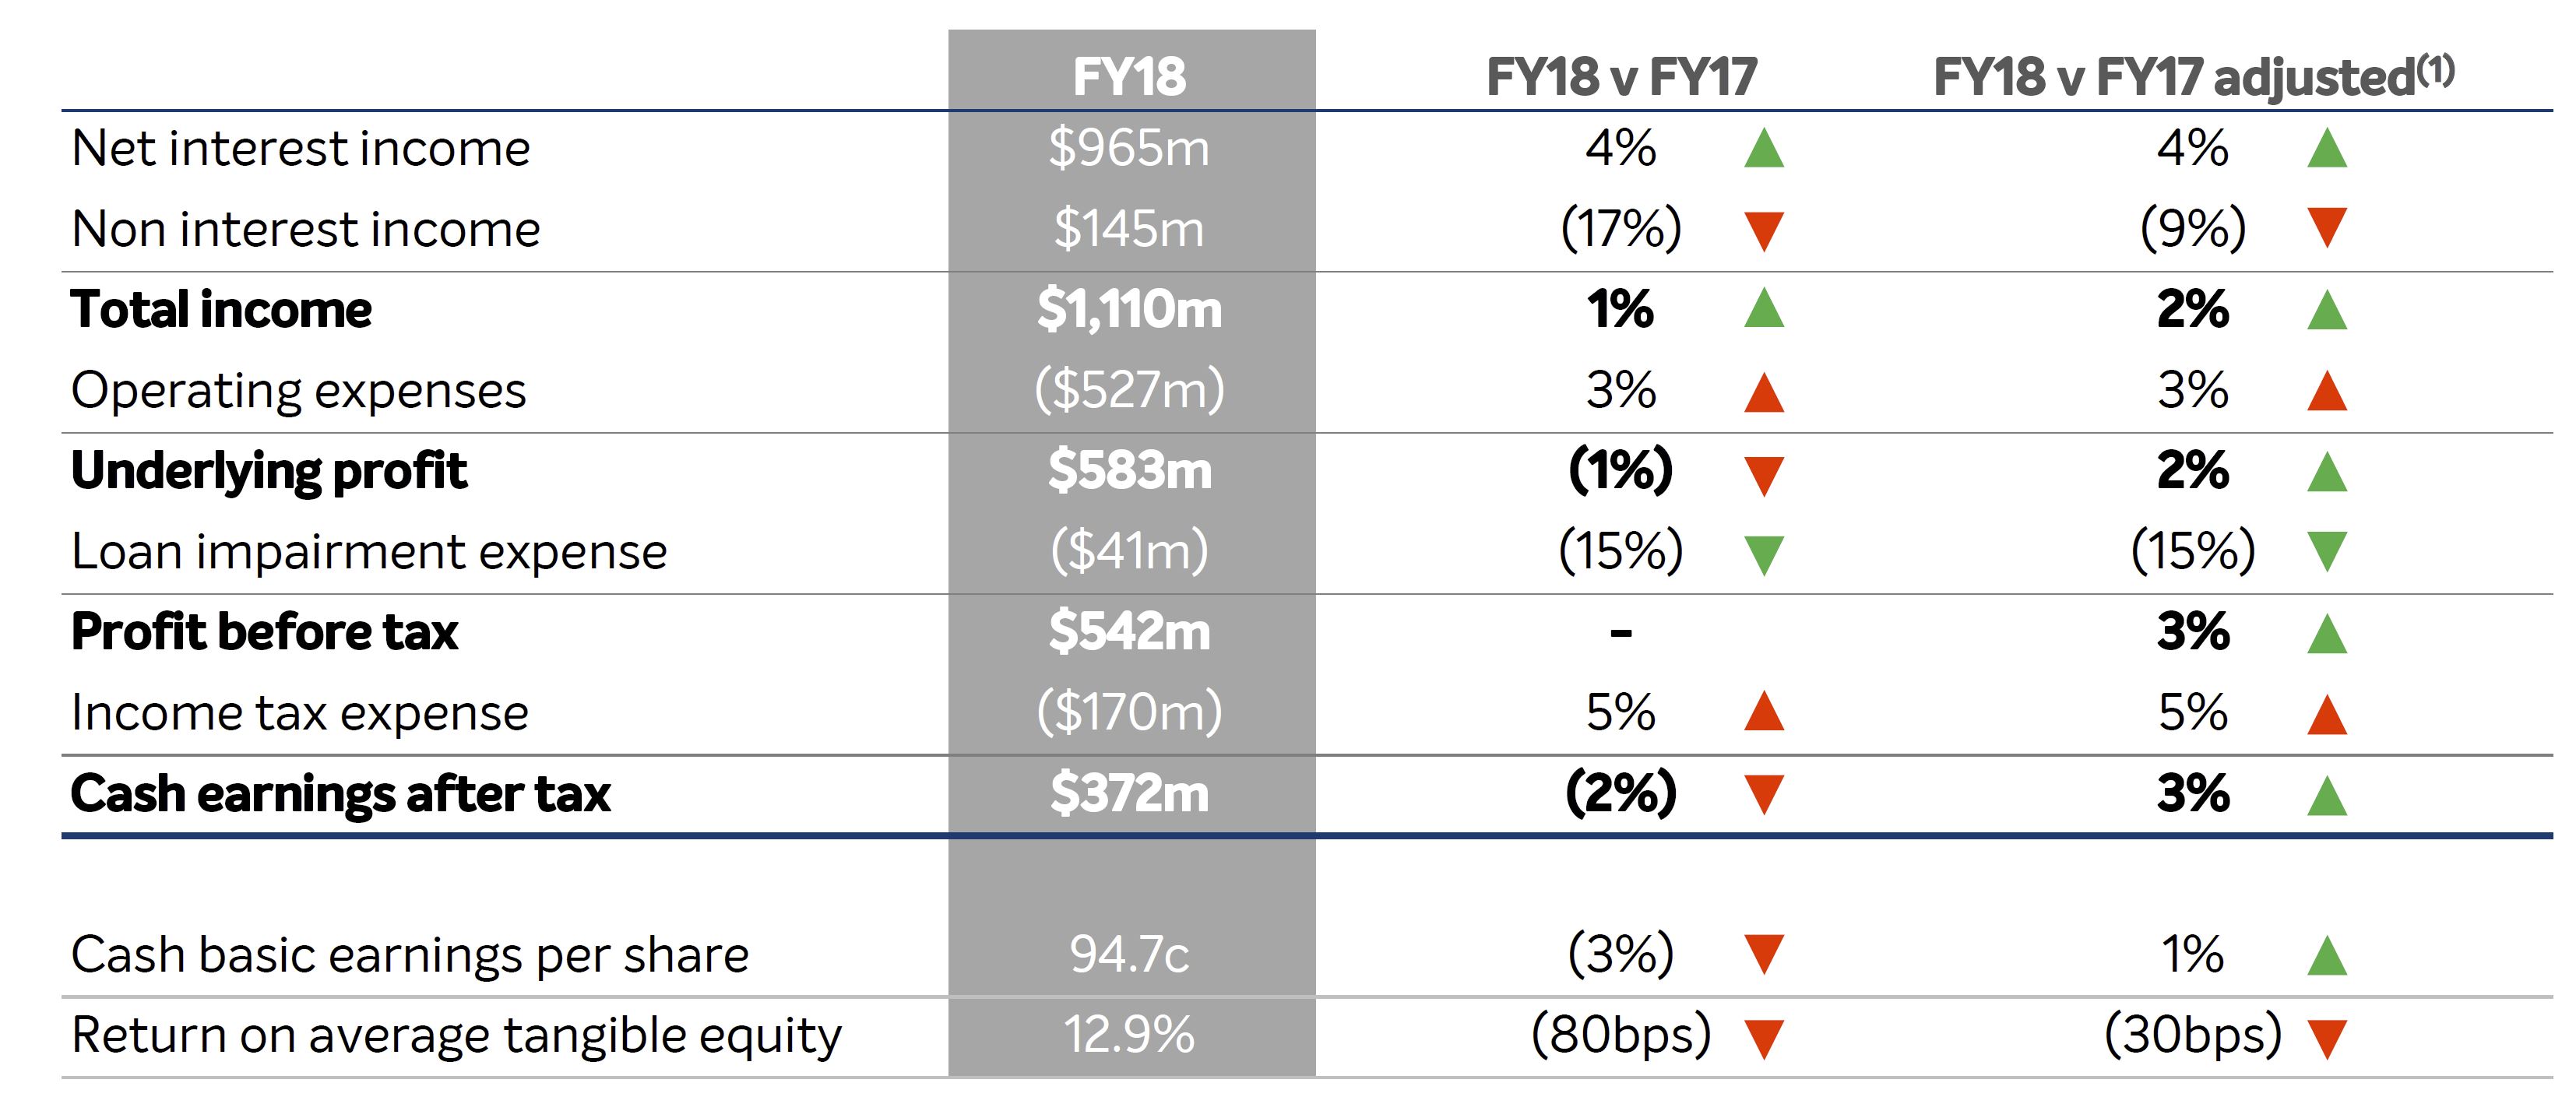 Statutory net profit after tax decreased 5 per cent to $336 million. The BOQ Board has maintained a fully franked final dividend of 38 cents per ordinary share. Basic earnings per share was down 3% to 94.7 cents. Their return on average ordinary equity down 50 bps to 9.9%
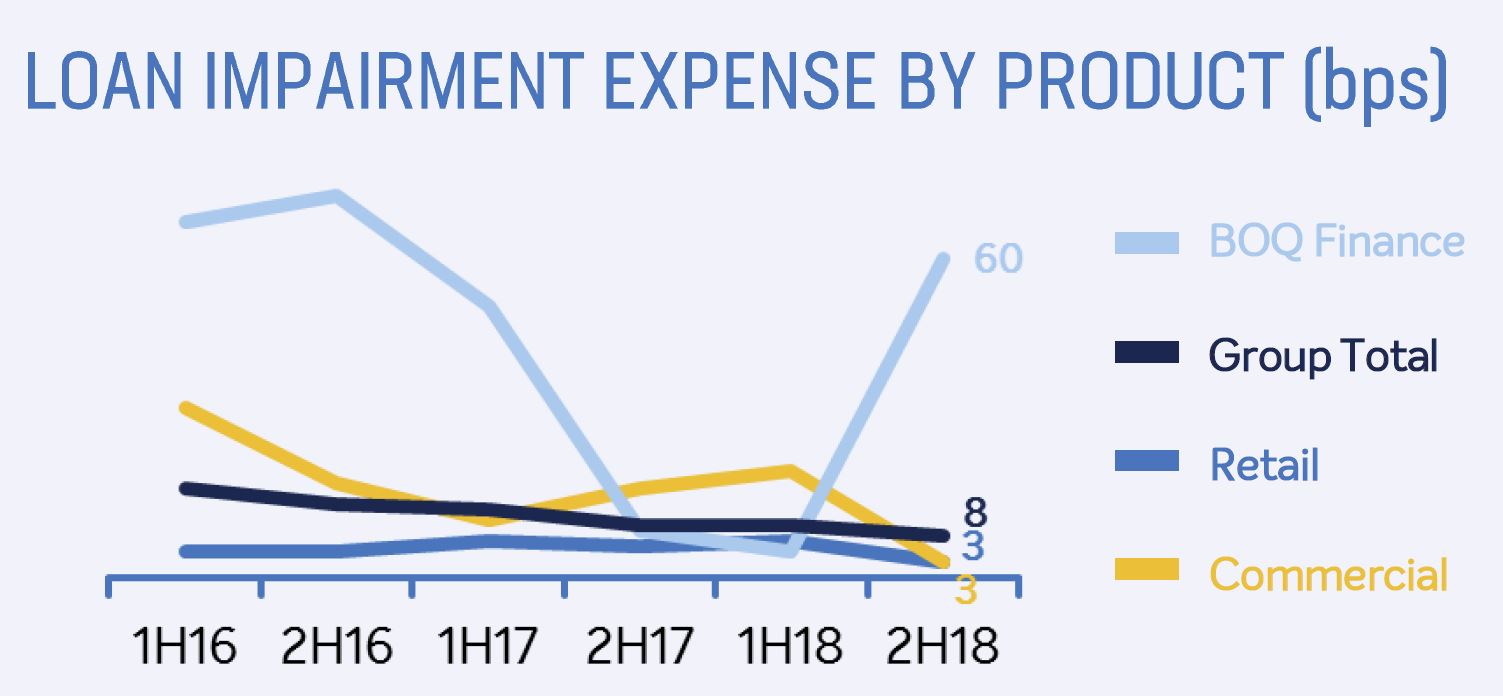
2H18 cash earning was $190 million and bad loan expenses were lower, down 15% to $41 million or 9 bps of gross loans.
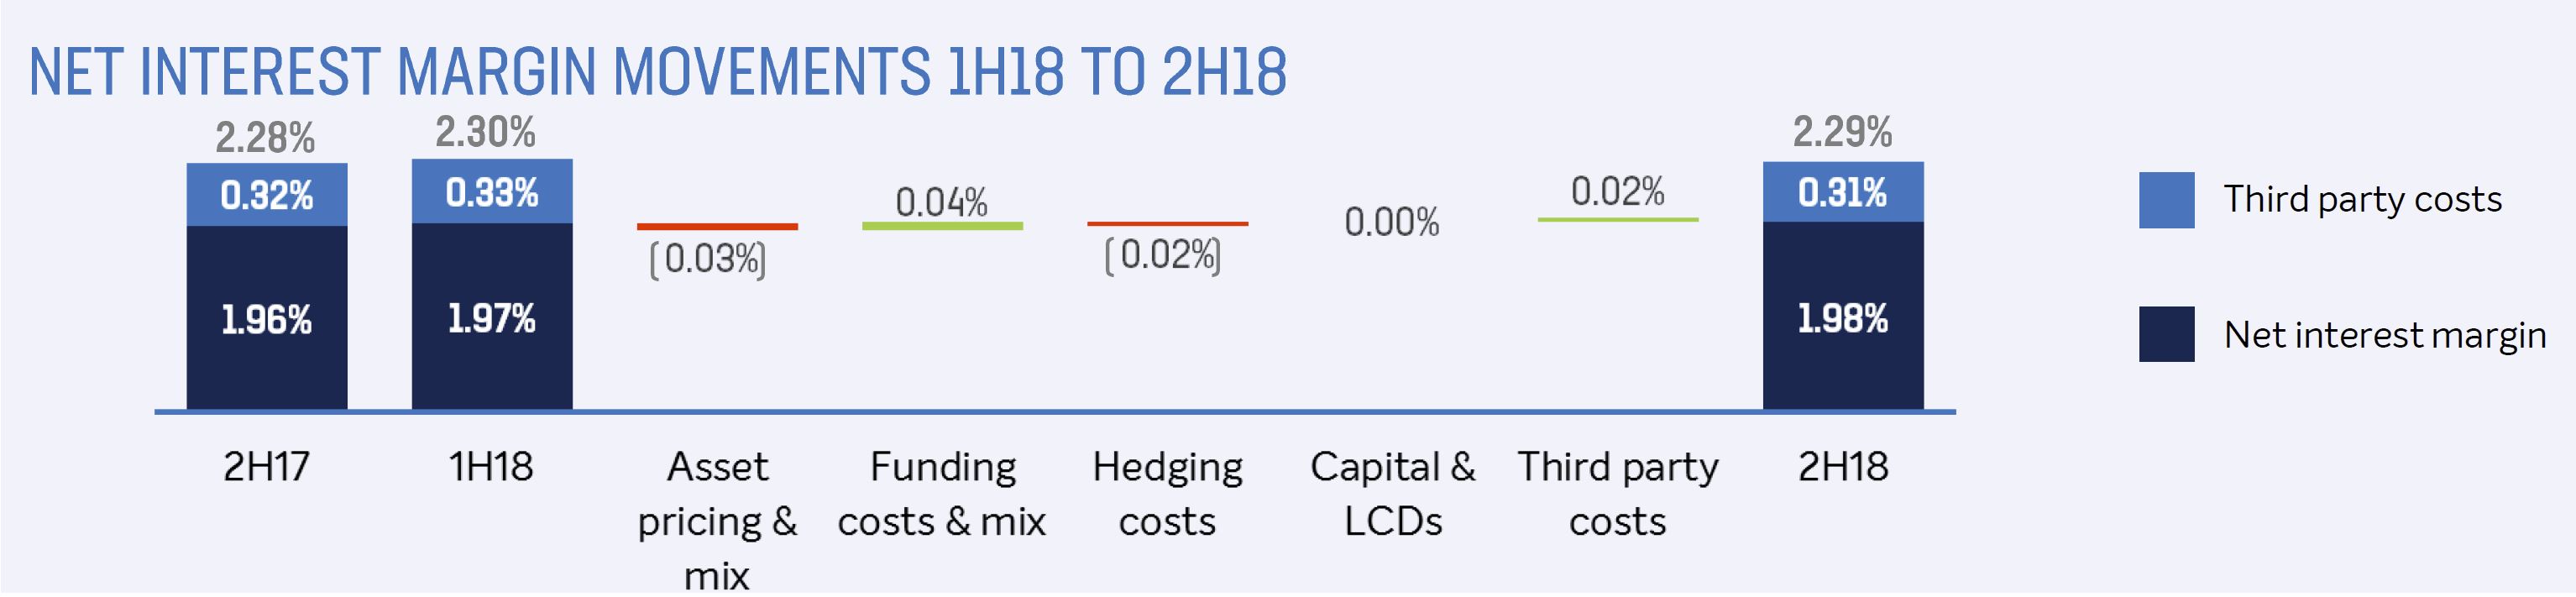
Net interest margin ended the year at 1.98% a little higher, but reflected hedging cost headwind mitigated by improvements driven through funding mix and asset pricing, front book vs back book repricing and >2bps benefit from extension in weighted average life of housing loans, reflecting portfolio trends.
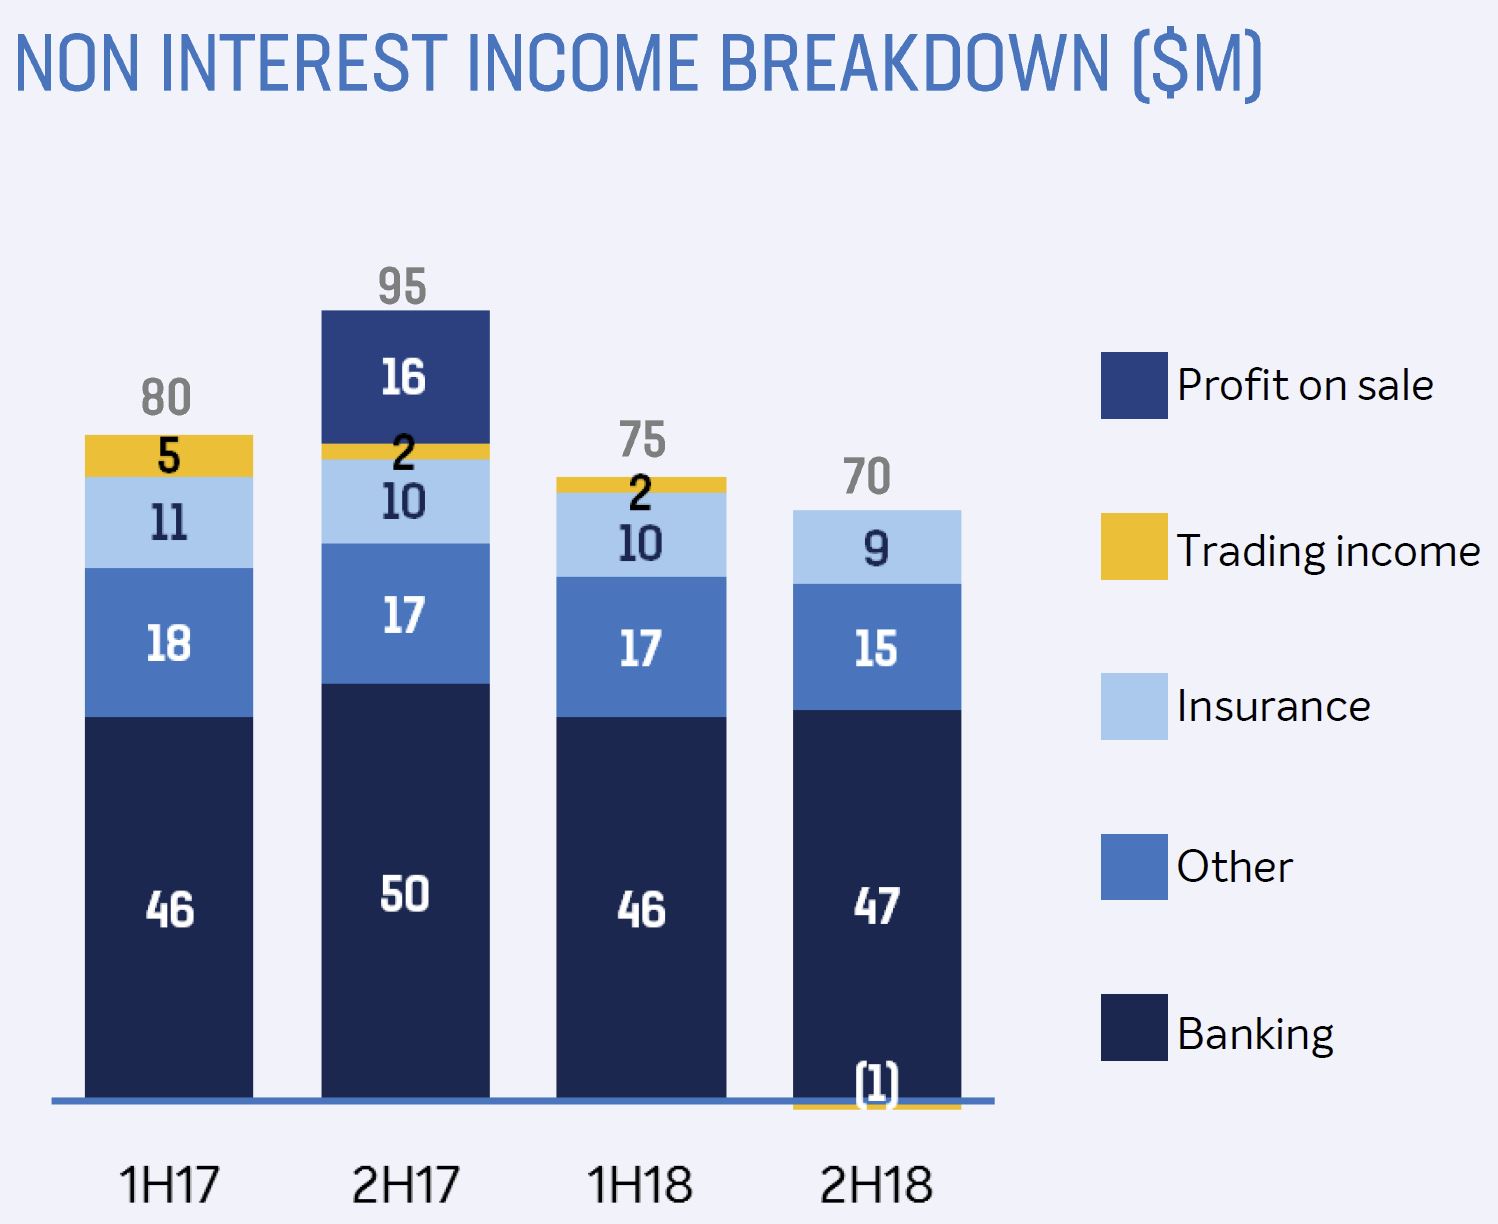
 Non interest income fell thanks to ongoing pressure on banking fees, insurance income continuing to trend lower, and limited opportunities for trading income generation.
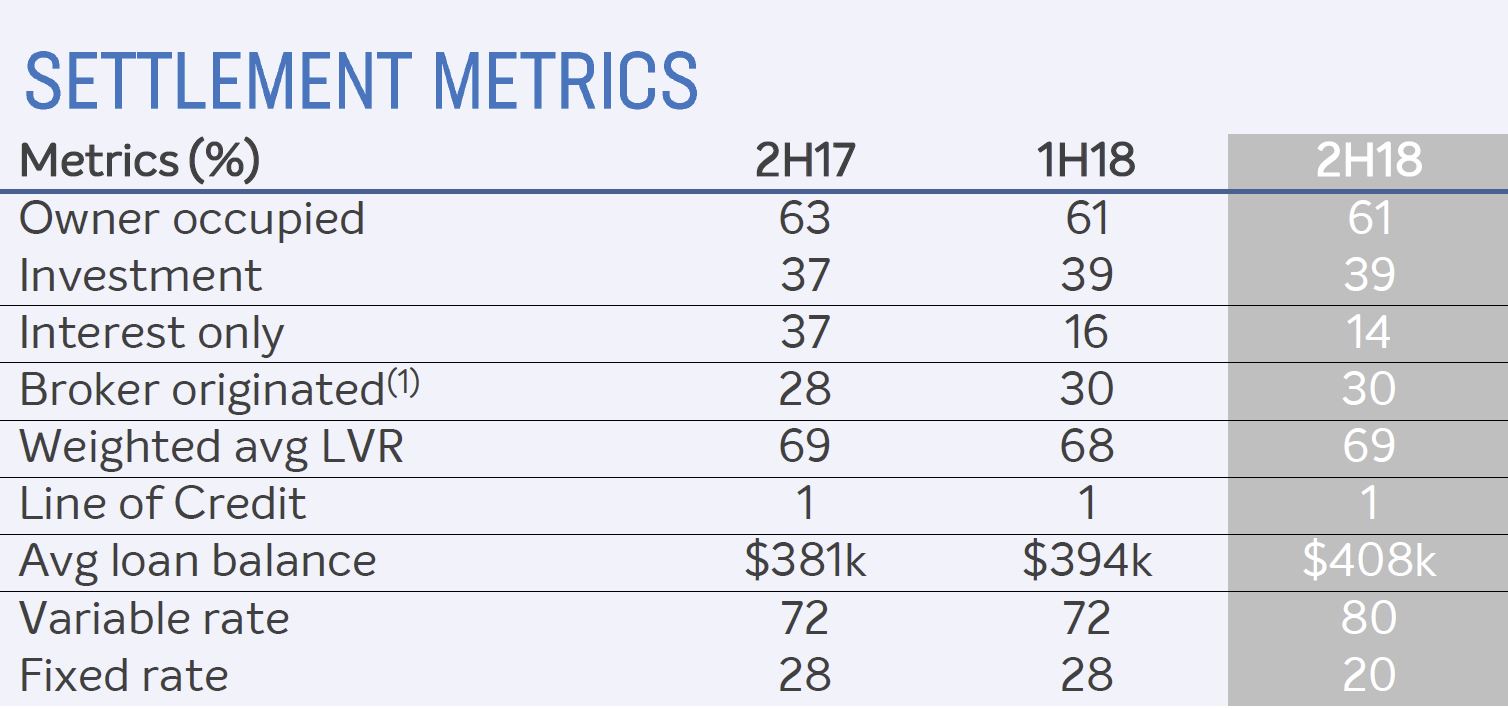
 Within their housing portfolio, broker settlements were at 30%. Interest only settlements reduced significantly and owner occupied P&I loans represent 50% of portfolio.
Interest only loans are now 14% of new settlements, down from 37% in 2017. The average loan balance is growing (despite the tighter lending conditions across the industry). They hold 16% above an LVR of 81-90% and 8% greater than 90%.
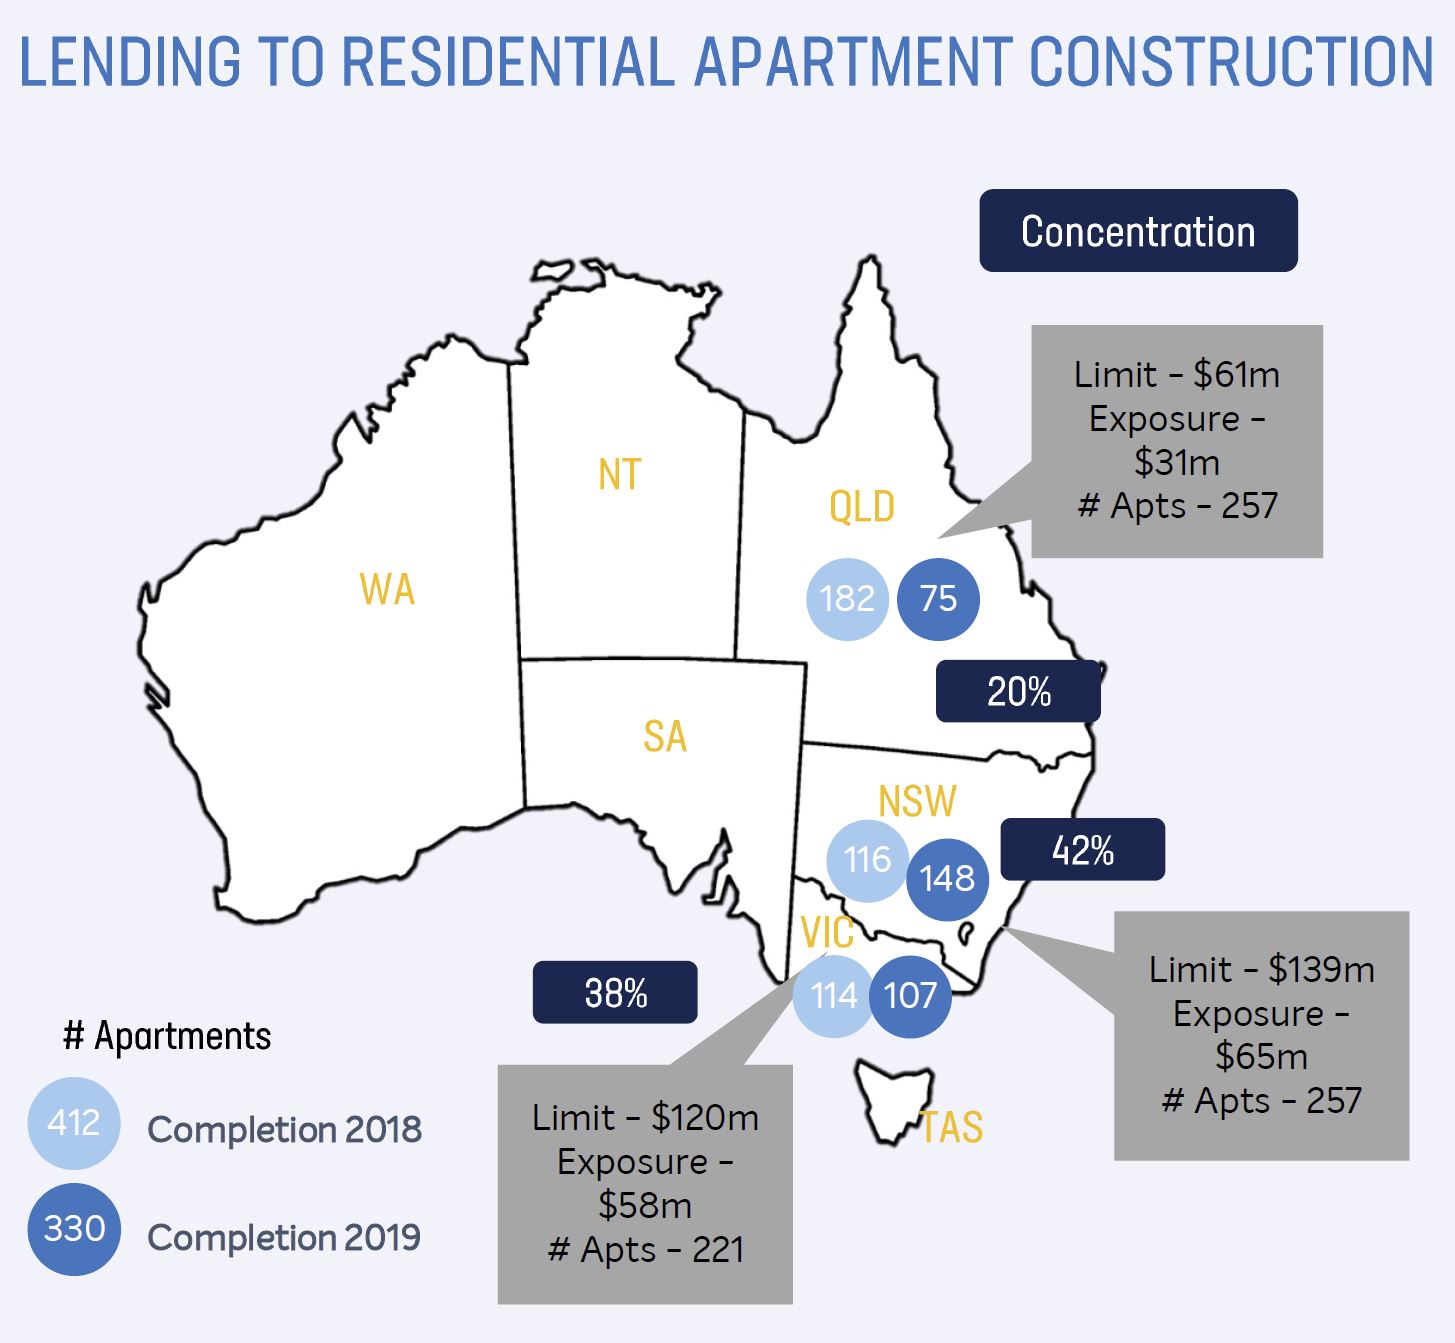
 They have $154m current exposure to residential construction, representing 14 developments across 3 states, completing 2018 through 2019. They say it is well diversified intra-state within NSW and VIC.
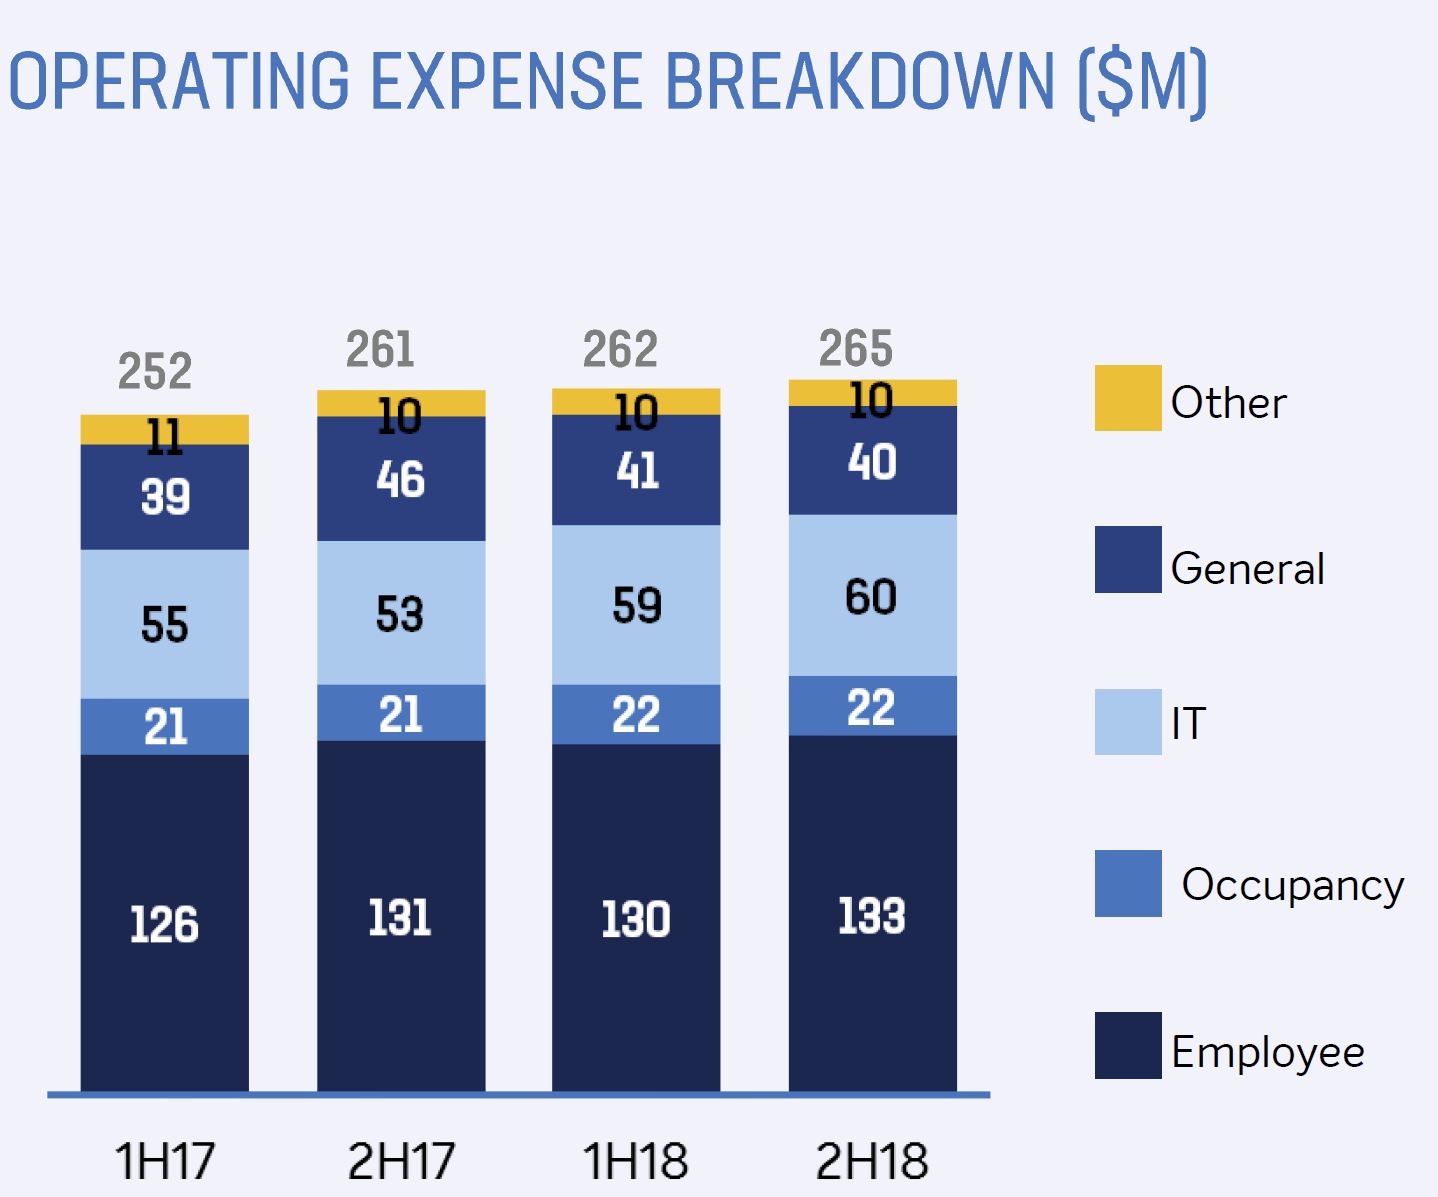
 Overall expenses grew at 3% and cost to income ratio was up 90 bps to 47.5%, despite core operating expense growing at 1%. They increased the amortization of ongoing IT investment and increased capital investment flagged for FY19.
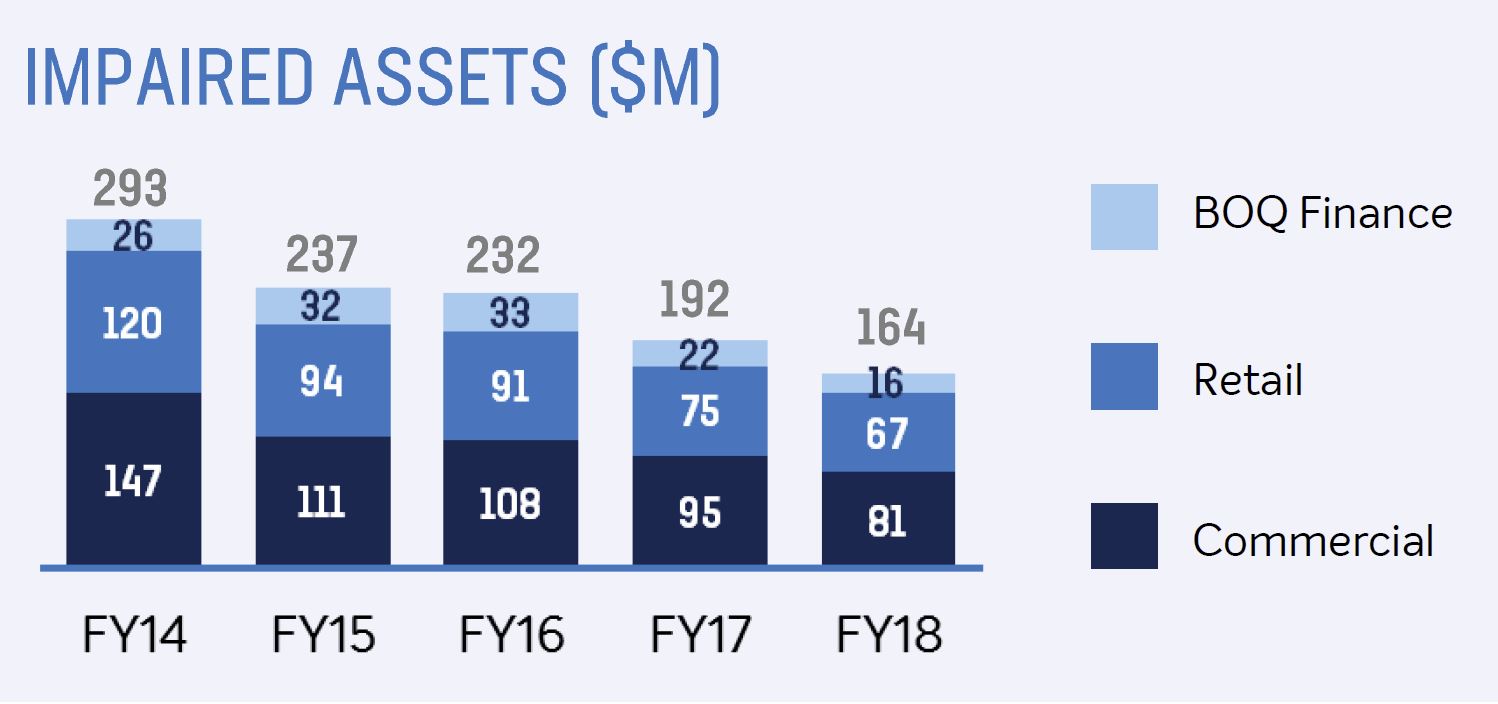
Impaired assets for the year stood at $164 million, down from $192 million in FY17.
 Loan impairments for BOQ Finance rose to 60 basis points in 2H18.
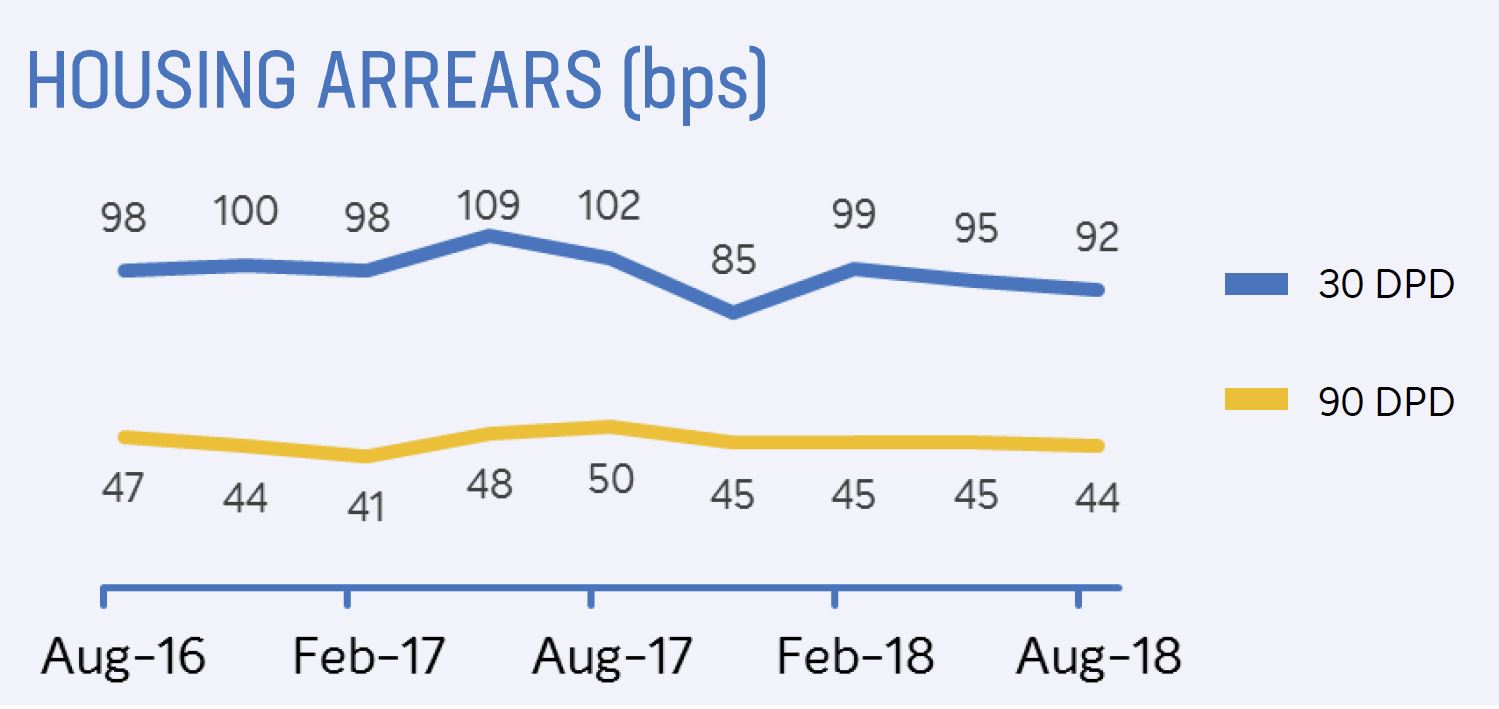
 Housing loan arrears are relatively stable.
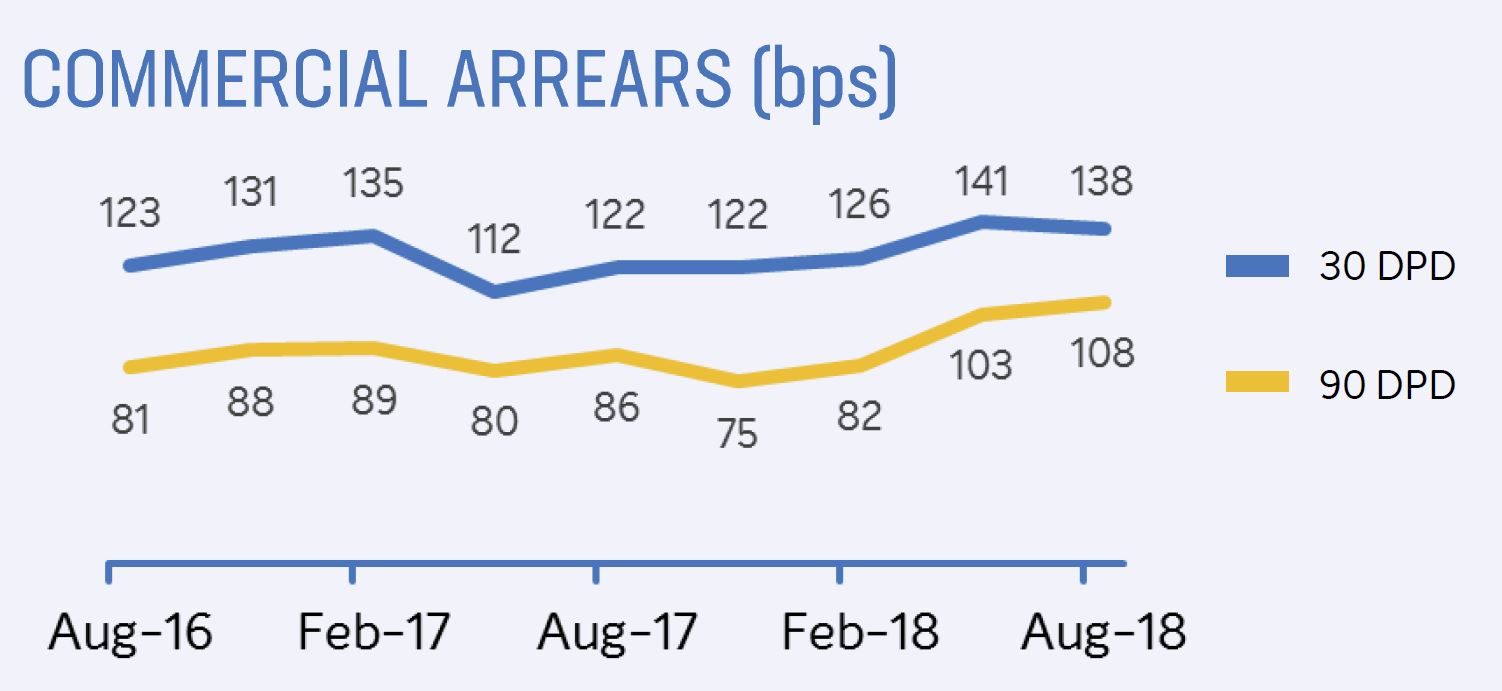
 Commercial arrears past 90 day have risen.
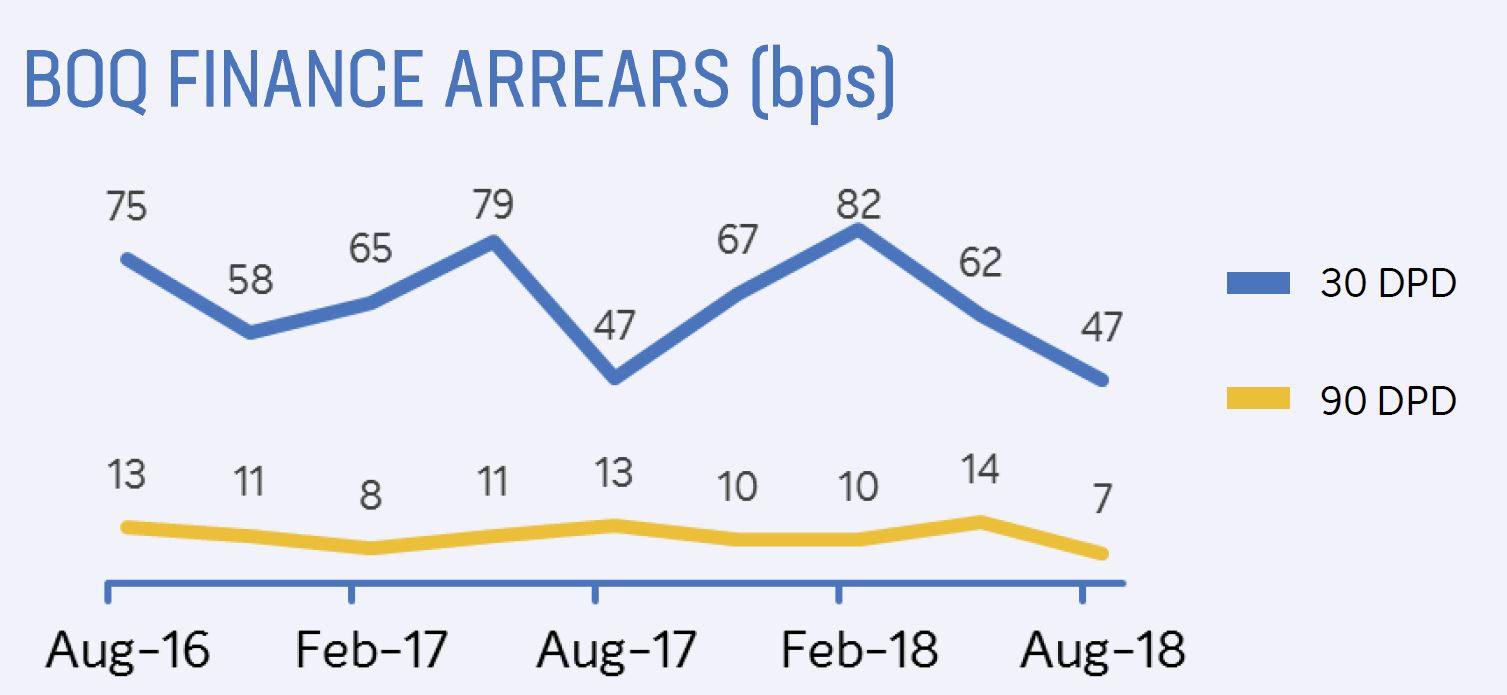
 BOQ finance arrears appear more volatile.
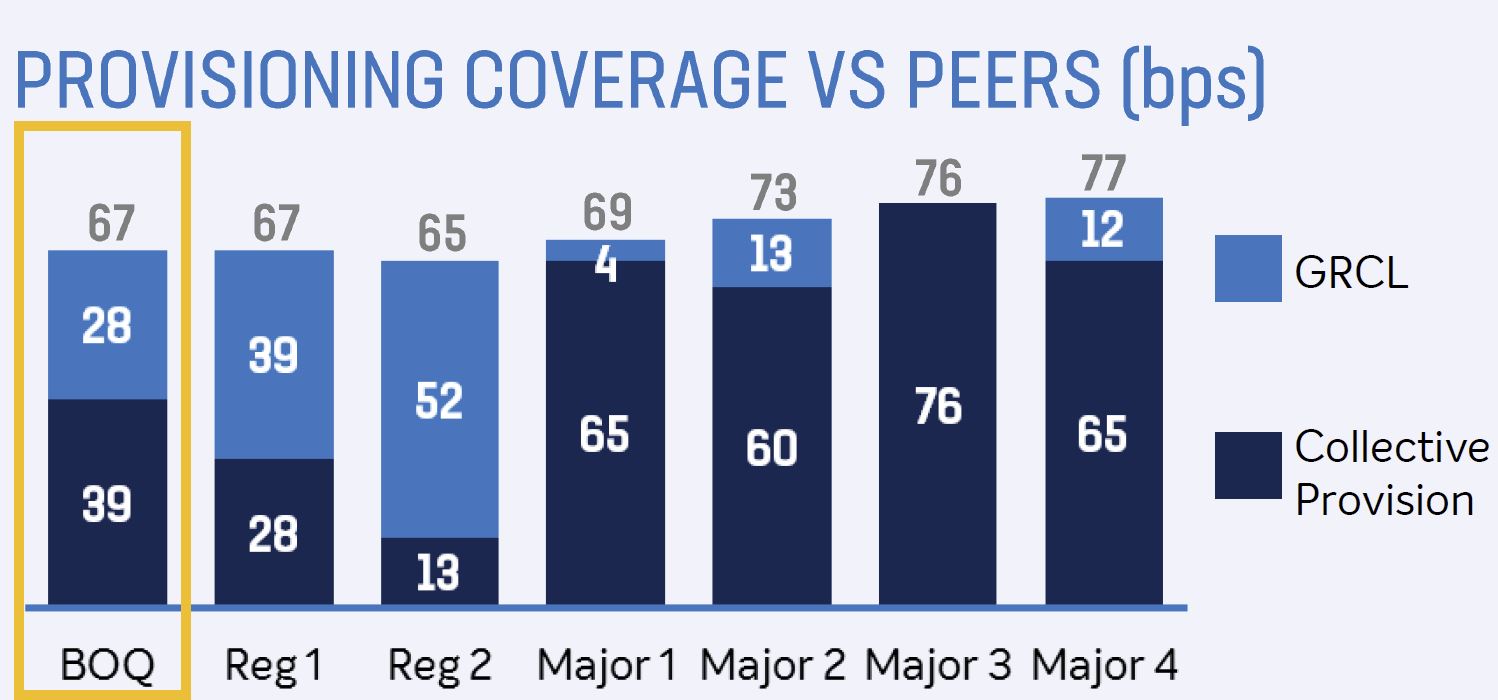
 BOQ provisions are at the lower end of the spectrum compared with major players, but similar to other regionals.
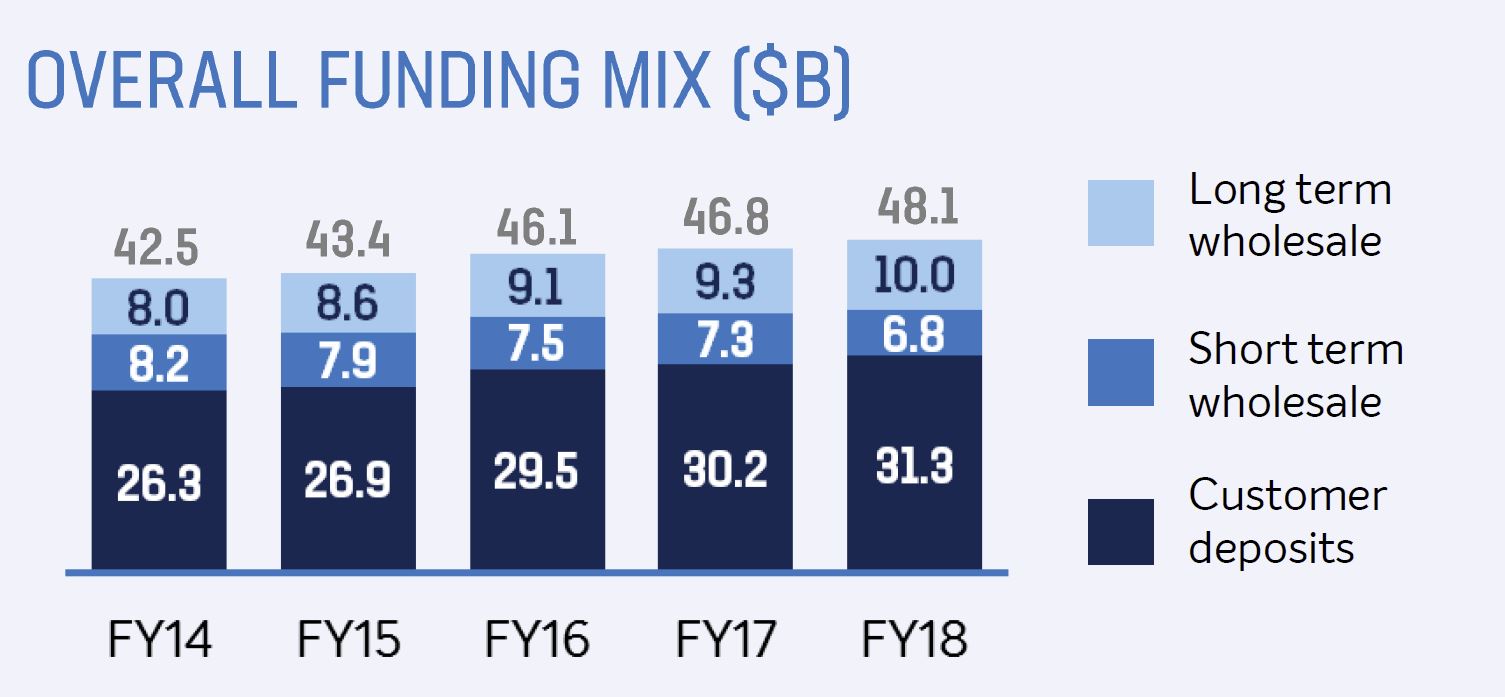
 They had a deposit growth rate of 4% and 65% of loans are covered by deposits.
 The CET1 ratio at 9.31% is lower than some analysts were expecting.
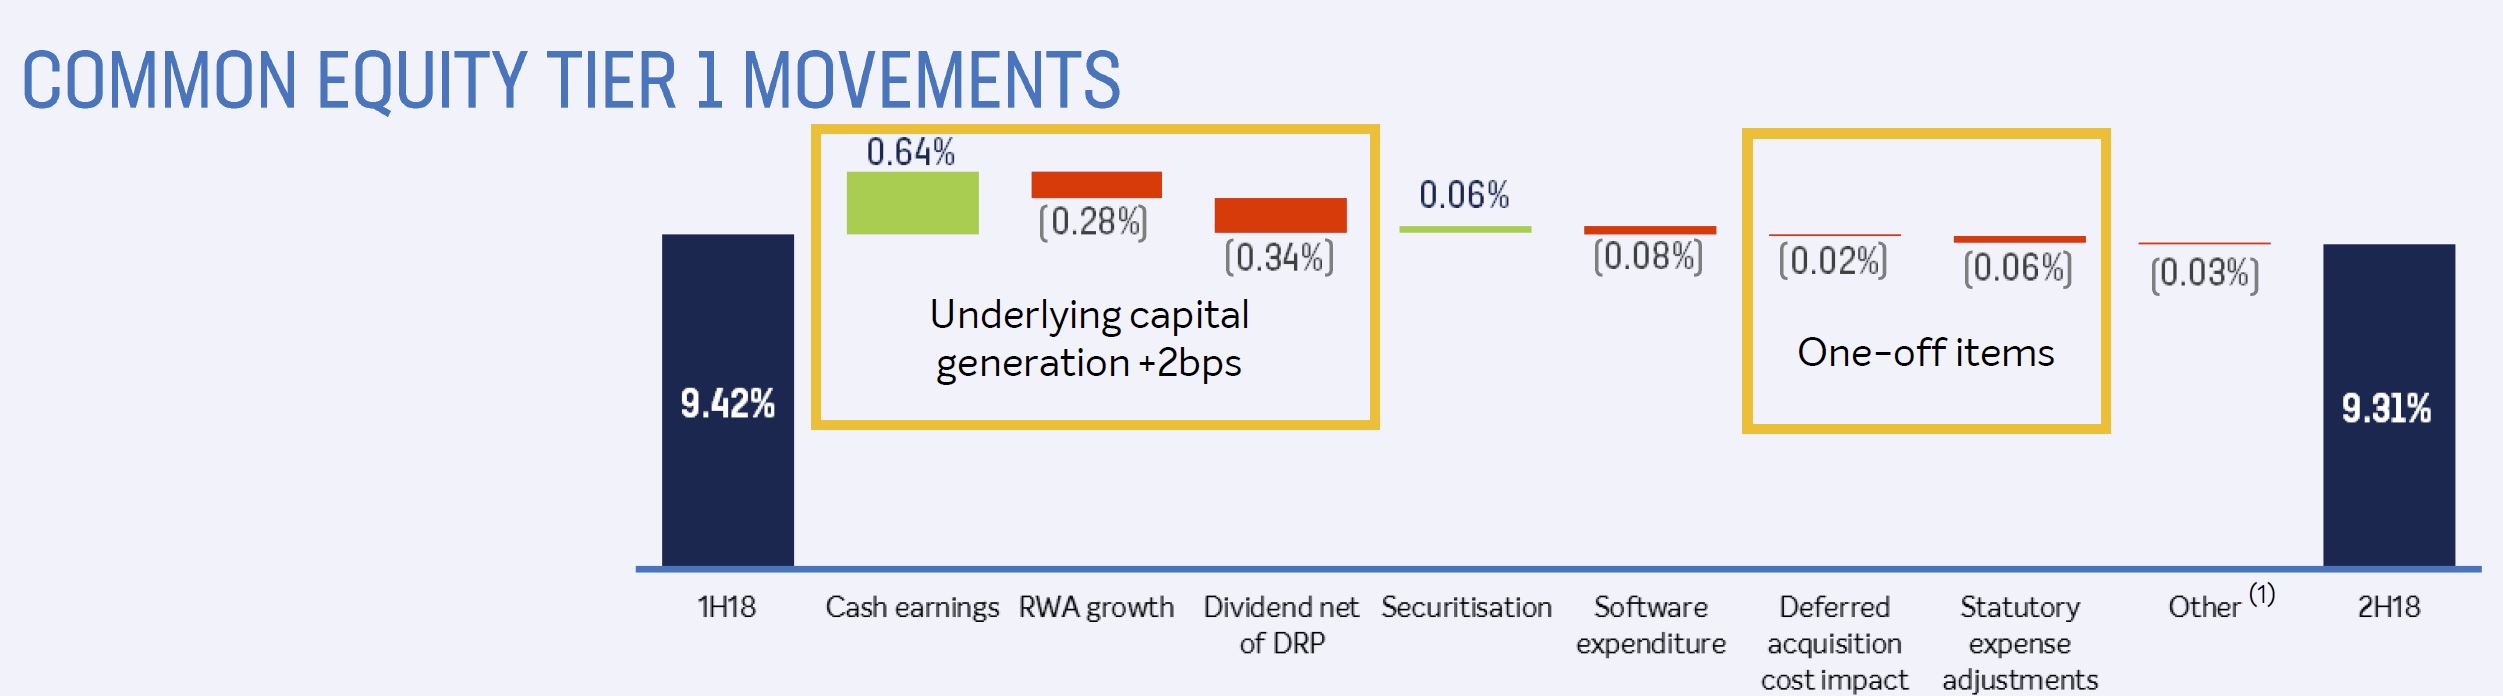 The underlying capital generation of +2bps, with an impact from one-off items of (8bps) and increased investment spend reduced CET1 by 8bps. We think the banks capital management flexibility is reduced, especially as it flagged it will use 7bps of excess capital over FY19/FY20 to accelerate digital investment.
Finally, its worth noting that there was no update on the progress of the St Andrews disposal, which remains ‘subject to regulatory approval’.