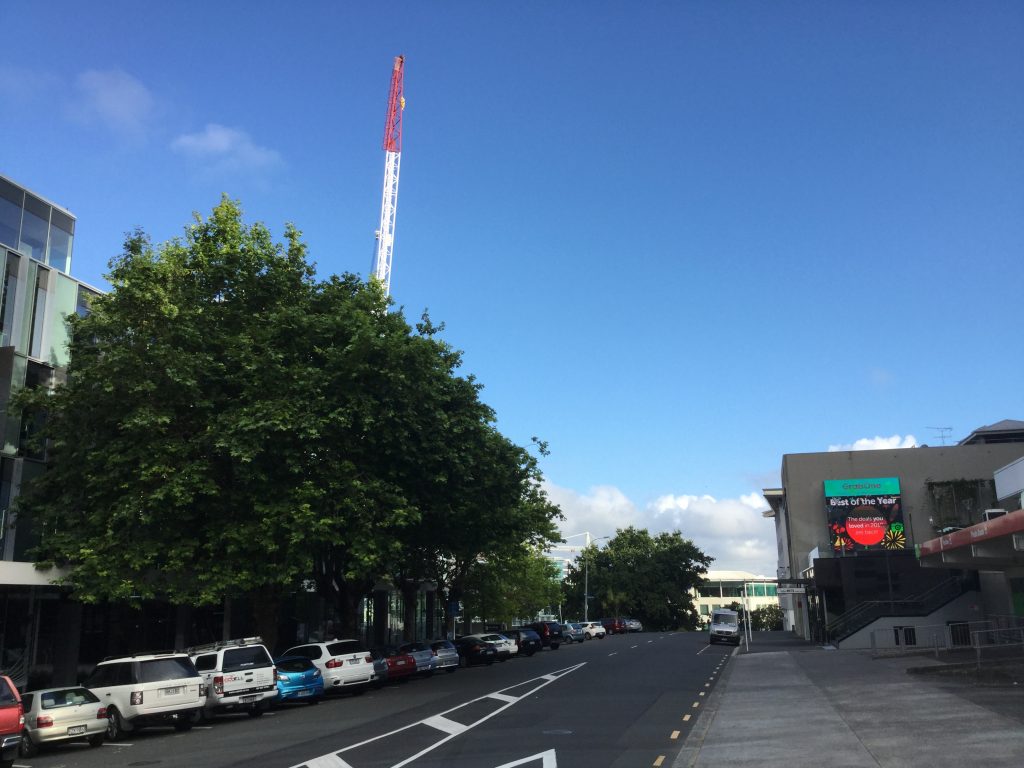
We have released episode 2 of our series on New Zealand property, as Joe Wilkes, Property Expert continues his tour of Auckland’s new suburbs. Is there really a “property shortage”, or is something else afoot?
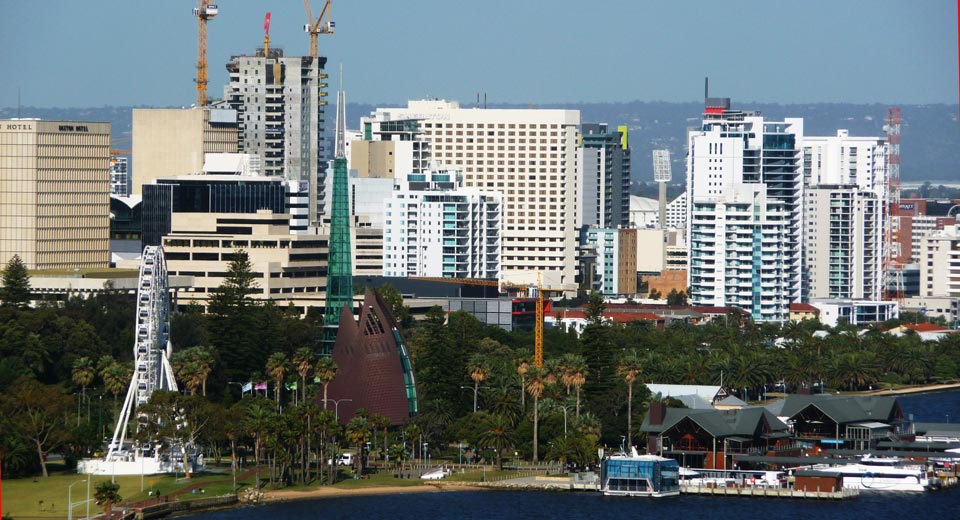
Interesting perspective from property bulls in the West, arguing that population growth will drive property returns higher ahead and prices are down ~15% on average from the peak several years ago. Our data suggests net returns are significantly lower! This via Australian Broker:
Positive population growth and a decline in vacancy rates, as well as
the low interest rates, are making an attractive time to invest in
property in Western Australia.
After a 60,000 drop in 2015, West Australian annual population growth is rising again, with repeated climbs in recent years.
CBRE figures show Western Australia enjoyed a 21,000-person net increase alone in the past twelve months.
Population of the Perth and Peel region in 2010 was approximately
1.65 million. That is expected to exceed 2.2 million residents by 2031.
The change has prompted Gemmill Homes Managing Director, Craig Gemmill, to predict good times for the market.
He said, “This is the first step in the recovery of Western Australia.
“It’s really exciting, as there’s two real positives that come out of the population growth.
“Existing housing stock get soaked up. That affects supply and people
then go to the next level of pricing or they build. It will really
stimulate the market.”
Vacancy rates have seen a considerable drop after topping out at 7.3% in July last year.
Stabilisation has been followed by four consecutive quarterly falls
and Real Estate Institute WA figures show the vacancy rate has dipped to
3.9%, a level last seen in 2015.
Gemmill added, “It has happened so quickly. Yesterday we were all
saying it was all doom and gloom, but vacancy rates have dropped
considerably in just a year.
“When people were leaving the state it became a tenant’s market, due to the number of properties that were available.
“Now, we’re seeing things going back more in favour of the landlord, so it is a great time for investors.
“Investors need at least 5% return. The average now is around 5.5%.
When you claim 2% depreciation, that leaves a seven percent return.
That’s before investors have even claimed back their borrowing costs.
“So, in this market where interest rates are low, you can get a great return of investment.
“We’re going into an upswing in the cycle and it’s a great time to invest in the market.”
Michael Valetta, CBRE director of residential valuations agreed with
the positivity, saying recent data shows clear growth for WA.
He said, “An increase in population growth and decrease in vacancy rates present real opportunities for the real estate market.
“I see great potential in Western Australia and after some lean
years, signs point towards the fact we are turning things around.”
The number of dwellings approved in Australia fell by 1.1 per cent in October 2018 in trend terms, according to data released by the Australian Bureau of Statistics (ABS) today.
NUMBER OF TOTAL DWELLING UNITS
The trend estimate for total dwellings fell 1.1% in October.
NUMBER OF PRIVATE SECTOR HOUSES
The trend estimate for private sector houses approved fell 0.5% in October.
NUMBER OF PRIVATE SECTOR DWELLINGS EXCLUDING HOUSES
The trend estimate for private sector dwellings excluding houses fell 1.8% in October.
VALUE OF NEW RESIDENTIAL BUILDING
The trend estimate for value of new residential building approved fell 1.5% in October and has fallen for ten months.
“The trend for total dwellings has been steadily declining over the past twelve months,” said Justin Lokhorst, Director of Construction Statistics at the ABS. “The decrease in October was mainly driven by private sector dwellings excluding houses, which fell 1.8 per cent. Private sector houses also declined, by 0.5 per cent.”
Among the states and territories, dwelling approvals fell in October in the Northern Territory (12.5 per cent), South Australia (5.0 per cent), Western Australia (4.4 per cent), Queensland (2.9 per cent) and New South Wales (2.3 per cent) in trend terms. Victoria (2.4 per cent) and the Australian Capital Territory (0.8 per cent) were the only states to record an increase in dwelling approvals in trend terms, while Tasmania was flat.
NEW SOUTH WALES
The trend estimate for total number of dwelling units in New South Wales fell 2.3% in October. The trend estimate for private sector houses rose 0.2% in October.
VICTORIA
The trend estimate for total number of dwelling units in Victoria rose 2.4% in October. The trend estimate for private sector houses rose 0.6% in October.
QUEENSLAND
The trend estimate for total number of dwelling units in Queensland fell 2.9% in October. The trend estimate for private sector houses fell 1.3% in October.
SOUTH AUSTRALIA
The trend estimate for total number of dwelling units in South Australia fell 5.0% in October. The trend estimate for private sector houses fell 2.6% in October.
WESTERN AUSTRALIA
The trend estimate for total number of dwelling units in Western Australia fell 4.4% in October. The trend estimate for private sector houses fell 3.7% in October.
Approvals for private sector houses fell 0.5 per cent in October in trend terms. Private sector house approvals fell in Western Australia (3.7 per cent), South Australia (2.6 per cent) and Queensland (1.3 per cent). Victoria (0.6 per cent) and New South Wales (0.2 per cent) recorded increases.
In seasonally adjusted terms, total dwellings fell by 1.5 per cent in October, driven by a 4.8 per cent decrease in private dwellings excluding houses. Private houses rose 2.7 per cent in seasonally adjusted terms.
The value of total building approved fell 1.5 per cent in October, in trend terms, and has fallen for twelve months. The value of residential building fell 1.4 per cent while non-residential building fell 1.8 per cent.
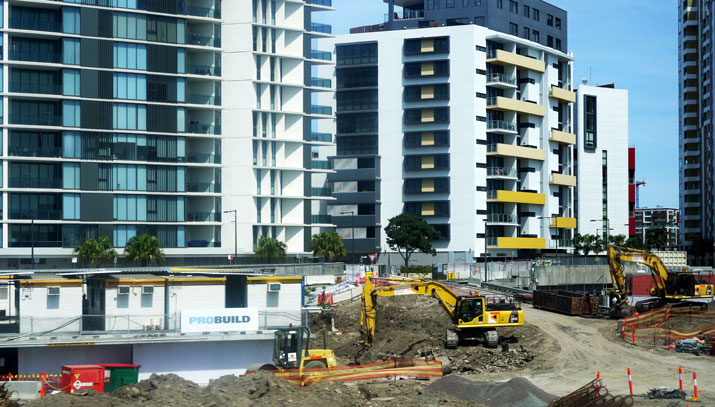
Property expert Edwin Almeida and I discuss the issues with both old and newly constructed residential buildings, and the sleeping problems they contain.
“An unexpected tight squeeze on credit for home buyers is accelerating the slowdown in building activity,” said Mr Tim Reardon, HIA Principal Economist.
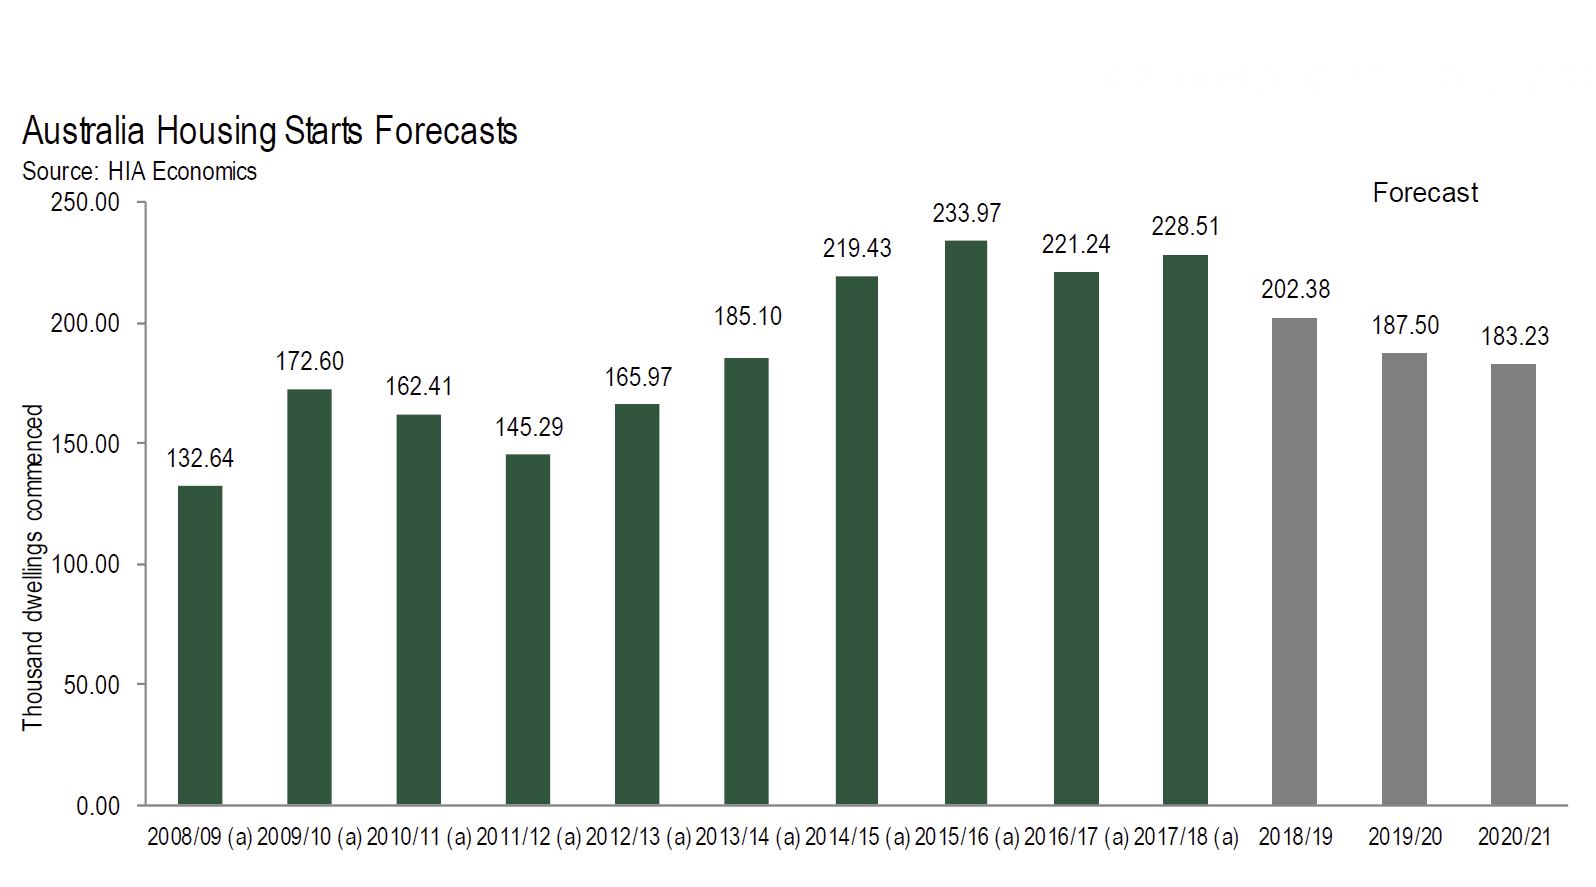
HIA released its quarterly economic and industry outlook report today. The State and National Outlook Reports include updated forecasts for new home building and renovations activity for Australia and each of the eight states and territories.
“The credit squeeze that has been impeding investors for the past 18 months has expanded and is now restricting building activity across the market,” added Mr Reardon.
“APRA’s restrictions were designed to curb high risk lending practices but we are now seeing ordinary home buyers experience delays and constraints in accessing finance.
“This disruption in the lending environment is impacting on the amount of residential building work entering the pipeline. The effect on actual building activity will become more evident in the first half of 2019.
“The credit squeeze is weighing on a market that had already started to cool from a significant and sustained boom.
“If these disruptions to the home lending environment prove to be long lasting then we could see building activity retreat from the recent highs more rapidly than we currently expect.
“The decline in housing finance data shows that something in the lending environment has changed. Lending to owner-occupiers building or purchasing new homes fell by 3.6 per cent in September and is down by 16.5 per cent over the year.
“The year 2017/18 saw over 120,000 detached house starts. This is one of the strongest results on record. We expect new home starts to decline by 11.4 per cent this year and then by a further 7.4 per cent next year in 2019.
“With the prospect for the release of the Hayne Royal Commission’s findings to trigger further upheaval in the banking system, we need the banks maintain stable lending practices for fear of a destabilising influence on the housing market,” concluded Mr Reardon.
Welcome to the Property Imperative weekly to 13th October 2018, our digest of the latest finance and property news with a distinctively Australian flavour.
This week saw major ructions on the financial markets, which may be just a short-term issue, or a signal of more disruption ahead. And locally, the latest data reveals a slowing of lending to first time buyers and owner occupied borrowers, suggesting more home price weakness ahead. So let’s get stuck in.
Watch the video, listen to the podcast, or read the transcript.
And by the way you value the content we produce please do consider joining our Patreon programme, where you can support our ability to continue to make great content.
Let’s look at property first.
The IMF’s latest Global Financial Stability Report (FSR) says Australia is one of a number of advanced economies where rising home prices are a risk. “household leverage stands out as a key area of concern, with the ratio of household debt to GDP on an upward trajectory in a number of countries, especially those that have experienced increases in house prices (notably, Australia, Canada, and the Nordic countries). Housing market valuations are relatively high in several advanced economies. Valuations based on the price-to-income and price-to-rent ratios, as well as mortgage costs, have been on the upswing over the past six years across major advanced economies, with valuations relatively high in Australia, Canada, and the Nordic countries.
And they also warn that the effect of monetary policy tightening (lifting interest rates to more normal levels) – could reveal financial vulnerabilities. Indeed, it’s worth looking at expected central bank policy rates globally. Bloomberg has mapped the relative likelihood of increases and decreases across a number of major economies, and most advanced economies are on their way up. Worth thinking about when we look at the long term home prices trends across the globe. Guess where Australia sits? High debt, in a rising interest rate environment is not a good look, so expect more stress in the system.
Yet the latest RBA Financial Stability review, out last Friday seems, well, in a different world. They go out of their way to downplay the risks in the system, and claim that households are doing just fine, based on analysis driven by the rather old HILDA data – again.
But back in the real world, Corelogic’s auction results for last week returned an aggregated clearance rate of 49.5% an improvement on the week prior at 45.8 per cent of homes sold, which was the lowest weighted average result since 42 per cent in June 2012. There was a significantly higher volume of auctions with 1,817 held, rising from the 895 over the week prior.
Melbourne’s final clearance rate fell last week, to 51.8 per cent the lowest seen since 50.6 per cent in December 2012. There were 904 homes taken to auction across the city. Compared to one year ago, the Melbourne auction market was performing very differently, with both volumes and clearance rates significantly higher over the same week (1,119 auctions, 70.3 per cent).
Sydney’s final auction clearance rate increased last week, with 46.1 per cent of the 611 auctions held clearing, up from the 43.8 per cent the week prior when a similar volume of auctions was held. One year ago, Sydney’s clearance rate was 61.3 per cent across 818 auctions.
Across the smaller auction markets, Canberra returned the strongest final clearance rate of 64.6 per cent last week, followed by Adelaide where 62.3 per cent of homes sold, while only 11.1 per cent of Perth homes sold last week.
Looking at the non-capital city regions, the Geelong region was the most successful in terms of clearance rates with 48.5 per cent of the 41 auctions recording a successful result.
This week, CoreLogic is tracking 1,725 auctions across the combined capital cities, which is slightly lower than last week. Compared to one year ago, volumes are down over 30 per cent (2,525).
They also highlighted the growing settlement risk relating to off the plan high-rise sales. Prospective buyers may sign a contract to purchase from the plan, but when the unit is ready – perhaps a year or two later, a bank mortgage valuation may not cover the purchase price. Meaning the buyer may be unable to complete the transaction. CoreLogic says that in Sydney, 30% of off-the-plan unit valuations were lower than the contract price at the time of settlement in September, double the percentage from a year ago. In Melbourne, 28% of off-the-plan unit settlements received a valuation lower than the contract price. In Brisbane, where unit values remain 10.5% below their 2008 peak, the proportion was substantially higher, at 48%. And they also argue that loss making resales are rising, especially in the unit sector, although it does vary by location.
The latest housing finance figures from the ABS showed that lending flows for owner occupied buyers appear to be following the lead from the investment sector. Both were down. This is consistent with our household surveys. Looking at the original first time buyer data, the number of new loans fell from 9,614 in July to 9,534 in August, a fall by 80, or 0.8%. As a proportion of all loans written in the month, the share by first time buyers fell from 18% to 17.8%.
Looking at the trend lending flows, the only segment of the market which was higher was a small rise in refinanced owner occupied loans. These existing loans accounted for 20.5% of all loans written, up from 20.3%, and we see a rising trend since June 2017, from a low of 17.9%. Total lending was $6.3 billion dollars, up $31 million from last month. Investment loan flows fell 1.2% from last month accounting for $10 billion, down 120 million. Owner occupied loans fell 0.6% in trend terms, down $81 million to $14.5 billion. 41% of loans, excluding refinanced loans were for investment purposes, the lowest for year, from a high of 53% in January 2015.
On these trends, remembering that credit growth begats home price growth, the reverse is also true. Prices will fall further, the question remains how fast and how far? We will be revising our scenarios shortly.
The latest weekly indices from CoreLogic shows price falls in Sydney, down 0.16%, Melbourne down 0.18%, Brisbane down 0.08%, Adelaide down 0.09% and Perth down 0.38% giving a 5 cities average of down 0.18%.
Morgan Stanley revised their house prices forecasts, down. They say “We struggle to see improvement in any of our components over the next year. We now see a 10-15 per cent peak to trough decline in real house prices (from 5-10 per cent), which would mark the largest decline since the early 1980s. With households 2x more leveraged to housing than back then, the impact on housing equity would be larger again. This downgrade largely reflects the downturn’s extended length, as we expect the relatively orderly declines to date will continue. However, an acceleration of declines is in our bear case, and we will continue to monitor stress points, including arrears trends. Strong employment growth and temporary migration has helped contain reported vacancy rates thus far, but we see a sustained overbuild into 2019 weighing on rentals”.
NABs latest quarterly property survey index fell sharply in Q3, to the lowest level in 7 years, Sentiment was dragged lower by big falls in NSW and VIC. NAB’s view is the orderly correction in house prices will continue over the next 18-24 months with Sydney falling around 10% peak to trough and Melbourne 8%. This reflects a bigger fall than previously expected but would still leave house prices well up on 2012 levels. Their central scenario does not include a credit crunch event leading to disorderly falls in house prices. They also say the boom in Australian real estate sales to foreign investors has run its course, with NAB’s latest survey results continuing to highlight a decline in foreign buying activity resulting from policy changes in China on foreign investment outflows and tighter restrictions on foreign property buyers in Australia. In Q3, there were fewer foreign buyers in the market for Australian property, with their market share falling to a 7-year low of 8.1% in new housing markets and a survey low 4.1% in established housing markets.
Expect the calls for an increase in migration, and a freeing of lending standards to reach fever pitch – both of which MUST be ignored. We have to get back to more realistic home price ratios, despite the pain. So it was interesting to note that the NSW State Government this week, suggested that migration needed to slow, to provide breathing space, and for infrastructure to catch up. Better late than never. Remember the 2016 Census revealed that Australia’s population increased by 1.9 million people (+8.8%) in the five years to 2016, driven by a 1.3 million increase in people born overseas (i.e. new migrants)!
We published our latest household survey data this week. Mortgage stress rose again, to cross the one million households for the first time ever. We discussed the results in full in our post “Mortgage Stress Breaks One Million Households” The latest RBA data on household debt to income to June reached a new high of 190.5. This high debt level helps to explain the fact that mortgage stress continues to rise. Across Australia, more than 1,003,000 households are estimated to be now in mortgage stress (last month 996,000). This equates to 30.6% of owner occupied borrowing households. In addition, more than 22,000 of these are in severe stress. We estimate that more than 61,000 households risk 30-day default in the next 12 months. We continue to see the impact of flat wages growth, rising living costs and higher real mortgage rates. Bank losses are likely to rise a little ahead.
Moodys released a report suggesting that Mortgage delinquencies and defaults are more likely to occur in outer suburbs of Australian cities than inner-city areas, because of the lower average incomes and weaker credit characteristics in these suburbs. “Delinquency rates are highest in outer suburban areas. On average across Australian cities, mortgage delinquency rates are lowest in areas within five kilometers of central business districts and highest in areas 30-40 kilometers from CBDs. In the residential mortgage-backed securities they rate, delinquency rates are in many cases higher in deals with relatively large exposures to mortgages in outer areas.
We agree there are higher loan to value and debt to income ratios in the outer areas, but the overall debt commitments are higher closer in and so we suspect that many more affluent households are going to get caught, because of multiple mortgages, including investment mortgages and their more affluent lifestyles. My thesis is the banks have been lending loosely to these perceived lower risk high income households, but it ain’t necessarily so…
We also published our Household Financial Confidence index. The latest read, to end September shows a further fall, and continues the trend which started to bite in 2017. The current score is 88.4, just a bit above the all-time low point of 87.69 which was back in 2015. Last month – August – it stood at 89.5. You can watch our video “Household Financial Confidence Drifts Lower Again” where we discuss the results. We expect to see the index continuing to track lower ahead, because the elements which drive the outcomes are unlikely to change. Home prices will continue to move lower, the stock markets are off their highs, wages are hardly growing and costs of living are rising. Household financial confidence is set to remain in the doldrums.
Finally, we also published our survey results in terms of forward intentions. So what is in store for the next few months? Well, in short it’s more of the same, only more so, with more households reporting difficulties in obtaining finance, fewer expecting to transact in the next year and to see home prices rise. You can watch our video “Decoding Property Buying Intentions” where we analyse the results. The single most startling observation is the fall in the number of property investors, including those who hold portfolios of investment properties intending to transact. 20% of portfolio investors are expecting to transact, and the bulk of these intend to sell a property, compared with a year ago when 50% said they would transact, and most were looking to add to their portfolios. Most solo property investors are now on the side lines, with around 10% expecting to transact, and most of these on the sell side. Demand for investment property will continue to fall, as rental yields and capital appreciation fall.
So to the markets.
Locally, the ASX 100 ended the week well down, although there was small rise on Friday, after the heavier falls earlier in the week. We ended at 4,849, up 0.20%. The local volatility index remains elevated, ending at 20.4 on Friday, though that 6.5% lower than the previous day. Expect more ahead.
The ASX Financials index however did less well, and ended at 5,744, up just 0.03% and below the June lows. The banking sector is under pressure, for example Macquarie ended at 115.5, up 0.03% on the day, but well down from its 125 range. And AMP continues to languish at 3.05. We heard from some of the major bank CEO’s this week, with Westpac and ANZ apologising for the issues revealed in the Royal Commission, but I also note that CBA has so far only addressed one of the many issues which APRA agreed with them in terms of behavioural remediation. The banks have a long way to go to regain trust, and we expect more weakness ahead. And the latest estimates are that the sector will be up for something like $2.4 billion dollars in remediation costs and other charges. And guess who will end up paying for their bad behaviour?
The Aussie ended the week at 71.10, having reached the 70.5 range in the week. This has more to do with the US dollar movements than changes in sentiment here.
There are debates about what caused the significant falls, after all the FED rate lift strategy, and the trade wars have been around for some time. But my guess is the market has finally understood the era of low-cost or no-cost money is over. Thus expect more volatility ahead. The US fear index fell back on Friday, down 13.8% to 21.31, but is still elevated.
In fact, Wall Street indexes rose on Friday after a week of significant losses as investors returned to technology and other growth sectors, but gains were hampered by ongoing worries about U.S.-China trade tensions and rising interest rates.
Energy and financial stocks continued to fall and bank stocks kicked off the third-quarter financial reporting season with a whimper, while investors fled insurance stocks after Hurricane Michael slammed into Florida.
The technology sector was the biggest gainer of the S&P’s 11 major industry indexes, with a 1.5 percent advance, but it was still on track for its biggest weekly drop since March. The Dow Jones ended up 1.15% to 25,340, but is well off its recent highs. The NASDAQ was up more, 2.29% to 7,497, as buyers came back into the sector. The S&P 500 ended up 1.37% to 2,765.
All three indexes were on track for their biggest weekly declines since late March.
The S&P Financial index was down 0.42% to 465.07, on mixed trading results which came out on Friday. The S&P 500 banks subsector slid 1.6 percent. The biggest drag on the subsector was JPMorgan Chase & Co which reversed early gains to trade down 2 percent despite its quarterly profit beating expectations. PNC Financial led the percentage losers among bank stocks, with a 6.5 percent drop after the regional bank reported disappointing quarterly loan growth and said it expected only a small improvement in lending this quarter. The only gainers among banks were Citigroup, which rose 0.6 percent, and Wells Fargo which eked out a 0.64 percent gain after upbeat results.
The bank results launch a quarterly reporting season that will give the clearest picture yet of the impact on profits from President Donald Trump’s trade war with China.
The short term 3-Month Treasury remained flat at 2.27 at the end of the week, while the 10-Year bond rose a little to 3.165, up 1.09%. The Treasury yield is now at a 7-year high. The suspicion is that perhaps rates have turned and will go higher still, as a longer term view shows. It is also interesting to compare the US 3-Month Bill Rate minus the same rates in Germany and the UK. Short term rates in the US are higher, in fact reaching the highest positive difference since September 1984. This highlights the different path now being taken by the US, but the fall-out will be global.
Gold, which had moved higher among the market ructions, slide a little, and was down 0.52% on Friday to end at 1,221. Bitcoin finished at 6,316 up 0.57%, and continues in its marrow range for now. And Oil which had fallen earlier in the week moved up 0.72% to 71.48.
Finally, it’s worth noting that the Reserve Bank Of New Zealand is now publishing a bank specific set of scorecards to help consumers weigh up the risks bank to bank. This is essential, given the now explicit Deposit Bail-In which exists there. We discussed this most recently in our Post “The Never Ending “Bail-In” Scandal, and in the Video that Economist John Adams and I released yesterday. In fact, the bank specific data which is available in Australia is derisible compared with the NZ stats, but I came across this slide from LF Economics which highlights how the ratio of Bank Loans To Bank Deposits compares across a number of Banks, including the big four. It’s fair to assume the higher the ratio, the greater the potential risk. Westpac, CBA, NAB and ANZ are all in the top half. I believe we need more specific disclosure from the sector, and I suggest that APRA continues to provide only a partial view of the banking system here. The fact is, Bail-In, or no, we need much more transparency. It would help to negate the spin presented in the RBA’s Financial Stability Review, which in my view is not effective. Oh, and look out for our joint video on Gold, coming up in the next few days, it will surprise you!
Finally, a reminder that on Tuesday 16th October at 20:00 Sydney we are running our next live stream Q&A event. The reminder is up on YouTube, and you can send me questions before hand, or join in the live chat. So mark your dairies.
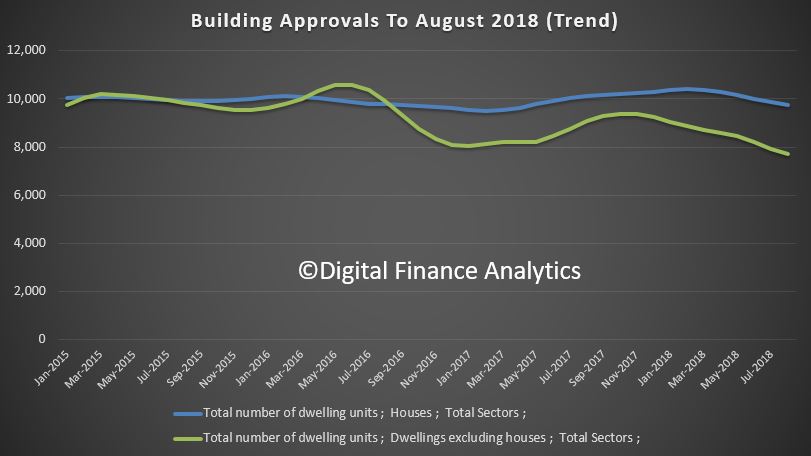
The ABS data released today shows that the number of dwellings approved in Australia fell by 1.9 per cent in August 2018 in trend terms.
In seasonally adjusted terms, total dwellings fell by 9.4 per cent in August, driven by a 17.2 per cent decrease in private dwellings excluding houses. Private houses fell 1.9 per cent in seasonally adjusted terms.
We will continue to base our analysis on the trend data, but this will understate more recent falls…
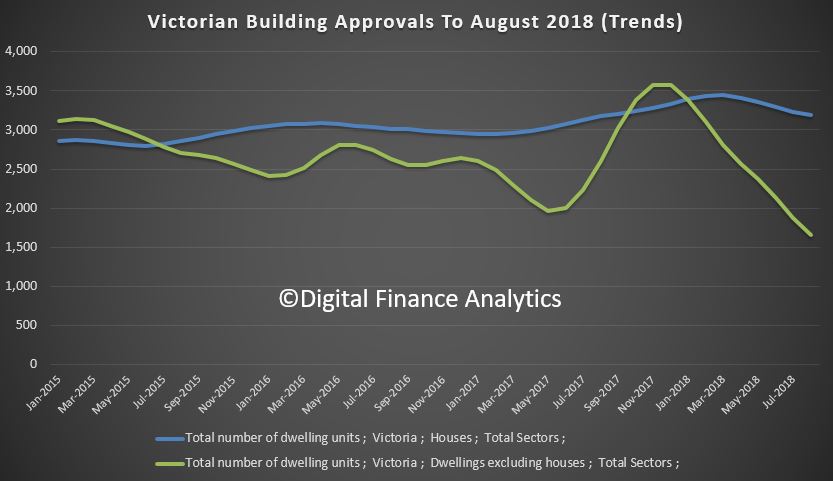
The cause is simple, a significant fall in the number of new high-rise residential development applications, especially in Victoria. Recent falls in demand and prices suggests a significant reduction in momentum is on the cards there.
Justin Lokhorst, Director of Construction Statistics at the ABS said “The fall was mainly driven by private dwellings excluding houses, which decreased by 2.7 per cent in August, Private sector houses also fell, by 1.2 per cent.”
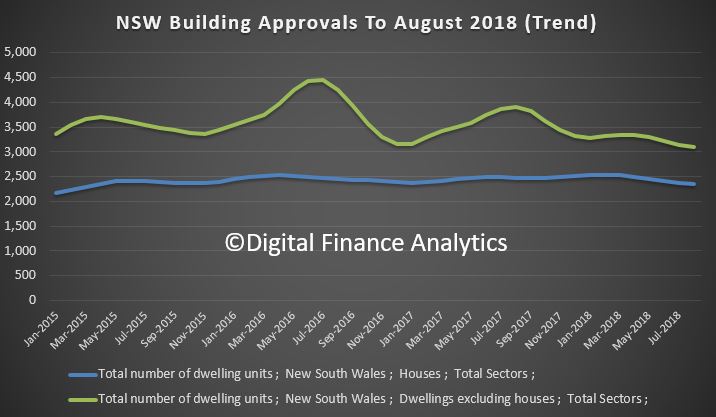
Among the states and territories, dwelling approvals fell in August in Victoria (5.1 per cent), South Australia (3.6 per cent) and New South Wales (1.6 per cent) in trend terms.
Dwelling approvals rose in trend terms in Western Australia (2.7 per cent), Tasmania (2.3 per cent), Northern Territory (1.5 per cent) and Australian Capital Territory (0.1 per cent). Dwelling approvals were flat in Queensland. But the significant falls in the two most populated states swamps any better news elsewhere.
In trend terms, approvals for private sector houses fell 1.2 per cent in August. Private sector house approvals fell in Queensland (3.3 per cent), Victoria (1.4 per cent), New South Wales (1.1 per cent) and South Australia (0.7 per cent), but rose in Western Australia (1.4 per cent).
The value of total building approved fell 1.3 per cent in August, in trend terms, and has fallen for nine months. The value of residential building fell 0.8 per cent while non-residential building fell 2.3 per cent.
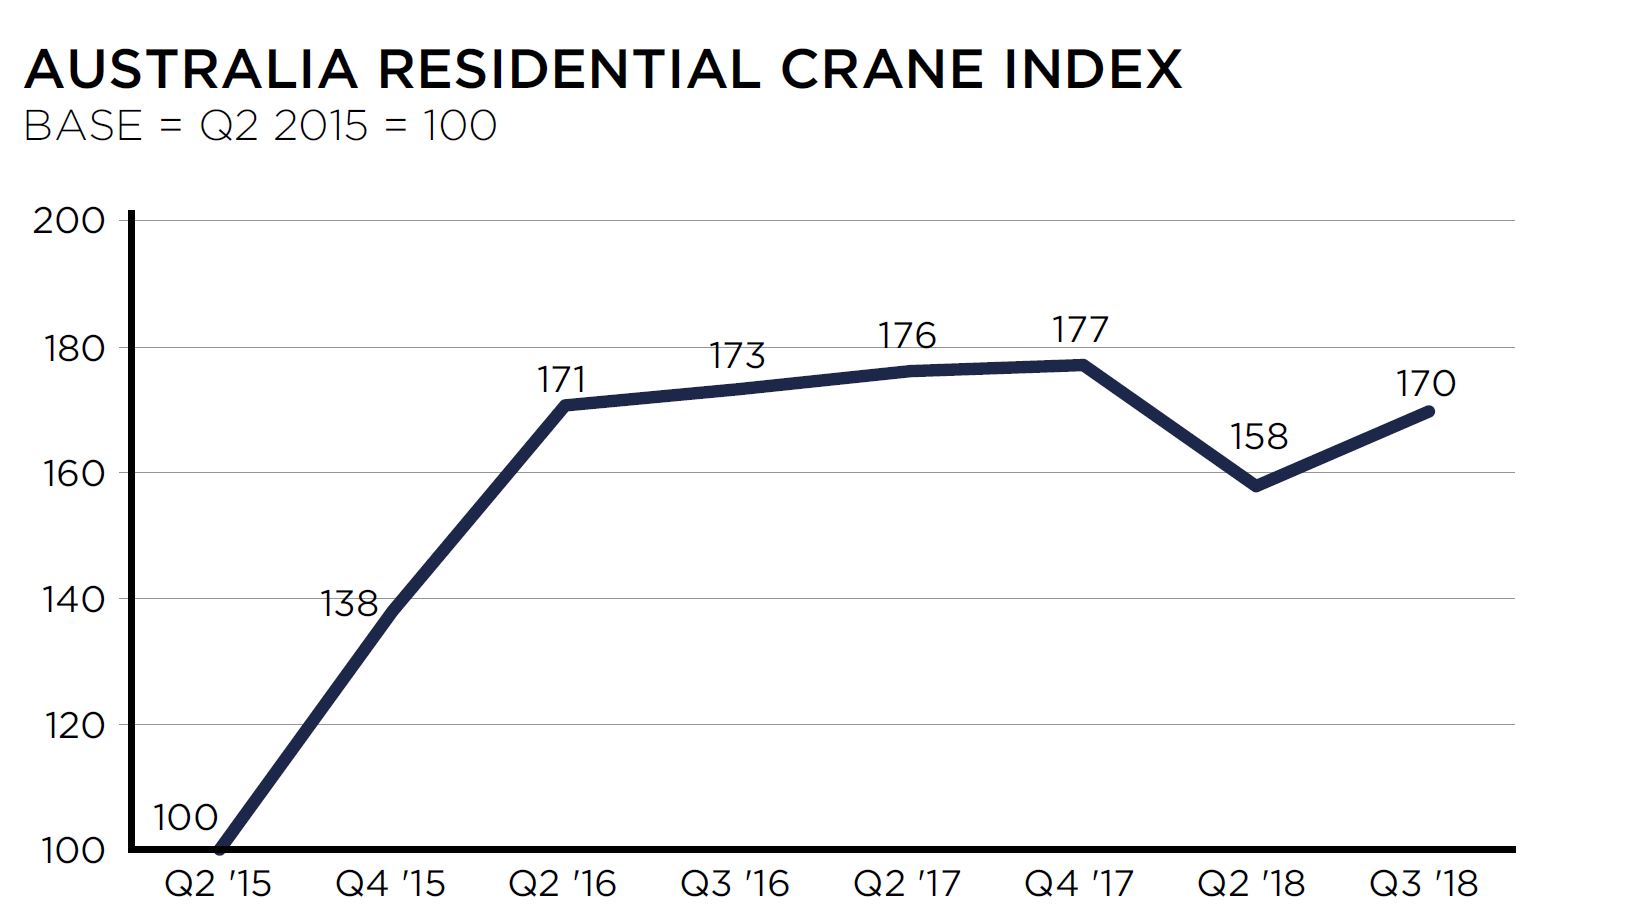
Now, its worth comparing this approvals data with the latest RLB Crane Index, an interesting measure of construction activity (especially high-rise development).
Their Q3 2018 data – the 13th edition of the RLB Crane Index has seen
Australia reach a new record high of 173. Nationally, the number of cranes rose 7%, to 735, the highest count. Melbourne and Newcastle saw a strong crane increases, overtaking the record levels reached six months earlier. Sydney continues to decline from the peak reached in Q4 2017, falling 6%.
They say that the residential index pick up from its fall in Q2 2018, increasing 8%, to 170. Additionally, the non-residential index continued its rise, increasing 7%, recording a new high of 180. Recent construction statistics released by the Australian Bureau of Statistics highlight the ongoing strength of the construction industry. For FY 2018,total construction in Australia reached $221 billion.
Strong increases were seen in the non-residential and engineering construction sectors of 11.1% and 20.7% respectively, while the residential building sector remained constant at $74 billion.
They say that Melbourne’s crane numbers rose, increasing by 35 cranes. Driving this rise is the civil sector with the introduction of 13 new cranes. All
other sectors remained strong, either maintaining or increasing cranes from the count six months ago.
Since its peak in Q3 2017, Sydney’s crane count has been falling, driven by a declining residential sector. The residential crane count has fallen by 55 cranes from its peak in Q4 2017, while the non-residential sector recorded an increase of 26 cranes.
Brisbane has bounced back from its dip in the last edition, driven by a rise in mixed-use projects. While the residential sector remained stable, 11 new cranes were added to the mixed use sector.
The Residential Crane Index at 170 is just below the peak in late 2017 of 177. Note this is NOT the number of cranes. However, we suspect construction momentum is easing, so the number is likely to fall in the months ahead, and the index will decline – Melbourne looks likely to be worst hit in the months ahead.
Welcome to the Property Imperative weekly to 29th September 2018, our digest of the latest finance and property news with a distinctively Australian flavour.
Another mega week, with the Royal Commission interim report out, the FED lifting rates, APRA releasing their banking stress tests, more class actions launched and Banks lifting their provisions to cover the costs of remediation, so let’s get stuck in…
Watch the video or read the transcript.
And by the way you value the content we produce please do consider joining our Patreon programme, where you can support our ability to continue to make great content..
The Royal Commission Interim Report came out on Friday and turned the spotlight on the Greed driving Financial Services to sell at all costs, take fees from dead people, and reward anti-customer behaviour. The report also called into question the role of the regulators, saying they were weak, and did not do their job. In fact, it’s not the lack of appropriate law, but it is noncompliance, without consequence which is the issue. They also raised the question of the STRUCTURE of industry. We discussed this in an ABC Radio National Programme, alongside Journalist Adele Ferguson and Ex. ACCC boss Graeme Samuel, and also in our show “Inside The Royal Commission Interim Report”.
The Royal Commission has touched on the critical issues which need to be considered. But now we have to take the thinking further. In terms of structure, we should be thinking about how to break up the financial services sector into smaller more manageable entities that are not too big to fail. We should separate insurance from wealth management from core banking, and separate advice from product selling and manufacturing. There is a clear opportunity to implement Glass Steagall, which separates risky speculative activity from core meat and potatoes banking services we need. There is a big job to be done in terms of cultural change, within the organisations, as they shift to customer centricity – building their businesses around their customers. This requires different thinking from the top. Also Regulators have clearly not been effective because they were too close and too captured. This must be addressed. The industry has played them, being prepared to pay small penalties if they get caught as just a cost of doing business. No real consequences.
Poor culture is rife across the industry and regulators. For example, LF Economics Lyndsay David tried under a FOI request to get APRA to release details of its targeted reviews into the mortgage sector from 2016. Specifically whether Treasury were aware of the results. They were not.
The review was never intended to made public but was revealed during the Hayne Royal Commission. It found that at Westpac only one in 10 of banks’ lending controls were operating effectively. In fact, APRA had ordered these “targeted review” in October 2016 and were conducted by PWC for WBC and CBA. On 12 October 2016, APRA issued a letter to the Bank and 4 other large banks requesting that they undertake a Review into the risks of potential misrepresentation of mortgage borrower financial information used in loan serviceability assessments. In its letter, APRA referenced assertions made by commentators that “fraud and manipulation of ADI residential mortgage origination practices are relatively commonplace”. Frankly the fact that these were buried, and the APRA still refuses to release they tells us more about APRA than anything else. After all we know mortgage fraud was widespread.
In this light, the APRA stress tests results, is on the same theme, high level, and vague, compared with the bank by bank data the FED releases, it’s VERY high level! In APRA’s view, the results of the 2017 exercise provide a degree of reassurance: ADIs remained above regulatory minimum levels in what was a very severe stress scenario. John Adams and I discussed this recently in our post “The Great Airbrush Scandal” APRA is not convincing.
ASIC revealed this week that it has identified serious, unacceptable delays in the time taken to identify, report and correct significant breaches of the law among Australia’s most important financial institutions. It can they say take over 4.5 years to identify that a breach incident has occurred! ASIC chair said “Many of the delays in breach reporting and compensating consumers were due to the financial institutions’ inadequate systems, procedures and governance processes, as well as a lack of a consumer orientated culture of escalation”.
So now there is a growing sense of panic as according to the Australian, for example, from APRA who says a horde of Australia’s biggest financial institutions and superannuation funds have been forced by the prudential regulator to ram through an in-depth review of their culture and governance before the royal commission ends next year. After copping heavy criticism over the course of Kenneth Hayne’s royal commission over a lack of enforcement in the financial sector, the Australian Prudential Regulation Authority has demanded Westpac, ANZ and National Australia Bank mimic the landmark cultural investigation of Commonwealth Bank the regulator launched late last year. Along with the major banks, some of the nation’s biggest union and employer-backed super funds — such as the $40 billion Hostplus, $35bn fund Cbus and $50bn REST super fund — have also been asked by APRA to review their culture.
And from the industry, for example the AFR reported that Westpac hauled each of its 40,000 bankers into urgent briefings by chief executive Brian Hartzer this week, before the Royal Commission Report came out, who warned them to bring forward customer problems.
Westpac also announced that Cash earnings in Full Year 2018 will be reduced by an estimated $235 million following continued work on addressing customer issues and from provisions related to recent litigation. This included increased provisions for customer refunds associated with certain advice fees charged by the Group’s salaried financial planners due to more detailed analysis going back to 2008. These include where advice services were not provided, as well as where we have not been able to sufficiently verify that advice services were provided; Increased provisions for refunds to customers who may have received inadequate financial advice from Westpac planners; Additional provisions to resolve legacy issues as part of the Group’s detailed product reviews; Provisions for costs of implementing the three remediation processes above; and Estimated provisions for recent litigation, including costs and penalties associated with the already disclosed responsible lending and BBSW cases. Costs associated with responding to the Royal Commission are not included in these amounts.
Across the industry more than $1 billion has been put aside, so far and more to come. And guess who will ultimately pick up the tab for these expenses – yes we the customers will pay!
Another class action was announced this week as Law firm Slater and Gordon said it had filed class action proceedings in the Federal Court against National Australia Bank and MLC on behalf of customers sold worthless credit card insurance. Most were existing NAB customers and the bank should have known the insurance was likely to be of little or no benefit to them. Despite knowing this, NAB have continued to push the insurance widely, reaping millions in premiums while doing so. most people were sold the insurance over the phone and were not given a reasonable opportunity to understand the terms and conditions of the policy.
We continued to debate the trajectory of home price falls, as Media Watch discussed the 60 Minutes segment we were featured in. Once again somewhat myopic views were expressed by host Paul Barry, as we discussed on our recent post. You can also watch the 60 Minutes segment on YouTube which covers my views more comprehensively. Prices are set to fall further. Period.
Realestate.com.au says that according to a survey of property experts and economists further falls in housing prices across Australia’s cities are expected. They suggest an 8.2% fall in house prices in Sydney, a 8.1% fall in Melbourne and a 7% fall in Brisbane. In fact all centres are expected to see a fall. Finder.com.au insights manager Graham Cooke was quoted as saying that the cooling market conditions made it harder for existing homeowners to build up equity. But they could be good news for first-home buyers with a deposit in hand. “If you’re thinking of getting into the market over the next few years, hold out until prices have dropped further and use this time to save for your upfront costs,” he said. “Right now, there’s no need to jump on the first suitable property you see. Waiting a few years could potentially save you thousands of dollars.”
Damien Boey at Credit Suisse said this week that by the start of 2020, Sydney house prices could have dropped by 15-20% from their 2017 peak. The market is heavily oversupplied, even before we consider the risk of higher insolvency activity and foreclosure sales. He argues that demand is the problem – not credit supply. We could ease lending standards from here, and still not cause housing demand to bounce back. Investors cannot sustain capital growth by themselves. They need a “greater fool” to on sell their houses too. But foreign demand is weak, and first home buyers are priced out of the market. Specifically, Chinese demand for property is weak, as evidenced by low levels of outward direct investment, and the failure of the AUD to rise in response to CNH weakness. Promised relaxation of capital controls has not eventuated, and CNY devaluation pressure has had a negative impact on credit conditions, as well as the ability of Chinese residents to export capital abroad. Finally, dwelling completions are still rising in response to high levels of building approvals from more than a year ago – the building lead time has lengthened significantly. As for the RBA, any rate cuts from here are unlikely to be passed on in full to end borrowers, given counterparty credit risk concerns in the interbank market.
UBS Global Housing Bubble Index came out and showed that Sydney had slipped from 4th to 11th in a year. They noted that Prices peaked last summer and have slid moderately as tighter lending conditions reduced affordability. Particularly since the land tax surcharge more than doubled and a vacancy fee was introduced, the high end of the market has suffered most. The vacancy rate on the rental market has also climbed. Nevertheless, inflation-adjusted prices are still 50% higher than five years ago, while rents and incomes have grown at only single-digit rates.
Corelogic reported further prices falls this week in Sydney, down 0.57%, Melbourne down 0.79%, Adelaide, down 0.15%, Perth down 0.73%, while Brisbane rose a little up 0.06%. Melbourne looks to be the weakest centre currently, and we continue to expect to see further falls.
CoreLogic says that last week 2,404 homes went to auction across the combined capital cities, returning a final auction clearance rate of 52.4 per cent, slightly higher than the 51.8 per cent the previous week which was the lowest seen since Dec-12. Over the same week last year, 2,782 homes went to auction and a clearance rate of 66.2 per cent was recorded.
Melbourne’s final clearance rate was recorded at 53.8 per cent across 1,161 auctions last week, compared to 54.1 per cent across a lower 988 auctions over the previous week. This time last year a higher 1,361 homes were taken to auction across the city and a much stronger clearance rate was recorded (70.6 per cent).
Sydney’s final auction clearance rate came in at 51.1 per cent across 851 auctions last week, up from 48.6 per cent across 669 auctions over the previous week. Over the same week last year, 1,033 Sydney homes went to auction returning a final clearance rate of 65.9 per cent.
Across the smaller auction markets, clearance rates improved across Adelaide and Tasmania, while Brisbane, Canberra and Perth saw clearance rates fall week-on-week.
Of the non-capital city auction markets, the Geelong region was the best performing in terms of clearance rate (61.1 per cent), followed by the Hunter region where 58.8 per cent of homes sold.
The combined capital cities are expecting 65 per cent fewer homes taken to market this week, with half the nation host to an upcoming public holiday, combined with both the NRL and AFL grand finals being held over the weekend, it looks to be a quiet week for the auction markets.
There are 846 capital city auctions currently being tracked by CoreLogic this week, down from the 2,404 held last week and lower than the 969 auctions held over the same week last year.
Finally, the latest RBA and APRA lending statistics, plus the June quarter household ratios, shows that credit growth is still too strong, with the 12-month growth by category shows that owner occupied lending is still growing at 7.5% annualised, while investment home loans have fallen to 1.5% on an annual basis. Overall housing lending is growing at 5.4% (compared with APRA growth of 4.5% over the same period, so the non-banks are clearly taking up some of the slack). Still above wages and inflation. Household debt continues to rise.
The non-bank sector (derived from subtracting the ADI credit from the RBA data) shows a significant rise up 5% last month in terms of owner occupied loans. APRA needs to look at the non-banks. And quickly. This was confirmed looking at the rising household debt to income ratios, where in short the debt to income is up again to 190.5, the ratio of interest payments to income is up, meaning that households are paying more of their income to service their debts, and the ratio of debt to home values are falling. All three are warnings. The policy settings are not right. You can watch our show “What Does The Latest Data Tell Us? But for now it is worth highlighting that despite all the grizzles from the property spruikers, mortgage lending is STILL growing…. and faster than inflation. We have not tamed the debt beast so far, despite failing home prices. No justification to ease lending standards – none.
So to a quick look at the markets. The ASX 200 Financial Sector Index was up 1.20% on Friday to close at 6,127 – in a relief rally that the Royal Commission report was not worse (and the prospect of less regulation was mooted). We think this will reverse as the full implications of the report are digested, but of course the market profits from volatility. CBA, the biggest owner occupied mortgage lender was up 1.9% to close at 71.41, despite some analysts now suggesting a fair price closer to 65.00. Both are a long way from the 81.00 it reached in January. It will not return there anytime soon.
Westpac rose 1.16% to close at 27.93, still well off its November 2017 highs of 33.50, National Australia Bank rose 1.76% to 27.81 and ANZ closed at 28.10 up 1.4%. AMP, who has already been hit hard by the Royal Commission rose 1.59% to 3.19, still way down on its March highs before the revelations came out. Macquarie Group fell 1.34% and ended at 126.04. Suncorp ended at 14.46, up 0.84% and Bendigo Adelaide Bank rose 1.22% to 10.75. The Aussie ended up a little to 72.22, 0.19% higher on Friday, but with still more falls expected ahead, we think it could test 71.00 quite soon.
In the US markets, the Dow Jones Industrial ended at 26,458, up 0.07%, but off its recent highs, the NASDAQ ended up 0.05% to 8,046, while the S&P 500 was flat at 2,913. The Volatility index was lower, at 12.12, down 2.34%. The bulls are, in the short term at least, firmly in control.
Gold was up 0.74% to 1,196, but still in lower regions than last year, reacting to the strength of the US Dollar. Oil was higher again, up 1.41% to 73.53. In fact, until sizable supply is offered up by OPEC some are suggesting we could see prices above the $100 per barrel market, but $100 seems an overreach on the current charts.
On the currencies, the Yuan USD was up 0.31% to 14.56, as China continues to manage the rate lower. Of course the trade wars are in full play.
President Trump has announced a 10% tariff on $200 billion in Chinese imports. That tariff is currently 10%, but at the end of 2018, that’s expected to rise to 25%. This is the third round of tariffs, and it’s the largest round of tariffs. Back in July, we had $34 billion worth of Chinese goods tariffed. Then, in August, we had a follow-on of $16 billion in tariffs. So, this is really a huge jump up of $200 billion. This is affecting all kinds of goods. The U.S. brings in a little over $500 billion worth of goods from China. The $250 billion so far this year is roughly half, but Trump has said that if China were to take retaliatory action on these tariffs, which they have, in fact, then he’s going to put in place another $267 billion worth of imports. For all intents and purposes, that would put a tariff in place on 100% of U.S.-China trade.
China also announced some tariffs on $60 billion worth of goods that also went into effect on September 24th. This is in addition to, China had also had previously announced tariffs of $50 billion. The total U.S.-China trade is about $130 billion dollars of imports of United States goods into China. This second round of Chinese tariffs is going to now cover $110 billion dollars of the $130 billion of U.S.-China trade — again, almost 100% of the entire trading relationship.
So, this is pretty significant in that almost all the cards have been played here. If all the threats and allegations with regard to tariffs are followed through upon, all of U.S.-China trade is set to be under some kind of tariff barrier in 2018. This will be a big deal.
The 10 Year Bond rate was up 0.29% to 3.065 after the Fed rate hike this week. The Fed moved as expected, and continues to highlight more upward movements in the months ahead – in fact their language is arguably more bullish now. The target range for the federal funds rate is now 2 to 2-1/4 percent. In their projection release, they see GDP sliding from 2019…. while inflation is expected to rise. The 3-month rate was up 0.35% on Friday to 2.207., still signalling a recession risk down the track. We discussed the impact of the US Rated move in our show “The FED Lifts, More Ahead And What Are The Consequences?”
Finally, turning to Crypto, Bitcoin ended down 1.43% to 6,617. Little signs of new directions here in the short term.
So in summary a week dominated by the Royal Commission locally, against a back cloth of higher international interest rates, and risks. We are, as they say, set for interesting times ahead.