The ACCC has issued a draft determination proposing to authorise SA Housing Authority and Renewal SA to enter into arrangements with land and property developers to increase the supply of affordable housing in the greater metropolitan region of Adelaide.
The government of South Australia has set a goal that 15 per cent of all new significant developments should be available as affordable housing.
Affordable housing is to be made available to people in the low to moderate income category, who are often employed in the health care, social services and administrative support occupations.
Under the proposed arrangements, SA Housing Authority and Renewal SA may ask developers to agree to cap prices for properties in some developments, agree to rent or sell to specified tenants or purchasers and agree not to compete for the rental or sale of property.
“The ACCC considers that the arrangements are likely to contribute to an increase in the supply of affordable housing in the greater metropolitan region of Adelaide. People who may otherwise find themselves excluded from both the general housing market and social housing, are likely to benefit from an increase in affordable housing,” ACCC Commissioner Mr Roger Featherston said.
“The arrangements are unlikely to result in public detriment. Housing affordability criteria are set and published by the government of South Australia and developers have a wide range of land and property developments from which to choose.”
The ACCC proposes to grant authorisation for 10 years and expects to make a final determination in November 2018.
Further information about the application for authorisation, including copies of the ACCC’s draft determination and public submissions, is available at SA Housing Authority and Renewal SA.
Authorisation provides statutory protection from court action for conduct that might otherwise raise concerns under the competition provisions of the Competition and Consumer Act 2010. Broadly, the ACCC may grant an authorisation when it is satisfied that the public benefit from the conduct outweighs any public detriment.
Authorisation is sought as the proposed conduct may contain a cartel provision.
Background
SA Housing Authority and Renewal SA, and land and property developers may be considered competitors for the supply of affordable housing.
Therefore, by arranging to cap prices and not compete for the supply of rentals and the sale of properties, they risk breaching competition laws unless they have ACCC authorisation.
The ABS data on migration shows a 9% fall since visa changes made in April 2017. No surprise then the HIA bemoans the fall, pointing to slowing demand for new property.
Of course this is another reason why home prices are likely to go lower.
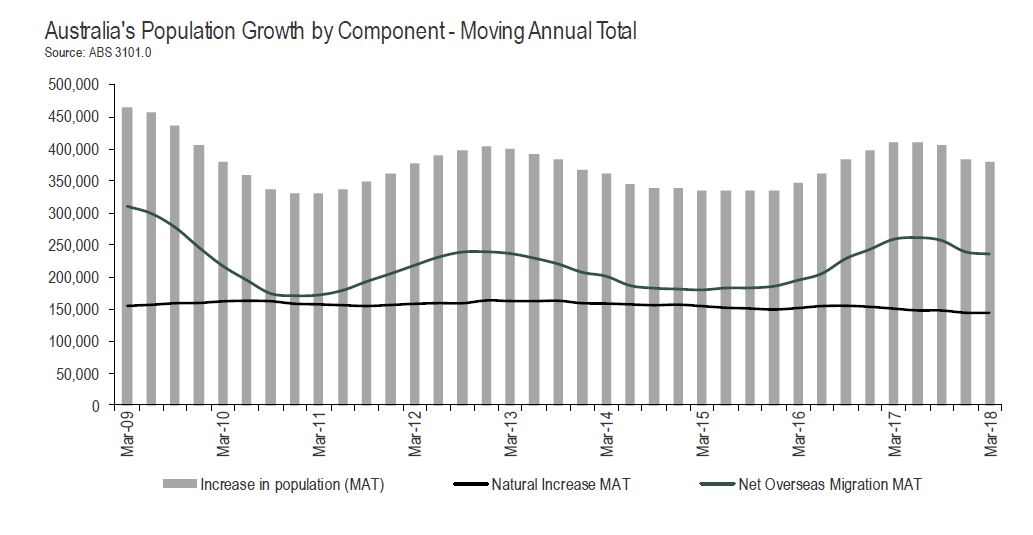
ABS data released today shows that Australia’s annualised population growth rate slowed for the fourth consecutive quarter.
Over the year to March 2018, Victoria saw the strongest growth in population (+2.2 per cent), followed by the ACT (+2.1 per cent) and Queensland (+1.7 per cent). New South Wales was fourth fastest (+1.6 per cent) with Tasmania fifth (+1.0 per cent), Western Australia sixth (+0.8 per cent) and South Australia seventh (+0.7 per cent). The population of the Northern Territory has actually declined over the last two quarters and the annual rate of growth has slowed to 0.1 per cent.
“Australia’s overseas migration fell by 9 per cent since changes to visa requirements came into force in April 2017, slowing the population growth rate to 1.6 per cent,” Mr Murray added.
“In April 2017, Australia introduced a range of visa changes which have been successful in reducing the number of skilled migrants arriving in Australia.
“The current phase of Australia’s 28 years of continuous economic growth is built upon the arrival of skilled migrants. Skilled migration is necessary to offset the impact of our aging population.
“Looking domestically, states such as New South Wales and Victoria that have benefitted the most from overseas migration over recent years are now seeing population growth rates slowing.
“The slowing rate of population growth, while it remains high for a developed economy, will contribute to slower growth of household consumption.
“This means slower growth in sectors such as retail and residential building. Given that these two sectors are amongst the nation’s largest employers the risks presented a decline in population growth should not be underestimated,” concluded Mr Murray.
Welcome to the Property Imperative weekly to 15th September 2018, our digest of the latest finance and property news with a distinctively Australian flavour.
Watch the video, listen to the podcast or read the transcript.
On the 10th Anniversary of the failure of Lehman Brothers, the consensus seems to be that the financial system is still stressed, under the impact of sky high global debt, artificially low interest rates and asset bubbles. The shadow is long, and the risks high. I discussed this on ABC Radio Sydney, and also in a Video Post with Robbie Barwick from the CEC. Perhaps of most concern is the lack of acceptance that we have a problem, with the RBA this week recognising that household debt is high, but declaring it manageable and the Housing Industry Association calling for a relaxation of lending standards to support housing construction. That is in my view the last thing we need. The truth is, pressures on households, and tighter lending standards mean more price falls will follow. Those who follow my analysis will know I run four scenarios, including the one, the worst case, where prices could drop 40-45% from their highs over the next few years. This is the angle which the upcoming 60 Minutes programme, to be aired tomorrow, Sunday is driving at.
Just remember this is one of four scenarios! But its rated a 20% probability now.
There was more evidence this week as to the issues under the hood. For example, Domain says that whilst housing affordability has improved in all capitals where property prices have started to decline, the median multiple is still well above affordable housing thresholds in several capital city markets. They said that drawing on Domain price data and adjusted census income data, the change in price and the median multiple across capital city markets, since the respective peaks, was analysed.
While the house price to income ratio is a simple, standard indicator for understanding affordability — particularly across countries — it is far from comprehensive. Other affordability metrics still spell out tough times ahead for homeowners. Rental affordability, mortgage serviceability and the deposit hurdle are also vital considerations. But Domain says that as of June 2018, data shows the median income household in Sydney would require 59.8 per cent of weekly income to service an owner-occupied mortgage (assuming a 5.2 per cent variable rate on a loan-to-value ratio of 80 per cent). This is down from 64.4 per cent at the peak of the latest cycle
Another angle is credit scoring, as Banking Day called out, as the remaining three Big Four banks are reportedly getting ready to join NAB as participants in the new Comprehensive Credit Reporting regime. This means a massive database will share their customers’ full credit history with each other for the first time from the end of this month, at which point comprehensive credit reporting will be a foregone conclusion with the remaining major banks. The new data-sharing regime will allow lenders to better verify loan applications and assess credit risk by accessing the full repayment history of a potential customer, including their total debts. The major lenders have pushed ahead with the changes following pressure from the prudential regulator, The Australian reported, noting that ANZ said it had been testing positive data reporting since the end of June, although the data was not shared with the public at this stage. The big banks’ embrace of the new regime would put pressure on others to sign up, since only lenders who supplied comprehensive reporting to the credit bureaus would have access to the data, Australian Retail Credit Association chairman Mike Laing told The Australian. “If they don’t join then the people who intend to borrow money but not pay it back will quickly find out which ones are not in the system and they’ll go to the lenders who don’t have access to verifiable data. So it’s risky for a lender not to take part once most of the data is in there”.
And yet another angle. Between 2008 and 2012, the number of self-managed super funds grew by 27 per cent to nearly half a million. That was more than 40 per cent of the growth of the whole superannuation system. The global financial crisis coincided with the Howard government lifting the ban on superannuation funds borrowing money. As a result, self-managed super funds have rushed to take advantage and racked up $32 billion in debt in little more than a decade. The Financial System Inquiry in 2014 recommended that borrowing by superannuation funds be banned. It’s a view shared by Saul Eslake, the former ANZ Bank chief economist, who describes the decision to allow super funds to borrow as “the dumbest tax policy of the last two decades.” “The last thing Australians really needed in the last 20 years is yet another vehicle or incentive for Australians to borrow more money in order to speculate on property prices continuing to rise,” Mr Eslake said.
Overlaying that is the perennial problem of property spruikers trying to persuade people to borrow big to buy, and tip their newly acquired, heavily leveraged, property into a self-managed super fund. Super fund borrowing is known as “limited recourse” — which means if the fund can’t pay off the loan, the bank can’t go after any other assets — just the property in question. Remember this was at the heart of the sub-prime mortgage fiasco 10 years ago, which morphed into the global financial crisis. Whilst not wanting to be alarmist, Saul Eslake is concerned with what he’s seeing now in self-managed super funds with their limited recourse borrowing. “You might have thought that someone would have heard the term ‘limited-recourse borrowing’ and recognised that there were some significant risks associated with it that we could have done without in the Australian context.”
And CoreLogic Reported that the combined capital cities returned a final auction clearance rate of 55.3 per cent last week, a slight improvement on the 55 per cent over the week prior when volumes were lower. There were 1,916 homes taken to auction last week, up on the 1,748 held the previous week. While one year ago, a higher 2,258 auctions were held with a 66.9 per cent success rate.
Melbourne returned a final auction clearance rate of 60 per cent this week; an improvement not only over the week but the highest seen since May, with clearance rates for the city remaining within the mid-high 50 per cent range up until this week. The improved clearance rate was across a higher volume of auctions week-on-week, with 891 auctions held, increasing on the 805 held the week prior when 57 per cent sold.
Sydney’s final auction clearance rate came in at 50.6 per cent last week across 656 auctions, falling on the week prior when a 53.8 per cent clearance rate was returned and auction volumes were a similar 664.
As usual the performance across the smaller auction markets was mixed last week, with clearance rates improving in Adelaide, Brisbane and Canberra, while Perth’s final clearance rate fell.
The Gold Coast region was the busiest non-capital city region last week with 56 homes taken to auction, although only 26.4 per cent sold. Geelong was the best performing in terms of clearance rate with 88 per cent of the 34 auctions successful.
And this week, CoreLogic is tracking 1,882 capital city auctions this week. If we compare activity to the same week last year volumes are down 25 per cent on the 2,510 auctions held one year ago.
And finally, APRA released their quarterly property exposure data to June this past week. APRA release their quarterly property exposure lending stats for ADI’s today. There are some interesting data points, and some concerning trends and loosening of standards recently. I will focus on the new loan flows here. First the rise in loans outside serviceability continues to rise, now 6% of major banks are in this category a record, reflecting first tightening of lending standards, but second also their willingness to break their own rules! This should be ringing alarms bells. APRA?
Foreign Banks are writing the greater share (relative percentage) of 80-90% LVR loans. Other lenders tracking lower.
Foreign Banks are lending more 90+ LVR loans in relative percentage terms.
New investor loans are moving a little higher for Credit Unions and Major Banks, suggesting a growth in volumes.
The share of interest only loans dropped below 20% but is now rising a little, as lenders seek to grow their books.
All warning signs, especially when as APRA reports ADIs’ residential term loans to households were $1.62 trillion as at 30 June 2018. This is an increase of $86.6 billion (5.6 per cent) on 30 June 2017. Of these: owner-occupied loans were $1,076.4 billion (66.4 per cent), an increase of $76.7 billion (7.7 per cent) from 30 June 2017; and investor loans were $544.0 billion (33.6 per cent), an increase of $9.9 billion (1.9 per cent) from 30 June 2017. Debt is sky high, the grow rate must be slowed substantially – there are rumours of more tightening to come, we will see.
Looking at the local markets, the ASX 100 was down at the end of the week, ended up at 5,065.90, up 29.8 on the day, and it continues to underperform compared with the US markets. In the banking sector, NAB ended the week at 27.35, after they announced they would not follow the lead of Westpac, CBA and ANZ for now by not lifting their variable mortgage rates, for now. NAB closed up 0.18% on the day. ANZ, who it was announced with be subject to civil proceedings from ASIC for an alleged continuous disclosure breach in relation to a $2.5 billion institutional share placement undertaken by the ANZ in 2015. Their shares rose 0.32% on Friday to 28.15. CBA who took some further knocks this week thanks to further evidence of poor practice in CommInsure in the Banking Royal Commission, among others in the industry. They ended the week at 71.50, and up 0.45% today. And Westpac ended the week at 27.76 up 0.69% on Friday. Despite the relatively benign employment figures out this week, still at 5.3%, the Aussie ended the week at 71.54 and down 0.57% on Friday. The downward trajectory is clearly in play. This risks importing inflation into the local economy.
Looking across to the USA, many investors may be inclined to dismiss yet another headline on global trade and focus on the more granular aspect of the markets. But make no mistake, the markets were gyrating with the twists in the saga between the U.S. and its trading partners. The latest salvo came Friday, when Bloomberg reported that Trump instructed aides the day before to proceed with tariffs on about $200 billion more in Chinese products, but that the announcement has been delayed as the administration considers revisions based on concerns raised in public comments.
Earlier in the week, China had welcomed an invitation by the United States to hold a new round of trade talks. The Trump administration had invited Chinese officials to restart trade talks, the White House’s top economic adviser said on Wednesday. In addition to those tariffs, Trump has said he’s ready to add an additional $267 billion in tariffs “on short notice if I want.”
Earlier in the week, Beijing indicated it will ask the World Trade Organization for permission to impose sanctions on the U.S. as part of a dispute over U.S. dumping duties that China started in 2013.
And there’s still the revamp of NAFTA to consider. The U.S. and Canada have been in talks to bring Canada into a new agreement between the U.S. and Mexico, but there have been on announcements to far. Talks are expected to continue through Monday.
Beyond the US manufacturing sector – for example Boeing is still pretty strong, at 359.80, while Caterpillar ended down 0.44% to 144.90; the potential spill over into the consumer sector impacted a range of stocks, with Whirlpool down 1.68% to 123.21, Walmart down 0.56% to 94.59 and Mattel was up 1.49% to 16.35. Among the financials, Morgan Stanley was at 48.19, a little higher on the day, but still well down on March highs. The S&P 500 ended up 0.03% to 2904.98, as did the Dow Jones Industrial Average to 26,154, while the NASDAQ was down just a little to 8,010.
Apple got the type of promotional attention some companies can only dream of when the eyes of tech lovers and investors alike were glued to its keynote event for details on its new products, especially phones. Apple announced Wednesday its new iPhone product line. Shares of Apple rose the day before the event in anticipation of the kind of surprise announcement for which former CEO Steve Jobs was famous. The stock sold off as details about the new iPhones arrived and shares ended the day lower. But shares bounced back on Thursday, leading the overall tech sector higher, despite negative analyst commentary about the price of the iPhone XR. Apple ended the week down 1.14% to 223.84.
Bucking the recent trend that’s made investors nervous about price pressure, the latest data showed inflation cooling. First, figures showed wholesale prices fell unexpectedly. Producer price index decreased 0.1% last month. In the 12 months through August, the PPI rose 2.8%. Economists had forecast the PPI rising 0.2% last month and increasing 3.2% from a year ago. The core PPI decreased by 0.1% from a month earlier and rose 2.3% in the 12 months through August. Analysts had predicted core PPI to increase 0.2% month on month and 2.7% on an annualized basis.
Next, retail inflation rose less than anticipated. The consumer price index advanced 0.2%, missing expectations for a gain of 0.3%. In the 12 months through July, the CPI increased 2.7%, below forecasts for a reading of 2.8% and down from 2.9% in July. The core CPI increased by 0.1% from a month earlier, below forecasts for a gain of 0.2%. The annual increase in the so-called core CPI was 2.2%. Economists were looking for it to hold steady at July’s 2.4% advance. But despite these softer inflation numbers, traders ended the week still predicting a more-than-80% chance of the Federal Reserve hiking rates at its December meeting on top of the expected boost this month.
Bond yields rose sharply this week, owing to confidence that the Federal Reserve will lift rates for a total four times this year. The rise was particularly strong Friday, when the United States 10-Year yield topped 3% briefly. A big reason for that was Friday’s retail sales numbers.
The August retail sales numbers were disappointing at first blush, rising 0.1%, compared with expectations for 0.4%. But July’s gain was revised up to 0.7% from 0.5%. That revision gave market watchers some more confidence that the U.S. could see GDP growth of 4% in the third quarter, which would all but guarantee another rise in rates in December.
Gold ended the week lower at 1,198, down 0.82%, with preference for the US Dollar as a safe haven. And Copper fell 2.61%, well down on the start of the year, with demand slowing. Oil prices were higher to 69.00, up 0.60% on Friday, reflecting concerns about supply thanks to Hurricane Florence, and trade concerns. Of course, with the lower Aussie, this means fuel prices will rise further ahead.
Finally, Bitcoin is still making lower highs, even though the cryptocurrency has seen slightly higher lows. The key is going to be when bitcoin trades back above $7,000. There is a trend line connecting all the recent highs going back to early 2018. If BTC can bust above that level, it will likely take out the high at $7,350 and make a higher high. Once that happens, institutions may start buying heavily and upside could be back above $10,000 within months. That said, it ended the week down 1.15% to 6,488.
According to Bloomberg, Morgan Stanley plans to offer trading in complex derivatives tied to the largest cryptocurrency, according to a person familiar with the matter, joining other Wall Street firms in creating ways for clients to play the digital currency market. The U.S. bank will deal in contracts that give investors synthetic exposure to the performance of Bitcoin, said the person, who asked not to be identified because the information is private. Investors will be able to go long or short using the so-called price return swaps, and Morgan Stanley will charge a spread for each transaction, the person said. Citigroup is developing a new mechanism for trading cryptocurrencies known as digital asset receipts, a person with knowledge of the plans said earlier this month. Goldman Sachs is exploring derivatives on Bitcoin called non-deliverable forwards, and is considering a plan to offer custody for crypto funds.
Finally, today a couple of quick reminders, first the 60 Minutes programme tomorrow evening and our live stream event on Tuesday at 20:00 Sydney, where you can discuss with me the latest on the outlook for home prices, as well as all our other analysis. You can bookmark the event by using this link. I look forward to your questions in the live chat.
If you value the content we produce please do consider joining our Patreon programme, where you can support our ability to continue to make great content.
Welcome to the Property Imperative weekly to 8th September 2018, our digest of the latest finance and property news with a distinctively Australian flavour.
And by the way, if you value the content we produce please do consider joining our Patreon programme, where you can support our ability to continue to make great content.
Watch the video, listen to the podcast, or read the transcript.
The big news this week was that after Westpac blinked last week, ANZ then CBA both lifted their standard variable mortgage rates for existing borrowers by 16 and 15 basis points (or 0.16% and 0.15% respectively). This was exactly as I had predicted. They both blamed the rising interbank funding rates, claimed that mortgage rates were still lower than three years ago, and that though it was regrettable, the impact would be minimal.
Let’s be clear, existing borrowers are being caned, and whilst some may be able to shop around for a new loan at those attractive teaser rates, many cannot so they are being milked. And there are more rises to come in my opinion.
To put this in perspective, on a typical mortgage this represents an extra $35 a month, but if you are sitting on a big Sydney or Melbourne mortgage it could be much more. We discussed the shift in rates on our posts this week, including “More Bank’s Follow Suit”, and our discussions with people on the industry front line, including Sally Tindal from RateCity and Mandeep Sodhi from HashChing.
NAB of course has not followed the herd so far, so it will be interesting to see whether they will. But the main point to make is this is just another burden on borrowing households at a time when according to our surveys, household finances remain under pressure.
On Tuesday, leaving the cash rate unchanged, the RBA said” One continuing source of uncertainty is the outlook for household consumption. Household income has been growing slowly and debt levels are high”; and last week “the main risks to financial stability will most likely continue to relate to credit quality. Notably, banks’ large exposure to a potential deterioration in housing loan performance is expected to remain a key issue”.
Our analysis of household finance confirms this and the latest responsible lending determinations, where Westpac agreed to pay a very small $35m civil penalty also highlight the issues. Their mortgage hikes will more than cover the penalty.
So no surprise to see mortgage stress continuing to rise. Across Australia, more than 996,000 households are estimated to be now in mortgage stress (last month 990,000). This equates to 30.5% of owner occupied borrowing households. In addition, more than 23,000 of these are in severe stress. We estimate that more than 59,000 households risk 30-day default in the next 12 months. We continue to see the impact of flat wages growth, rising living costs and higher real mortgage rates. Bank losses are likely to rise a little ahead. You can watch our show “August 2018 Mortgage Stress Update” for more details. We also did a number of radio interviews on this.
And have no doubt the credit crunch continues to intensify. The latest ABS lending data for July showed a fall in investor mortgages, and a slowing of first time buyers and owner occupied lending. In fact, apart from a small rise in construction finance, all indicators were down. We discussed this in our post “More Negative Lending Indicators”.
Pile on the reduction of borrowing power of households by as much as 40%, the number of refinanced applications being rejected, still running at 40%, so creating mortgage prisoners now that the banks are finally obeying the lending law, plus property investors now seeing capital being eroded, all this combined means lending will be compressed, and this in turn will drive home prices lower. The latest data shows both home prices and auction clearances are still failing.
One other observation worth making. Though hardly reported, the ABS released their June 2018 data relating the securitised loans in Australia “Assets and Liabilities of Australian Securitisers“. It showed that in the past year residential mortgages securitised rose by 8.9% to $108.8 billion. Overall securitised assets rose by 8.2%, which shows mortgage assets grew stronger than system.
This reflects what we have seen in the market with non-bank and some bank lenders using this funding channel. The rise of non-bank securitisation is a significant element in the structure of the market. As major lenders throttle back their lending standards, higher risk loans are moving into the non-bank and securitised sectors. Of course a decade ago it was the securitised loans which took lenders down in the US and Europe.
The growth we are seeing here is in our view concerning, bearing in mind the more limited regulatory oversight. Plus. on the liabilities side of the balance sheet, around 90% of the securities are held by Australian investors, a record.
This includes a range of sophisticated investors, including super funds, wealth managers, banks, and high-net worth individuals. But the point to make is that if home price falls continue, the risks in the securitised pools will grow, and this risk is fed back to the investor pools.
This is yet another risk-laden feedback loop linked to the housing sector, and one which is not fully disclosed nor widely understood. The fact that the securitised pools are rated by the agencies does not fill me with great confidence either!
Even the broader economic data, which showed that Australian economy grew 0.9 per cent in seasonally adjusted chain volume terms in the June quarter 2018, showed that new dwelling investment continued to prop up the numbers, along with government and domestic consumption.
But the two key, and concerning trends are a significant fall in the households’ savings ratio (as they dip into them to support their spending), and the slower GDP per capita growth, which shows that much of the GDP momentum is simply population related. This is based in trend data.
Plus, real national disposable income per capita fell by 0.2% over the quarter though it was up 2.1% over the year. Worse, the real average compensation per employee fell another 0.4% in the year to June 2018 to be 4.2% lower since March 2012. And average remuneration per employee rose by only 1.7% in the year to June, so remains underwater after adjusting for inflation (2.1%). Households remain under the gun. Economist John Adams and I discussed this in our show “A Disastrous Set of Results”.
Of course GDP is a really poor set of measures by which to assess the economy in any case….
One emerging question is the real risks in the banks’ mortgage portfolios as home values fall, and poor lending practices are revealed.
UBS said this week in their latest Australian Banking Sector Update, which involved an anonymous survey of 1,008 consumers, there was a “sharp fall” in the number of “misstatements” reported in mortgage applications over the fourth quarter of 2018 (4Q18). The survey revealed that 76 per cent of respondents reported that the mortgage applications were “completely factual and accurate”, up from 65 per cent throughout the first three quarters of 2018. According to UBS, the improvement in lending standards was largely driven by the scrutiny placed on the industry by the Royal Commission into Misconduct in the Banking, Superannuation and Financial Services Industry, and not off the back of regulatory intervention.
Despite the improvement, UBS claimed that it’s concerned about the 10 per cent of respondents that reported that their broker-originated applications were “partially factual and accurate”, which it considers a “low benchmark”. Moreover, UBS stated that it continues to find that a “substantial number of applicant’s state that their mortgage consultant suggested that they misrepresent on their mortgage applications”. According to the figures, of those who misstated their broker-originated loan applications, 40 per cent said that their broker suggested that they misrepresent their application, which UBS claimed implies that 15 per cent of all mortgages secured via the broker channel were “factually inaccurate following the suggestion of their broker”.
“This is concerning given the heightened scrutiny on the industry, in particular following findings of broker misconduct and broker fraud in the royal commission,” UBS added.
There was an important video out this week, courtesy of the CEC in which Denise Brailey of the Banking and Finance Consumers Support Association (BFCSA), a real consumers champion, discussed mortgage fraud in the system. To cut to the chase, she says that many lenders deliberately built systems and processes to trick customers into loans they should never had got. The central issue is the way the Loan Application Form (LAF) was used. But she also touches on the cultural issues and fake statistics endemic in the system. You can watch the whole story. It is frankly disturbing.
Add to the substantial “liar loans” issue, the fact home price values continue to fall, and funding costs are rising, and we conclude the risks to the banking system are significant. Yet the regulators and bank auditors are not in our view doing their job. As more of this is exposed, expect bank share prices to slide further.
The ASX 200 was down 0.27% on Friday, to 6,144, having reacted to the latest GDP numbers and the bank mortgage repricing. CBA ended the week at 70.5 up 0.53% but was down on recent numbers. Westpac ended at 27.80 down 0.14% and only slightly above the low of 27.30. ANZ was also lower at 28.40, down 0.46%. Expect more downside, as the Royal Commission reports, and more mortgage related issues emerge.
The Aussie fell against the US Dollar, down 1.29% to 71.05 A New Low. While AUD/USD’s descent was not as potent as last week, the pair breached under the December and May 2016 lows below 71.452. Technically, its now cleared to descend to the January 2016 lows at 68.274.
Indeed, not only broken through 71.452, but it also fell under a descending range of support which helped control its decline since May. However, the pair stopped just short of the 61.80% Fibonacci extension at 70.888 which might as well stand as immediate support going forward.
The push through range support also marked the pair’s single largest decline in a day since August 23rd which was over two weeks ago. If the dominant downtrend in AUD/USD once again resumes, a push under 70.888 exposes the 78.6% Fibonacci extension at 70.092.
Meanwhile, near-term resistance is a combination of the December/May 2016 lows and the descending range. Pushing above 71.60 then opens the door to testing the 38.2% extension at 72.007 followed by the 23.6% level at 72.699. With that in mind, the descent through key support levels prolongs the bearish AUD/USD technical outlook.
Moody’s said this week The U.S. economy and financial markets have been pulling away from the rest of the world. Of special importance is the lagging performance of emerging market economies, which, not too long ago, had been the primary driver of world economic growth. The combination of higher U.S. interest rates and the relatively stronger performance of the U.S. economy has triggered a notable and potentially destabilizing appreciation of the dollar versus a host of emerging market currencies.
Excluding the collapse of Venezuela’s currency, other noteworthy appreciations by the dollar since yearend 2008 include the dollar’s 102% surge against Argentina’s peso, the 74% advance in terms of Turkish lira, the 25% climb versus Brazil’s real, the 24% ascent against South Africa’s rand, the 15% increase versus India’s rupee, the 10% climb in terms of Indonesia’s rupiah, and the 11% increase vis-à-vis Pakistan’s rupee.
Emerging market countries having especially large current account deficits relative to GDP are vulnerable to dollar exchange rate appreciation. The funding of large current account deficits requires large amounts of foreign-currency debt that is often denominated in U.S. dollars. As the dollar appreciates vis-à-vis emerging market currencies, it becomes costlier to service dollar-denominated debt in terms of emerging market currencies.
So to the US markets, where the Dow Jones Industrial Average fell 0.31%, to 25,917 while the S&P 500 ended at 2,871, down 0.22%. On the corporate news front, Tesla stock dropped 6.3% after Chief Accounting Officer Dave Morton resigned as the “the level of public attention placed on the company,” prompted him to rethink his future. It ended at 263.24
Gripped by fear the United States and China are heading further down the path toward a full-blown trade war, investors reined in their bets on riskier assets like stocks, pressuring the broader averages. With the administration already expected to impose tariffs on $200 billion worth of goods from China, Trump upped the ante on trade, threatening levies on another $267 billion of goods. The levies on the list of goods could reportedly cover a wide range of products from popular tech companies, including Apple, according to Bloomberg. Apple later confirmed in a letter that the tariffs would affect the Apple Watch, AirPods and Apple Pencil.
“It is difficult to see how tariffs that hurt U.S. companies and U.S. consumers will advance the Government’s objectives with respect to China’s technology policies,” Apple said in the letter.
Apple Inc. fell 0.81% to 221.30 fell on the news, exerting further pressure on the beaten-up tech sector. The NASDAQ slide further, down 0.25% to 7.903 and twitter continued its fall, down 1.04% to 30.49 as a number of the big social media tech stocks were hit after testaments to congress on election interference and moderating content, including charges of censorship.
There were also no new developments as Canada negotiated with the U.S. about a revamp of NAFTA.
The U.S. employment report for August augured strong economic growth. But markets were spooked by an acceleration in wage inflation, which boosted expectations for the Federal Reserve to hike rates twice more this year. Beyond the creation of 201,000 jobs in August and a jobless rate holding near 18-year lows, at 3.9% the focus was on the 2.9% increase in wage inflation, its fastest since April 2009. Although a quarter-point rate hike was already fully priced in for the Sept. 25-26 Fed meeting, odds for an additional increase in December rose to about 76% compared to 70% ahead of the report.
Energy, meanwhile, did little to stem losses in the broader market after ending the day roughly unchanged, as oil prices were pressured by a rising dollar and concerns about oil-demand growth, amid rising trade tensions. On the New York Mercantile Exchange crude futures for October delivery settled at $67.84 a barrel, towards the top the price range. Gold was down 0.21% to 1,202, driven by strength of the US dollar, despite rumours of buying by a number of central banks, including China.
Bitcoin dropped on Friday down 1.31% to 6,420, having plunged from 7385 to 6830, or 7.5%, on Wednesday in reaction to a Business Insider report that Goldman Sachs as decided to drop a year-ago decision to create a crypto-currency trading desk. Apparently Goldman is “uncertain” about the regulatory environment.
Before I go, a couple of reminders, first is that next Sunday 16th September Nine’s 60 Minutes will be running a segment on the outlook for the Property Market. You may recall I was in Sydney a couple of weeks back for a recording. A couple of days ago they came back to get some additional material, as the market is evolving so quickly. It will be interesting to see how they tell the story.
Next we will be launching our new series on the capital markets next week, where we will look at the concepts of the time value of money, bonds and derivatives. Given the size of these markets, and the risks embedded within them, this will be an important series.
And finally, our next live stream Q&A event is scheduled for Tuesday 18th September at 20:00 Sydney, you can set a reminder and also send me questions ahead of time. We will be looking in detail at the property market in the session. I look forward to your questions in the live chat.
If you value the content we produce please do consider joining our Patreon programme, where you can support our ability to continue to make great content.
In their latest release, HIA is essentially calling for an easing of lending practices, suggesting that investors need encouragement to come back into the market.
“A growing list of disincentives are deterring investors from Australia’s housing market,” stated HIA economist, Diwa Hopkins.
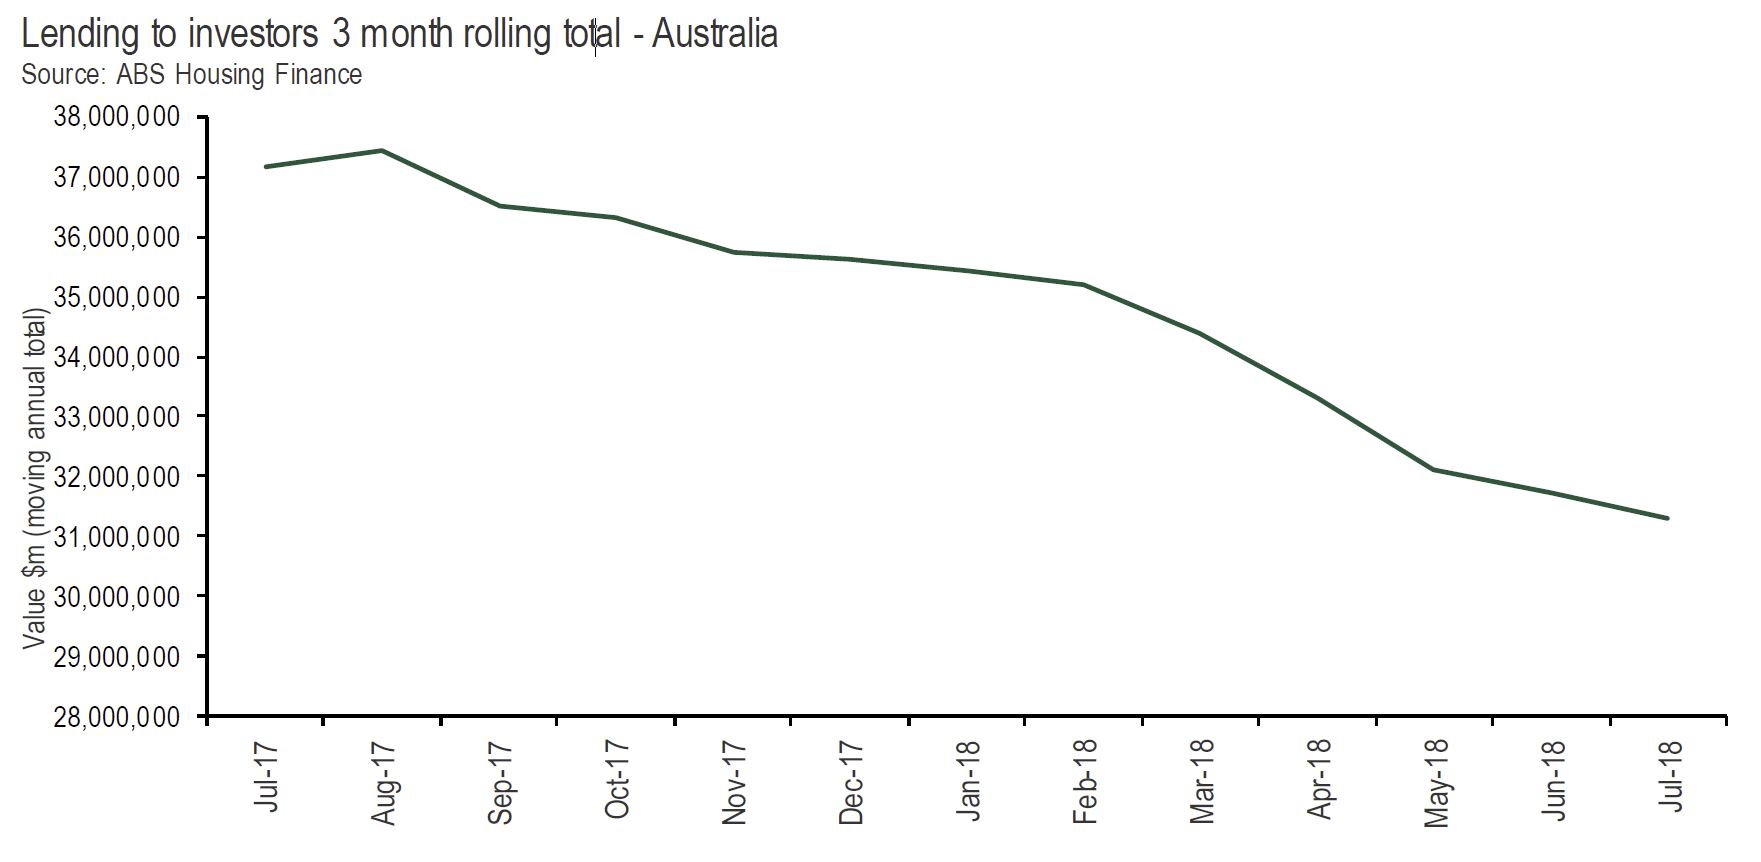
Today the ABS released data on housing finance for the month of July 2018. These figures show the value of lending to investors declined by a further 1.3 per cent in the month. The value of lending in July 2018 is now 15.7 per cent lower than in July 2017.
“Investors played a significant role in the record levels of new home building that occurred in recent years. By the same token their retreat from the market will weigh on activity over the near to medium term,” said Ms Hopkins.
“The exiting of investors from the housing market can be traced back to well-documented APRA interventions at the end of 2014 and then again in early 2017.
“In addition, state and federal governments have acted to deter foreign investors by levying additional taxes and charges on their investments in the domestic market.
“More recently the Banking Royal Commission has seen lenders further tighten their practices beyond APRA’s initial requirements and yesterday two of the other major banks joined Westpac in raising their variable mortgage rates.
“Add to this, a situation of falling dwelling prices in the key Sydney and Melbourne markets as well as the prospect of increased taxes on investment housing through negative gearing restrictions and increased capital gains tax, and the list of deterrents to investors in the housing market is comprehensive.
“Overall, most of these factors are having the effect of limiting credit availability.
“The concern now is APRA’s interventions appear to have run beyond their usefulness,” said Ms. Hopkins.
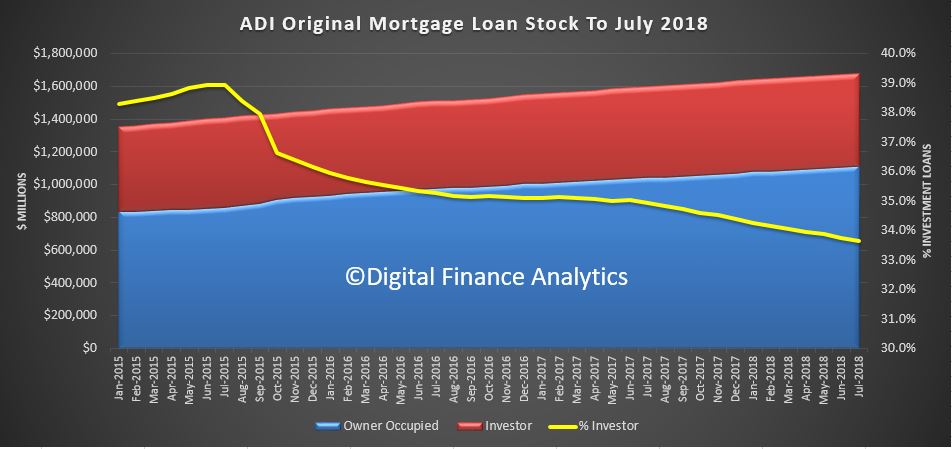
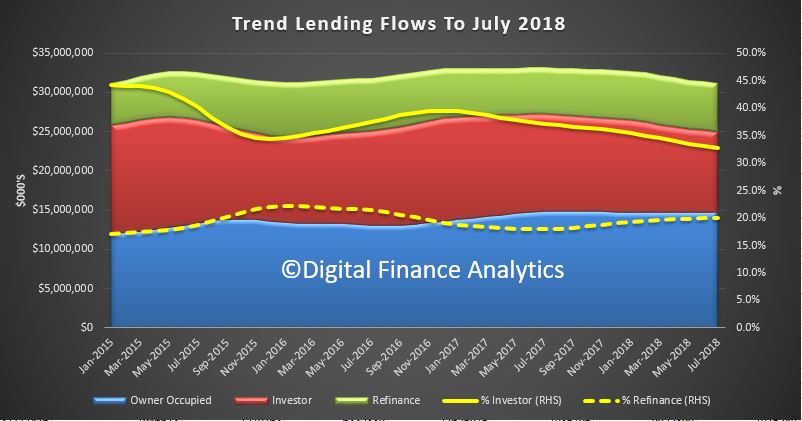
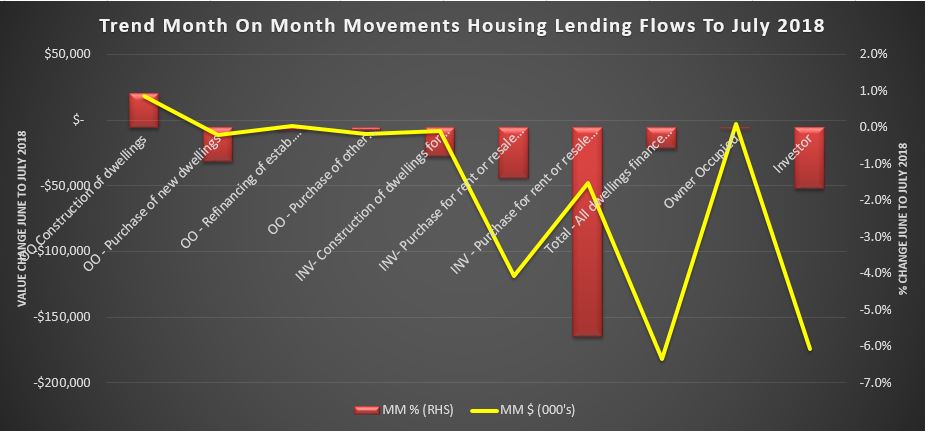
The ABS has released their data to July 2018 for Housing Finance. Investors continue to fee the market, and even first time buyers are getting twitchy, while refinancing transactions props up the numbers a little. All as expected, and this underscore more falls in lending flow, and home prices ahead. The rate of decline is increasing. Loan stock grew 0.26% in the month, but that was in the owner occupied segment. Investor loan stock fell.
The trend estimate for the total value of dwelling finance commitments excluding alterations and additions fell 0.6%. Owner occupied housing commitments was flat, while investment housing commitments fell 1.7%.
As a result the proportion of loan flows for investment property purposes continues to drift lower to 32.7%, the lowest in recent years, while there was no change in owner occupied lending and refinance rose just a little to 20%.
In trend terms, the number of commitments for the purchase of new dwellings fell 1.8%, the number of commitments for the purchase of established dwellings fell 0.2%, while the number of commitments for the construction of dwellings rose 0.2%. In fact that was the only positive indicator!
In trend terms, overall, the number of commitments for owner occupied housing finance fell 0.2% in July 2018.
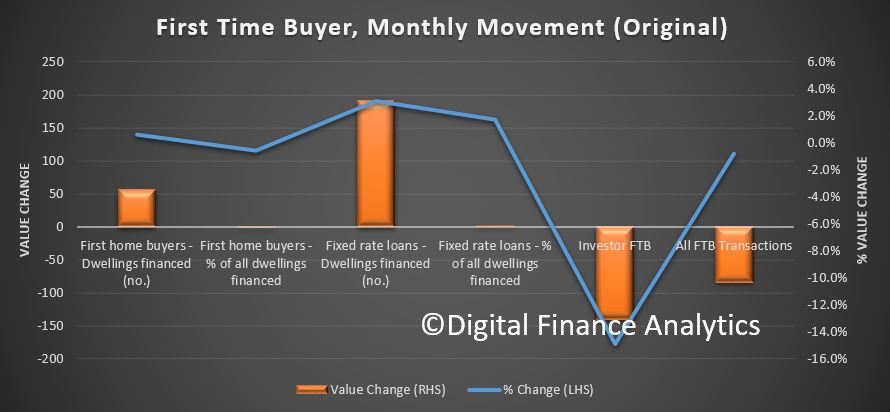
In original terms, the number of first home buyer commitments as a percentage of total owner occupied housing finance commitments fell to 18.0% in July 2018 from 18.1% in June 2018.
The number of FTB loans for owner occupied borrowers rose by around 50. There was a small rise in the number of fixed loans, and the average FTB loan fell by $4,000 perhaps indicating tighter borrowing terms.
The number of FTB investors continues to fall away in line with the broader trends in the investor sector.
All this points to a continued tightening of lending standards and a likley continued decline in loan volumes – which is also a leading indicator of more home price falls ahead.
Welcome to the Property Imperative Weekly to 1st September 2018, our digest of the latest finance and property news with a distinctively Australian flavour. Locally the bad news keeps coming, while US markets remain on the boil.
And by the way, if you value the content we produce please do consider joining our Patreon programme, where you can support our ability to continue to make great content.
Listen to the podcast, read the transcript, or watch the video show.
NineNews published an article this week, claiming that Sydney and Melbourne dwelling values “may soon rise again” because of a decline in dwelling construction, citing a report saying that the rate of construction is expected to slow down, with the number of new homes built set to fall by up to 50,000 each year. So they said, that would mean 20,000 fewer homes built across the country each year than the 195,000 needed to meet future demand.
Indeed, the ABS reported this week that building approvals in July were 5.6 per cent lower than in the same month last year. Total seasonally adjusted dwelling approvals in July fell in New South Wales (-5.2 per cent), Victoria (-4.6 per cent), Queensland (-6.0 per cent), South Australia (-26.5 per cent) and Western Australia (-14.7 per cent). Seasonally adjusted approvals increased in Tasmania by 13.6 per cent. In trend terms, total dwelling approvals in July increased by 4.5 per cent in the Northern Territory and in the Australian Capital Territory (12.2 per cent).
The data shows its high rise apartments which are slowing the fastest (in response to slowing demand from investors) but it is worth noting that the volume of approvals for new detached houses have been tracking around their strongest levels in 15 years. The HIA said that weaker conditions in a number of states have typically been overshadowed by strong activity in Victoria. With Victorian home approvals now showing signs of weakness they expect the national trend – of declining building approvals – will continue throughout 2018.
The HIA also reported on new home sales for July, saying that consistent with the trend for much of 2018, July saw sales fall by 3.1 per cent compared to the previous month. Sales in 2018 thus far are 6.1 per cent lower than in the corresponding time in 2017. The noticeable new trend is that new home sales in Victoria are weakening. Victoria has experienced exceptionally strong conditions, which have been sustained over a number of years, obscuring weaker conditions in a number of other states. With Victorian new home sales now showing signs of weakness we expect the national trend – of declining sales – will continue throughout 2018.
The Sydney market has also been cooling throughout the year particularly in the new growth areas. The high volume of new apartments in metropolitan cities are competing for first home buyers and resulting in a slowdown in new detached home sales. Other regions in New South Wales, such as the Hunter, around the ACT and South and North Coasts, are continuing to see strong growth. They say the market for new home sales across the country is cooling for a number of reasons including a slowdown in inward migration since July 2017, constraints on investor finance imposed by state and federal governments and falling house prices. They expect that it will continue to slow over the next two years due to the adverse factors now starting to take effect the market.
Specifically, they say that finance has become increasingly difficult to access for home purchasers. Restrictions on lending to investors and rising borrowing costs have seen credit growth squeezed. Falling house prices in metropolitan areas have also contributed to banks tightening their lending conditions which have further constrained the availability of finance. An increase in interest rates charged by banks, which had been anticipated, will accelerate the slowdown in sales and ultimately new home building activity.
The latest data from the RBA and APRA confirm the fall in credit, with the monthly RBA credit aggregates for July showing total credit for housing up 0.2% in the month, to $1.77 trillion, with owner occupied credit up 0.5% to $1.18 trillion and investment lending down 0.1% to $593 billion. Investment housing credit fell to 33.4% of the portfolio, and business credit was 32.5%. APRA’s data showed that investor loan balances at Westpac, CBA and ANZ all falling, while NAB grew just a tad. Macquarie, HSBC. Bendigo Bank and Bank of Queensland grew their books, highlighting a shift towards some of the smaller lenders. Suncorp balances fell a little too. You can watch our separate video “Rates Up, Lending Down”, for more on this.
And of course we saw more out of cycle rates hikes from Westpac, who lifted variable rates for owner occupies and investors holding loans with them by 14 basis points – see out video “Westpac Blinks” for more on this – where we discuss the margin compression the experienced, thanks to rising international funding rates (see the BBSW) and the switch from interest only to principal and interest loans. Then on Friday, Suncorp and Adelaide Bank, both of whom had already lifted a couple of months back, lifted again. As I said yesterday, what is happening here is that funding costs are indeed rising. But the real story is that they are also running deep discounted rates to attract new borrowers, (especially low risk, low LVR loans) and are funding these by repricing the back book. This is partly a story of mortgage prisoners, and partly a desperate quest for any mortgage book growth they are capture. Without it, bank profits are cactus. Once again customer loyalty is being penalised, not rewarded. Those who can shop around may save, but those who cannot (thanks to tighter lending standards, or time, or both) will be forced to pay more
Damien Boey at Credit Suisse, writing before Suncorp And Adelaide Bank moved again said Westpac was the latest of the banks to hike variable rates across new and existing customers, following similar moves from BOQ, BEN, MQG and SUN over the past few months. Not only are out of cycle rate hikes broadening out across the system – we think that they will continue to broaden out across the majors, and become a recurring theme. This is because:
Money market rates are a significant driver of the marginal cost of funds. Arguably, the banks that have hiked out of cycle to date have been more exposed to money markets than the banks that have not. Therefore, money market stress has had a bigger impact of their profitability, putting more pressure on them to hike rates. However, if there are question marks about why certain systemically important banks are facing liquidity or credit problems, then funding costs must inevitably rise for everyone, even if we are only talking about small, but fat tail risks. Also, RBA research suggests that as rates approach the zero bound, the relative cost of no/low fixed rate deposits increases to the point that perversely, margin pressures can emerge.
Interbank spreads should be negligible unless … If a central bank targets a cash rate like the RBA does, it must be willing to provide any and all reserves that the banking system needs. In other words, it must be the lender of last resort. And if it is possible to obtain reserves from the RBA in almost any situation, there should be no need to borrow them from other banks. In turn, the spread of bank bill swap rates (BBSW) to overnight indexed swap rates (OIS, the risk free rate), should be negligible. Unless of course, there is counterparty credit risk over and above liquidity risk. Interestingly, the RBA has gone out of its way recently to remind the market that it is indeed the lender of last resort. But the BBSW-OIS spread remains elevated at European crisis highs, around 45bps.
Wide interbank spreads are hard to explain using conventional factors. For as long as there is a pricing premium mystery, there is no visible end to the cycle of out of cycle rate hikes. Interestingly, in its August Statement on Monetary Policy the RBA provided some alternative explanations for wide interbank spreads, after witnessing the USD liquidity narrative break down in recent months. But even Bank officials do not find these explanations convincing. Therefore, the mystery remains unresolved.
The marginal funding cost drives the change in the average funding cost. Therefore, we do not need to forecast further increases in the BBSW-OIS spread to have conviction that banks will continue hiking rates out of cycle. We only need to know that the BBSW-OIS spread will persist at wide levels. Again, for as long as there is uncertainty about why the spread is so wide to begin with, it is hard to argue with conviction that spreads ought to narrow and normalize.
Even after some banks have hiked rates out of cycle, we still think that in aggregate there are more than 50bps of variable rate mortgage hikes in the pipeline based on already known developments in the money market. But the RBA only has 1.5% worth of rate cut ammunition left in its bag of tricks.
This means that the RBA has lost some autonomy over the monetary transmission mechanism, because effective borrowing rates can rise independently of the cash rate. In particular, Australian-US yield differentials are likely to further invert, undermining the carry trade appeal of the AUD/USD. The Fed still seems quite determined to hike rates. But the RBA is unlikely to be matching the Fed’s hawkishness given the slowdown in train, and given what the banks are doing to rates and credit supply.
So we are in for a period of more out of cycle rate rises, as well as tighter lending standards. No surprise, then that refinance rejections are rocketing, as we reported this week, and mortgage prisoners are getting locked in. The ABC story even got picked up by ZeroHedge in the US.
So back to that NineNews report, they missed completely the real reason why home prices are falling, it’s all about credit availability. Lending standards are tighter now – borrowing power is reduced, and so new loans are only available on tighter terms. If you want to understand the link between credit and home prices, which is still not widely understood, I recommend you watch my recent conversation with Steve Keen, who explains the mechanisms involved, and the policy failures behind them. See “Are Icebergs Fluffy? … A Conversation with Steve Keen”. This show has already become one of the most popular in the site, and it is really worth a watch.
The upshot though is home prices are likely to continue to fall. CoreLogic’s dwelling price index showed another fall in August, recording a 0.38% decrease in values at the 5-city level. This is the 11th consecutive monthly decline in home values, down a cumulative 3.4% over that period at the 5-city level: Quarterly values also fell another 1.3% In the year to August, with home values down by 3.09% at the 5-city level, driven by Sydney (-5.64%). Significantly, Perth’s housing bust continues to roll on, with dwelling values now down 13% since peaking in June 2014 after falling another 0.6% in August: the cumulative loss in values at 13% is greater than the 11.5% peak-to-trough falls experienced between 2009-09, and the duration of the downturn has hit 50 months – more than twice as long as prior downturns. Plus, rents there have similarly fallen, with median asking rents down 29% for both houses and units since June 2013.
My theory is, where Perth has gone, other centres are likely to follow as the great property reset rolls on. Melbourne and Victoria is deteriorating significantly, and remember there net rental yields are some of the lowest across the country. No, prices are not likely to recover anytime soon.
And if you want further evidence, auction clearance rates remain in the doldrums. It is interesting to see now the main stream media is beginning to talk about this, and I have been busy this week with interviews on Radio Melbourne, 2GB and elsewhere. Remember this is only the end of the beginning. I continue to believe 2019 will be a really bad year, what with more rate hikes, interest only loan switches, and decaying sentiment. As one industry insider told me this week, “some of my property investor clients have decided to try and sell before the falls bite”. It may be too late.
And to add to the mix, ABC’s Michael Janda wrote an excellent piece this week on the advantage some large banks have with regard to how APRA assesses their capital base. The big four banks between them hold around 80 per cent of all Australian home loans. There are many factors that have led to this extreme market dominance: economies of scale, better credit ratings and an implicit Federal Government guarantee — all of which are linked. But the major banks — plus Macquarie and, recently, ING — also enjoy a regulatory benefit that is little known outside the financial sector, but provides a substantial competitive advantage. “The average capital risk weights of the standard banks is around 39 per cent, the major banks average around 25 per cent, and the actual cost [difference] of that equates to around 15 basis points in margins, so it’s not insignificant at all,” the chief executive of second-tier lender ME Bank, Jamie McPhee, told The Business. Those 15 basis points, or 0.15 percentage points, either have to be added onto the interest rate of mortgages that ME Bank and other smaller lenders offer or they take a hit to their profit margins.
For regional banks on the “standardised” system, the safest high-deposit, fully documented housing loans are considered just 35 per cent at risk, meaning they only have to hold $35,000 in capital on $1 million home loan. However, the major banks, plus Macquarie and ING, are allowed to set their own risk weights, using internal financial modelling under the internal ratings-based (IRB) approach. Until the Financial System Inquiry (FSI) there was no floor on how low these could be — a couple of the major banks were averaging less than 15 per cent on mortgages, meaning they held less than $15,000 in capital to protect against losses on $1 million home loan. Smaller banks have ‘disadvantage baked in’. However, on recommendations from that inquiry, the bank regulator APRA introduced a floor of 25 per cent on the average mortgage risk weight for these banks. That still leaves a significant difference between the amount of capital the big banks hold and what the smaller banks have to put aside.
APRA continues to argue that these more sophisticated banks deserve benefit from their investment in more advanced management systems, and yet APRAs recent reviews suggest significant issues. Here is a recent discussion between Senator Whish-Wilson and APRA Chair Wayne Byers discussing in a Senate committee hearing in May the outcomes from their targeted reviews of major bank lending practices in 2017, but only released publicly through the royal commission process earlier this year.
This casts doubt on whether the big four actually live up to the theory of having better risk assessment and management than the smaller banks. Is APRA still captured we ask, and should the playing field be levelled. We continue to think so.
So now to the markets. Locally, Bendigo and Adelaide Bank fell 0.26% on Friday to 11.59, Suncorp rose 0.06% to 15.49, Westpac fell 0.38% to 28.54, well down from a year ago, despite the mortgage rate hike, and CBA fell 1.26% to 71.24. More are getting negative on the banks, given recent events. The ASX 200 fell 0.51% to 6,319, just off its highs, as the financial sector fell away. The Aussie continues to fall against the US dollar, down a significant 0.96% to 71.93, and we continue to expect more weakness ahead.
Sentiment is rather different in the US markets, with the 10-year rate still elevated, and the gap to the 3 month Libor very narrow, as we discussed before a potential harbinger of a recession later. But the US stock markets remain in positive territory. The Dow Jones Industrial Average fell 0.09% to 25,964, still below its peak in February. The S&P 500 passed a new record in the week, and ended on Friday at 2,901. The VIX was down again, falling 4.95% to 12.87, indicating the market is risk off at the moment. The US Dollar Index Futures was up 0.43% to 95.05.
That said, the burst of optimism about trade in the market during the week, didn’t last until the closing bell on Friday. The U.S. announced a bilateral deal with Mexico on Monday. But tension built throughout the week as the U.S. announced there was a Friday deadline to bring Canada into a newly-revamped NAFTA. The U.S. and Canada missed that deadline, but announced that talks would resume next Wednesday, leaving the market facing more wait-and-see trading days. There was also drama during Friday’s discussions after the Toronto Star reported that Trump told Bloomberg off the record he had no plans to give any concessions at all to Canada. The president appeared to later confirm that stance in a tweet, saying Canada now knows where he stands.
Trade worries spread beyond North America, though. Trump told Bloomberg he was prepared to withdraw from the WTO if necessary. And he plans to move ahead with tariffs on $200 billion in Chinese imports as soon as a public-comment period concludes next week. China’s foreign ministry said Friday that the U.S. putting pressure on Beijing would not work.
The Yuan rose a little against the US Dollar, but remains way down on a year ago.
Meantime retail earnings dominated the calendar this week, leading to strong stock movements in the low-volume environment. The S&P Retail index ended up slightly for the week.
Among big movers, Abercrombie & Fitch stock plummeted on second-quarter revenue and same-store sales missed estimates. Best Buy stock tumbled despite better-than-expected second quarter revenue and earnings as online sales slowed and the company warned that it is “expecting a non-GAAP operating income rate decline in the third quarter.” And Tiffany & Co spiked on second-quarter results and strong outlook, but then tumbled in later sessions.
In tech, Tesla shares started the week with a quick drop and finished it lower as it scrapped plans to go private. CEO Elon Musk wrote in a blog late last week that he would not move forward with a plan to take the company private, noting that after speaking with retail and institutional shareholders that “the sentiment, in a nutshell, was ‘please don’t do this.’”
Musk had surprised the market out of the blue, tweeting he was thinking of taking the company private at $420 per share and had funding secured. The SEC was interested in whether the tweet was designed in a way to punish short sellers, according to reports.
The NASDAQ rose 0.26% to 8,109.5 in record territory driven by the booming sector.
Data out this week illustrated two contrasting segments of the U.S. economy, one stronger and one weaker. Economic indicators on the consumer side remained very strong. The Conference Board’s index of consumer confidence increased to 133.4 this month, compared to a reading of 126.7 forecast by economists. That was its highest level since October 2000. The University of Michigan’s August consumer confidence index was revised up to 96.2 from its preliminary measure of 95.3. And consumer spending, which accounts for more than two-thirds of U.S. economic activity, rose 0.4% last month, matching June’s reading and analyst forecasts.
But the National Association of Realtors said its pending home sales index, which measures signed contracts for homes where transactions have not yet closed, fell 0.7% to a reading of 106.2 after rising by a revised 1.0% in the previous month. Economists had forecast pending home sales rising 0.3% last month. So more questions on the housing sector ahead.
Oil closed out the month higher as traders balanced expectations of crude supply losses with the potential of trade wars denting global demand. China, the world’s largest commodity importer, has seen economic growth dwindle since the trade war with the U.S. kicked off, and a further escalation could dent growth, forcing Beijing to rein in crude imports. Oil prices ended the month nearly 2% higher on bets on renewed global supply shortage as U.S. sanctions on Iran’s crude exports are expected to reduce crude from market, underpinning higher crude prices. Both WTI and Brent crude are expected gain on a potential slump in Iranian exports, although gains in WTI prices will be limited as the refinery maintenance season is set to get underway. Oil prices were helped earlier in the week by an EIA report showing crude oil stockpiles fell much more than expected.
Gold moved a little higher this week, ending up 0.16% on Friday to 1,206, Bitcoin lifted 1.23% to 7,029
So, we can see a significant divergence between the local market here, dragged down by negative sentiment on banks and housing (and the increasing realisation of more issues ahead) and the US where stocks are at the highs despite the building risks from higher corporate debt and the yield curve inversion.
The U.S. housing market has garnered attention recently but for the wrong reason amid numerous signs of some weakening. Parts of the housing market have likely peaked while others haven’t, including new-home sales and construction, which pack the biggest GDP and employment punch.
Before assessing where housing is headed, it’s important to identify the possible culprits in the recent weakness in sales and construction. Common theories being tossed around blame the tax legislation that reduced the incentive to be a homeowner by increasing the standard deduction, lowering the deduction for a new mortgage, and capping the deductible amount of state and local taxes (which include property taxes) at $10,000 per year. More time is needed to assess the law’s impact on housing, since evidence is lacking. Sales of higher-priced homes, which would be most vulnerable, have been climbing. The tax legislation’s drag on housing will likely play out by reducing home sales and pushing some households to rent instead of buy, potentially putting upward pressure on rents.
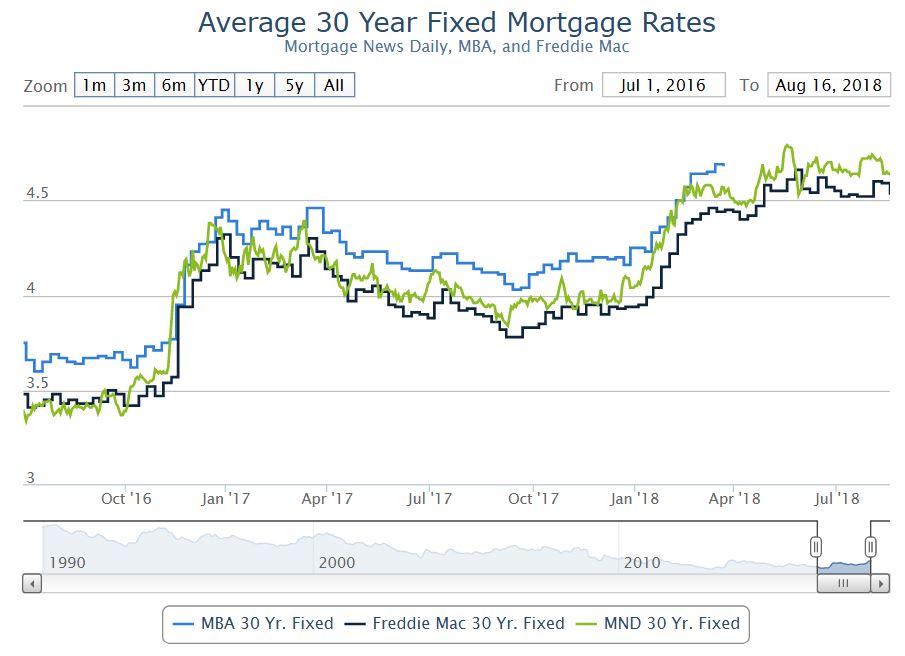
We believe that affordability issues, mainly mortgage rates, are a more credible reason for housing’s recent slump. Affordability is a function of house prices, mortgage rates and income. Earlier this year, we noted that there was evidence that the housing market’s sensitivity to mortgage rates is increasing. The recent weakness in housing is consistent with this, since past increases in mortgage rates have been sufficient enough to be a drag.
To assess the impact, we ran through our U.S. macro model a scenario of a permanent increase in mortgage rates of 1 percentage point in the first quarter. That would be roughly the average of the gain during the taper tantrum and following the presidential election. The results show that the hit to residential investment is noticeable over the course of the subsequent year; real residential investment would be 7% lower than the baseline —enough to shave 0.1 to 0.2 percentage point off GDP growth for the year.
So far, mortgage rates have risen by 60 basis points this year, so the hit is smaller than our exercise, but it supports our view that higher interest rates are hurting housing.
Though there are headwinds, new-home sales and construction haven’t peaked, as fundamentals remain supportive. To estimate the underlying demand for new housing units, we broke it up into its main components, the trend in household formations, demand for second homes, and scrappage or obsolescence. The biggest source of demand is household formations, which have been running around 1.3 million per annum recently and this should continue over the next couple of years.
Demand for second homes tends to grow with the total number of housing units. We estimate that demand is running around 200,000 per annum. Housing units are scrapped from the housing stock each year because of demolition, disaster and disrepair. We estimate scrappage at 200,000 per year.
Even though underlying demand for new housing units is 1.7 million, housing starts should exceed that. Each year some housing units are started but never completed; assuming this is 1% of total housing starts—likely conservative—that would be an additional 17,000 starts. Underlying demand is about 25% below housing starts in the first half of this year. To close this gap over the next two years, would require homebuilding to rise 15% per annum. However, given the constraints facing builders this is unlikely. Alternatively, closing the gap in four years would require approximately an 8% gain per annum. Therefore, residential investment won’t be booming but it will be respectable.
Welcome to the Property Imperative weekly to 4th August 2018, our digest of the latest finance and property news with a distinctively Australian flavour.
By the way if you value the content we produce please do consider joining our Patreon programme, where you can support our ability to continue to make great content.
Watch the video, listen to the podcast, or read the transcript.
A big week of news to cover, so let’s get straight in at the deep end with the Productivity Commission report on Competition in Financial Services which was released on Friday. The final report, which was released earlier than expected really highlights the never-mind-the customer attitude of the industry and its regulators. They call out regulatory failure and conflicts of interest across the sector, referring to opaque pricing, unsuitable products, no reward for customer loyalty as well as product complexity and faux competition. Major players have too much market power, and have fingers in multiple segments of the market. Customers lose out as a result. They made a wide range of recommendations, including the introduction of a best interest obligation for all providers in the home loans market, mortgage Brokers trail commissions should be phased out, ASIC to ensure that the interests of borrowers are adequately safeguarded in the LMI market, APRA is singled out for myopic regulation. ACCC should focus on encouraging competition across the industry and safeguarding the interests of consumers in the regulatory system, the new payments system needs a proper access regime and the Payments System Board of the RBA should ban all card interchange fees. We discussed the implications in our recent video, and the link to that is above. In summary a number of critical reforms which if implemented could certainly change the landscape for financial customers in Australia for the better, whilst clipping the wings of the major incumbents. We discussed this on ABC Radio. Good Job, Productivity Commission. Let’s now see if the Government is up to the challenge.
There was a bit of good news on the retail front, with turnover for June, the month of the end of year sales, where deep discounting was the hallmark. The ABS says retail turnover rose 0.4 per cent seasonally adjusted, which follows a 0.4 per cent rise in May. The trend estimate, which I prefer, reported a 0.3 per cent in June following a rise of 0.4 per cent in May 2018. Compared to June 2017, the trend estimate rose 3.1 per cent. In trend terms, clothing and footwear rose 0.7%, department stores rose 0.5% and household goods 0.3%. Across the states, New South Wales and Victoria rose 0.5%, ACT 0.8% and Tasmania 0.9%. Queensland was flat and WA rose just 0.1%, so again the variations are significant. Online retail turnover contributed 5.7 per cent of total retail turnover in original terms in June 2018, a rise from 5.6 per cent in May 2018. In June 2017 online retail turnover contributed 4.1 per cent to total retail.
This means households are spending more than their income growth, by continuing to tap into their savings. So it will be interesting to see if the retail momentum continues, or sags in July after the end of season sales.
Continuing the “cat among the pigeons” theme, ANZ parted company from its competitors by cutting its variable home loan rate for new customers. While banks including the CBA have cut fixed loan rates and offered “honeymoon deals” in recent weeks, the ANZ is the first to move on variable rates. The ANZ told mortgage brokers it was bringing down its basic principal and interest home rate for owner-occupiers by 0.34 percentage points to 3.65 per cent. The ANZ offer only applies to new customers looking for a loan valued at 80 per cent or less than the value of their property. Loan-to-value ratios above 80 per cent remain unchanged at 3.99 per cent. As we discussed in our separate post “ANZ Ups The Ante In The Mortgage Wars” – the industry is homing in on lower risk customers in an attempt to maintain loan book growth. We also discussed this significant event on 2GB’s Money Show with Ross Greenwood. As Ross said, picture the lions around a shrinking watering hole trying to protect their territory!
Also this week ASIC released their review of exchange traded products (ETP’s) in Australia. These are open-ended investment products that are traded on a securities exchange market. ETPs trade and settle like shares and give investors exposure to underlying assets without owning those assets directly. They differ from listed funds because they are open-ended. This means that the number of units on issue may increase or decrease daily depending on investor demand. ETPs, especially exchange traded funds (ETFs), are increasingly popular with retail investors and self-managed superannuation funds (SMSFs). This is because of their accessibility, perceived low cost, transparency, intraday liquidity, diversification benefits and ability to provide exposure to new asset classes. There has been steady growth in both funds under management and the number of ETP products available on the market in Australia. ASIC called out a number of concerns, including the question of spreads and liquidity, the concentration of market makers, and the lack of good disclosure. More of the same-ol’ same -ol’. Potential investors should be wary.
Data from the Household, Income and Labour Dynamics in AustraliaHILDA survey came out this week and showed again the rise in the proportion of the household population who is renting, with the number of Australian renters eventually becoming homeowners plummeting over the last 15 years – particularly for those between the ages of 18 and 24. The survey found the overall proportion of people living in rental accommodation has increased by 23 per cent since 2001 to 31.3 per cent in 2016. They called out “The growing evidence of ‘intergenerational inequality’”. The data also chimes with our surveys, that more households are under financial pressure thanks to flat incomes and rising costs. It’s worth highlighting their data only runs to 2016, so it’s already a couple of years old. We think the trends continue to grow, based on our latest Mortgage Stress data which will be out next week.
And another survey from mortgage lender State Custodians found that as many as 15% of surveyed homeowners have faced challenges when trying to refinance, due to falling property prices. The figures published by State Custodians also revealed that young people were the most affected, with around 34% of those under the age of 34 saying they’ve been unsuccessful in re-financing because of declining property values. This highlights the rise of “mortgage prisoner’s” who cannot refinance to get the better deals because of little or no equity, or other financial pressures.
And talking of households in financial pressure, the number of Australians falling behind on their mortgages will rise in the next two years as interest-only loans end and repayments get more expensive, ratings agency Moody’s warned this week. Delinquencies on loans that have converted from interest-only to principal and interest are running at double the rate of those still on interest-only, they said. About 40 per cent of loans by Australian banks in 2014 and 2015 were interest-only for five years, meaning a large portion are set to come under pressure with higher repayments in 2019 and 2020, said Moody’s. This backs up our findings, which estimates that more than 970,000 Australian households are now believed to be suffering housing stress. We discussed this in our video Wither Interest Only Loans.
Genworth, the Lender’s Mortgage Insurer related their 1H18 results this week and their profit remains under pressure, as claim rates rise. The Delinquency Rate increased from 0.51% in 1H17 to 0.54% in 1H18, and they pointed and increase in the number of delinquencies in Western Australia, New South Wales and to a lesser extent South Australia. This was partially offset by a decrease in delinquencies in Victoria and Queensland. New delinquencies were down in the half (1H18: 5,565 versus 1H17: 5,997). Delinquencies in mining areas are showing signs of improving. In non-mining regions there are indications of a softening in cure rates.
Turning now to property, the home price slides continue, as we discussed in our post “Home Price Falls Are Just Starting (…more to come!). We discussed the importance of looking at the local, micro property markets as the averages mean nothing. For example, over the past year prices are down more than 20% in some suburbs, and not necessarily where you might expect.
And talking of videos, do check out the latest in our series of Adams/North discussions, “The Great Airbrush Scandal – Policy Failure of the Year!”, where we dissect APRA’s Bank Stress Tests and conclude they were not fit for purpose. This one has already generated a large number of comments and observations. John suggests our regulators are asleep at the wheel! You can also read his original article.
Corelogic says Auction volumes are lower across each individual capital city this week with 1,224 homes scheduled to go under the hammer, down from 1,536 last week. A further sign of weakness in the property sector. Melbourne is particular is slowing fast.
Last week the homes taken to auction across the combined capital cities, returning a final auction clearance rate of 55.6 per cent, down from 57.0 per cent across 1,257 auctions the previous week. Over the same week last year, 1,987 homes went to auction and a clearance rate of 68.7 per cent was recorded. Melbourne’s final clearance rate was recorded at 58.5 per cent across 802 auctions last week, compared to 59.9 per cent across 613 auctions over the previous week. This time last year 956 homes were taken to auction across the city and a much stronger clearance rate was recorded (75.6 per cent). Sydney’s final auction clearance rate came in at 52.4 per cent across 469 auctions last week, down from 55.2 per cent across 407 auctions over the previous week. Over the same week last year, 714 homes went to auction returning a clearance rate of 65.4 per cent. Across the smaller auction markets, clearance rates improved across Canberra and Perth, while Brisbane and Adelaide saw clearance rates fall week-on-week. There were no auctions recorded in Tasmania last week. Of the non-capital city auction markets, the Hunter region was the best performing in terms of clearance rate, with 10 of the 14 reported auctions selling (71.4 per cent), followed by Geelong with a 65.0 per cent clearance rate across 20 results. The busiest region for auctions was the Gold Coast where 39 homes were taken to auction, returning a clearance rate of just 32.3 per cent.
Building approvals in June were slightly stronger in trend terms, rising by just 0.1% as reported by the ABS. The Mainstream media fixated on the stronger, but less reliable seasonally adjusted figures. Among the states and territories, dwelling approvals rose in June in the Australian Capital Territory (5.8 per cent), South Australia (5.6 per cent), Northern Territory (4.8 per cent), Tasmania (2.2 per cent), Western Australia (1.7 per cent) and New South Wales (0.2 per cent) in trend terms. Dwelling approvals fell in trend terms in Queensland (1.6 per cent) and Victoria (1.2 per cent). Overall momentum is slowing in our view, as demand for high-rise investment apartments ease.
And overall lending for housing is still tracking higher despite investor lending sliding, according to the latest RBA and APRA figures for June. Owner occupied housing lending rose 0.6% or $6.6 billion to $1.18 trillion, while investment lending fell $800 million, down 0.1% in seasonally adjusted terms, or rose $1 billion, up 0.2% in original terms. (I have no idea what adjustments the RBA makes, it’s not disclosed!). Investment lending fell to 33.5% of the portfolio. Total lending for housing is a new record $1.77 trillion, and remember this is at a time when housing debt to income is knocking on the 200 door, and we are one of the most in debt nations on the planet. Lest we forget, loans need to be repaid, eventually! We discussed both the credit data and the building approvals in our video “Another Housing Record Set”. We have not fundamentally addressed the credit elephant in the room. Despite all the noise. Perhaps the regulators would like to tell us, how much debt is too much? We clearly have not hit their pain threshold yet, despite the rising financial stress in many households.
So to the markets. Locally, the ASX100 finished down a little on Friday to 5,126, still significantly higher than earlier in the year. The banks were down, for example, CBA fell 1.15% on Friday, to end the week at 72.83, in reaction to the Productivity Commission report. Westpac fell 0.96% to end at 28.91. AMP also fell, down 0.85% on Friday, to 3.50, despite a broker’s report suggesting there may be long term value in the stock, after a restructure. The market was perhaps not convinced.
The Aussie was below 74 cents against the US dollar, despite a small rise on Friday, to 73.97, but higher, up 0.29% to 5.05 against the Chinese Yuan. It appears China is flexing its currency muscles in response to the US trade tariffs.
The Bank of England lifted their cash benchmark rate 0.25% to 0.75% as inflation is above the lower bounds target, despite the uncertainty surrounding Brexit (be it hard or soft). The Aussie was up 0.62% on Friday against to UK Pound to 0.56 cents in reaction to the news.
Across the pond in the US market, Apple took market attention for a host of reasons this week, including reaching a historic Wall Street milestone by becoming the first U.S. company to hit $1 trillion in market capitalization. Apple Inc stock hit the target number of $207.05 (based on the numbers of shares outstanding reported in its 10Q) just before noon on Thursday. Shares closed solidly above that Friday at 207.99. Shares moved into trillion-dollar territory following a strong earnings report earlier this week. On Tuesday, Apple’s fiscal third-quarter results beat on the top and bottom lines, driven by sales of the pricier iPhone X and subscription revenue to services such as Apple Music and its App Store. Apple also lifted the cloud that was hovering over the tech sector following weak reports from Facebook and Twitter. The NASDAQ ended the week at 7,812, a strong finish, but not a record, despite the Apple price. The S&P Information Technology sector index finished at 1,277.05 Friday, compared with 1,262.27 a week ago.
The July US employment report gave the market more evidence that the economy is humming along at a pace that won’t alarm the Federal Reserve. Although the rise in nonfarm payrolls was less than expected for July, jobs gains for the two previous months were revised up by 59,000, making the overall rise about in line with forecasts. And average hourly earnings showed wage inflation at the same year-on-year pace as before. That leaves the Fed set up to continue its plan of gradually rising rates. “The economy is growing really strongly and headline inflation set to hit 3% next week, so the case for September and December Fed rate hikes remains strong,” ING Chief International Economist James Knightley said.
Fed fund futures are still pricing in the next rate hike to be at the next September 25-26 meeting. Odds for an additional increase in December remained little changed after the release at around 65%.
The Fed had its say this week as well. The Federal Open Market Committee kept rates unchanged as expected, and also kept the language in its statement substantially the same. The FOMC said it continues to expect that further gradual increases in the target range for the federal funds rate will be consistent with “sustained expansion of economic activity, strong labor market conditions and inflation near the Committee’s symmetric 2% objective over the medium term.” That reaffirmed investor expectations that the central bank remained on track to hike rates twice more this year. “The stance of monetary policy remains accommodative, thereby supporting strong labor market conditions and a sustained return to 2 percent inflation,” the Fed said in its statement.
A report on Tuesday showed that the Fed’s preferred measure of inflation, the core personal consumption expenditures price index, which excludes food and energy prices, was up 0.1% and 1.9% on a year-over-year basis. The Fed targets inflation of 2%.
Oil settled lower for the day and week Friday, as concerns about a trade war stifling demand hurt sentiment. On the New York Mercantile Exchange crude futures for September delivery fell 47 cents to settle at $68.65 a barrel. Oilfield services firm Baker Hughes reported on Friday that the number of U.S. oil drilling rigs in operation fell by 2 to 861, pointing to tightening U.S. output. And the weekly oil inventories numbers showed an unexpected rise in U.S. stockpiles, further weighing on prices. Concerns also remained about escalating output from the OPEC and Russia. On June 22-23, OPEC, Russia and other non-members agreed to return to 100% compliance with oil output cuts that began in January 2017, after months of underproduction elsewhere had pushed adherence above 160%. Even though output continued to decline in Iran, Libya and Venezuela, the survey suggested that compliance had only fallen to 111% in July, suggesting more room for increasing production from the likes of Saudi Arabia or OPEC’s non-member ally Russia.
Trade worries whipsawed this week, keeping the market on edge, amid conflicting reports of U.S. action and proposed retaliation from China. Tensions on Wall Street eased significantly on Tuesday on a report from Bloomberg that both sides were trying to restart trade talks. But that was quickly countered by another report that the U.S. was considering raising tariffs on $200 billion in Chinese goods to 25% from 10%, which the White House later confirmed was under consideration. On Friday, China shot back with a potential plan for tariffs on $60 billion of U.S. goods. “The U.S. side has repeatedly escalated the situation against the interests of both enterprises and consumers,” China said, according to Reuters. “China has to take necessary countermeasures to defend its dignity and the interests of its people, free trade and the multilateral system.” White House Economic adviser Larry Kudlow warned China not to underestimate President Donald Trump.
The Dow Jones ended at 25,462, up 0.54%, high, but not at a peak, while, the US Dollar Chinese Yuan sat at 6.83, right at the top of its range, and China exerts pressure on the rate.
Bond rates were down a little, with the 10 Year benchmark sitting at 2.95, well down from its 3.12 in May. At the short end, the 3-month bond rate is 2.00, still at the top of its range. Libor is still sitting at 2.34, at the top of its range, signalling higher funding costs in the system.
Gold continues lower, at 1,222, as many risk investors are favouring the US Dollar at the moment. Bitcoin ended the week at 7,443 up 0.65% on Friday, but below its recent highs.
So back once more to cats and pigeons. Next week we will be hearing the latest from the Royal Commission in sessions covering wealth management. NAB and MLC are up first, but I will be especially interested in the evidence from the Industry superfunds. We suspect more revelations as the Commission works its magic. And the results from CBA will be a highlight, it will be interesting to see what they report in terms of net interest margin. I am expecting more loan repricing, both up and down.
It’s never a dull moment in the finance and property sector, so expect more turbulence ahead. The bumpy ride continues….
As Generation Y begins to enter the housing market, there could be a change in the types of dwellings sought after, a new report has suggested.
According to industry analyst and economic forecasters BIS Oxford Economics, changes to the age profile of the population over the next decade will likely result in a shift in the type of demand for dwellings, as Generation Y – those currently aged around 20 to 34 years old – begin to have their own families and move onto the property ladder.
According to BIS’s Emerging Trends in Residential Market Demand report, which examines trends revealed by a detailed analysis of Census data from the past 25 years, there will be “solid demand for units and apartments over the next decade” driven by an overall increase in “the propensity to be living in higher density dwellings across all age groups”.
The report outlines that while there will be continued demand for units and apartments over the next decade, the growth in demand will eventually slow.
Senior manager for residential property at BIS Oxford Economics, Angie Zigomanis, has suggested that, over the past 15 years, there has been rapid population growth among 20-to 34-year olds, as well as strong net overseas migration inflows, which have helped support the boom in apartment construction in the past decade by supplying a steady stream of new tenants to the market.
Mr Zigomanis also noted that there is evidence that people are staying in apartments and townhouses longer.
The analyst highlighted that, in Sydney, more than half (53 per cent) of households aged 35-to 39-years old, and nearly half (49 per cent) of households with children at a pre-school age, now live in these smaller dwellings.
While households have typically favoured townhouses over apartments, in Sydney and Melbourne, there has been an acceleration in the take-up of apartments by both groups since the 2011 Census. The trend has also been similar, although less pronounced in Brisbane, Adelaide and Perth, the report added.
Looking to the future, BIS notes that rising demand for smaller dwellings by Generation Y over the next decade would be apparent across all capital cities, although will be most pronounced in Sydney, and to a lesser extent Melbourne, where separate houses are least affordable.
In Brisbane, Adelaide and Perth, it argued, householders would be much more likely to be in a detached house once they enter their late 30s and 40s, and strong demand for new separate houses is therefore likely to continue.
However, BIS argues that it is likely that rising house prices and decreasing housing affordability in the most desirable locations in the capital cities are causing “an increasing trade-off” for some couples and family buyers between price, size of dwelling, and location, with many seeking smaller and more affordable dwellings to remain close to their desired location.
The analysts argued that, should this trade-off activity increase as Generation Y gets older, then this provides an opportunity for developers in all capital cities to meet this demand, especially given the fact that the boom in multi-unit dwelling construction has up until now been investment-driven “with design being geared toward Generation Y renters living as singles, couples without children, and in share households,” BIS said.
“To meet the potential growing number of Generation Y families in established areas, multi-unit dwellings will need to be designed to be more appropriate to family life, offering more space, both indoor and some outdoor, or located adjacent to public outdoor spaces,” said Mr Zigomanis.
“In particular, new apartment designs will need to change to provide more appropriate product for Generation Y families.”
However, should Generation Y follow the trend of the previous generations and eschew renting for owning their own, larger dwellings as they age, then this would “support a decade-long boom in demand for new houses and land in the new housing estates on the outskirts of Australia’s major cities and affordable major regional centres,” said Mr Zigomanis.
“Pressure is also likely to be maintained on house prices in established areas, as competition remains strong for Generation Y families looking to remain in the established areas where they have already been living and renting in smaller apartments,” he said.