Yellow Brick Road Restructures For Growth

Yellow Brick Road has announced 2015 results, and a restructure to grow their loan book to $100 billion by 2020. The core emphasis is to provide rounded financial advice to middle Australia, blending from mortgage selection through to wealth management.

In FY 2015 Yellow Brick Road Holdings (the Company) was focused on acquisition, with the purchase of Vow and Resi occurring in Q1 and the integration of these businesses through the balance of the year.

During the final three  quarters of FY2015, the scaled up business achieved three consecutive operating cash surpluses totalling $3.93m.

In FY2016, the Company has seen an opportunity to acquire significant scale organically, as market noise around home loan rates draws consumer attention to their mortgages. Consequently, we have made a strategic decision to  invest in a major market-share push, through increased Yellow Brick Road marketing activity. Substantial additional leverage is applied to this investment through the Company’s relationship with key investor Nine Entertainment Co, owner of the Nine Network. As expected, this marketing investment has generated an operating cash deficit in Q2 FY2016 of $1.70m. On a normalised basis, this operating cash deficit was $1.32m, an increase of $0.62m on last quarter which is roughly in line with the $0.64m increase in marketing spend. The Company retains more than sufficient funding to support this marketing investment. At the end of the quarter the Company had cash and undrawn finance facilities totalling $13.5m. Also as expected, this marketing investment is delivering significant uplift in new customer introductions, with Q2 FY2016 leads up +299% vs prior corresponding period (PCP). These began flowing through to loan settlements in December (+51% vs December 2014).

YBR reported Q2 FY2016 settlements up 38% vs PCP to $4.2bn. The group loan book ended the quarter at $33.9bn up 22% PCP. Overall funds under management was up 34% PCP to $700m.

A recent interview with Matt Lawler covers the business strategy and 2015 results.

Some further details of the strategy From Australian Broker

Mark Bouris has announced a major restructure of the Yellow Brick Road group as it strives to hit a $100 billion loan book by 2020.

The restructure aims to streamline the group by better aligning the company’s core business units – lending and wealth management.

The former leadership structure was shaped by two separate business entities: Vow Financial, headed by CEO Tim Brown and YBR, headed by CEO Matt Lawler. The new business structure will integrate the two business entities with Brown and Lawler operating across the entire group in the two strategic verticals – lending and wealth management – rather than operating separately across Vow and YBR.

As a result, Brown has been appointed to the newly created CEO – Lending and Lawler has been appointed to the newly created CEO – Wealth Management. Chief commercial officer (CCO) Scott Graham will support Lawler and Brown, continuing to oversee commercial strategy, marketing, media and investor relations.

“Our intention in 2016 is to double down on our wealth activities and maintain the momentum in our lending businesses. As a result I have re-appointed our current CEOs’ portfolios to align with the two business units and reflect their individual expertise and strengths,” YBR executive chairman Mark Bouris said.

According to Bouris, this more streamlined and cooperative approach will allow the finance giant to reach its goal of becoming the leading non-bank financial services company in Australia. This entails hitting a $100 billion loan book by 2020, as well as achieving 30% wealth clients and reaching 300 branded branches and 1,000 broker groups in the same time frame.

“Our company goals are ambitious but with the new structure in place we will be well-placed to achieve them. I’m confident these leaders have the drive, experience and knowledge to propel Yellow Brick Road Holdings forward towards our big objective to become the leading non-bank financial services company in Australia,” Bouris said.

Speaking to Australian Broker, CEO – Lending Tim Brown said his role will be to ensure both YBR and Vow brokers are well-placed to continue to gain market share.

“We have really enjoyed phenomenal growth over the last three or four years in both YBR and Vow, so part of my role is to make sure we continue that growth in a more challenging environment with a slowing property market, and continue to build the quality of our brokers and our licensees.

“We have no doubt that we can continue to gain market share, we have a great offering in both businesses and we will continue to push those offerings.”

Brown said the group has a number of new initiatives in the works, but a major focus will be around debt management.

“The RBA and APRA are concerned about the level of debt that people are taking on and we want to be at the forefront of that.”

CEO – Wealth Management Matt Lawler told Australian Broker that his priority will be to make wealth management and financial planning capabilities accessible and flexible across in the group.

“[My strategy] is probably two-fold because we have been on the wealth management journey with the Yellow Brick Road business for a few years now and we have had success in concentrated areas around Australia. The real focus for YBR is to make sure there is comprehensive wealth management right across all branches – it is really about embedding wealth management into every branch right around the country.

“Vow is very early on the wealth management journey so the focus with the Vow business is to make sure everybody is aware of the opportunities that present themselves from a wealth management point of view.

“That will be everything from getting every broker access to very simple products, such as simple insurance and simple investment products, right through to a smaller number of Vow brokers who have expressed an interest in fully implementing a financial planning capability in their business.”


Westpac Reports 1Q16 Capital and Asset Quality

Westpac does not provide a 1Q16 profit update, but has disclosed some information about the business in the context of Pillar 3 reporting. From that, the banks appears to be weathering the current conditions well, though their large mortgage book shows minor rises in impairment. They are well capitalised, though with a lower share of deposits in the funding mix, compared with some of updates from other banks.

Looking at exposures by industry, they reported small rises in the consumer book – including 2 basis points increased in group mortgages +90 day delinquencies to 44 basis points, in property and business services and construction.

The proportion of mining which is stressed has risen from 1.9% to 2.2%.

WBC-Feb-2016-2 Australian mortgage 90+ delinquencies were up 1 basis point to 46 basis points, with WA and QLD the highest, NSW/ACT, much lower.

WBC-Feb-2016-3Australian personal loans 90+ days delinquencies were up, at more than 1.5%.

They reported improved capital ratios with common equity Tier 1 (CET1) at 10.2% and APRA’s leverage ratio at 4.9% (up from 4,8% in Sept 2015.

WBC-1-Feb-2016Funding was helped by $14bn raised year to date (31 Jan 2016), whilst customer deposits made up 60.2% of funding, up slightly from September. 14.7% of funding was off-shore.

AMP reports A$972 million net profit for FY 15

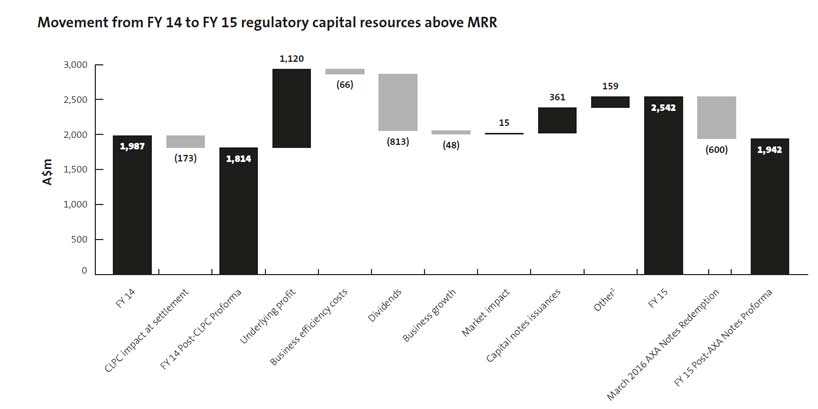
AMP has reported a net  profit of A$972 million for the full year to 31 December 2015 , up 10 per cent on A$884 million for FY 14. Underlying profit  was A$1,120 million compared  with A$1,045 million for FY 14, up 7 per cent year on year, with good earnings growth particularly in Australian wealth management, AMP Capital, AMP Bank and New Zealand.

Underlying  return on equity: increased 0.5 percentage  points to 13.2 per cent in FY 15 from FY 14, largely reflecting the increase in  underlying profit.

The 7% increase in FY 15 underlying profit was largely the result of good operating earnings growth in Australian wealth management (+10%), AMP Capital (+20%), AMP Bank (+14%) and New Zealand financial services (+9%). FY 15 Australian wealth protection operating earnings fell 2%, impacted by experience losses of A$11m over the year, while Australian mature operating earnings declined 9%, largely due to the expected portfolio run-off. Underlying investment income fell A$7m on FY 14 to A$125m, reflecting lower average shareholder funds in FY 15.

Total controllable costs rose A$14 million to A$1,329  million as increased investment in growth initiatives and currency movements  were largely offset by the benefits of the business efficiency program.The group cost to income ratio improved 1 percentage point from FY 14 to 43.8  per cent in FY 15.

Momentum continued across Australian wealth management and AMP Capital, which delivered a particularly strong result as their international investment management profile expands, both in China and more  broadly.

Retail and corporate super net  cashflows on AMP platforms increased 5 per cent to A$3,784 million.

AMP Capital external net cashflows were A$4,434  million, up 19 per cent from A$3,723 million in FY 14,  driven by   stronger inflows generated through the   China Life AMP Asset Management  joint venture, institutional and retail domestic clients.

Australian wealth management operating earnings for FY 15 were A$410 million, up 10 per cent compared with FY 14, driven by strong net cashflows leading to a 10 per  cent growth in AUM.

Australian wealth protection operating earnings were A$185 million in FY 15 compared with A$188 million in FY 14.  Claims experience reflected the continued roll out of the new claims approach, reversion to long term assumptions and volatility in the second half of the  year.

  • AMP  Capital: The delivery of key priorities for the year, coupled with strong investment performance, drove 20 per cent growth in  operating earnings and improvement in total net cashflows of A$1.4 billion compared to FY 14.
  • Expanding  global footprint: AMP Capital increased FUM managed on behalf of international institutional clients by more than A$2.0 billion  to A$6.8 billion during the year, which included growth in the global  infrastructure platform. AMP’s relationship with China Life and MUTB remains strong.  The financial performance of the joint ventures with China Life are  ahead of expectations.
  • AMP Bank: The bank’s  growth momentum continues with operating earnings increasing by 14 per cent to A$104 million in FY 15 from an improved net interest margin and growth in the loan book.  Net interest margin was 1.59% for FY 15, up 18 basis points from FY 14 and up 6 basis points from 1H 15. AMP Bank’s return on capital was 16.5%, up 1.3 percentage points from FY 14 (15.2%). Customer deposit to loan ratio was 63% for FY 15, compared with 64% for FY 14. The Capital Adequacy Ratio (CAR) was 12.8% as at FY 15 (12.2% at FY 14). The Common Equity Tier 1 Capital Ratio for FY 15 was 7.9% (9.3% at FY 14). This reduction is the result of a capital return to the group of A$100m of common equity, following the on-lend of Additional Tier 1 capital from the AMP Wholesale Capital Notes issued in March 2015. Both ratios remain well above APRA and internal thresholds. The Bank is compliant with the Basel III capital requirements, which took effect from 1 January 2016.
  • New  Zealand: Operating earnings in New Zealand increased 9 per cent, reflecting strong growth in profit margins and experience. Learnings from Australian claims management were used to help drive good experience outcomes.  KiwiSaver is a key growth engine for the wealth management business. NZFS was the third largest KiwiSaver provider with 13% of the total KiwiSaver market as at June 2015 and had approximately 245,000 KiwiSaver customers. In FY 15, KiwiSaver had NZ$3.9b in AUM, an increase of 13% from FY 14.
  • Business  efficiency program: During FY 15, AMP continued to deliver on the three year business efficiency program, which is targeting recurring cost savings of A$200m (pre-tax) per annum (80% controllable costs and 20% variable costs). The estimated one-off cost of implementation is A$320m (pre-tax) or A$224m on a post-tax basis. During FY 15, costs incurred were A$66m post-tax. The expected pattern of post‑tax
    expenditure over FY 16, the final year of the program, is A$19m.
  • Face-to-face  advice of the future: The development of a new goals based face-to-face advice experience continued, with positive results in FY 15 from five pilot sites. The trial is being expanded in FY 16 as part of AMP’s ambition to set a benchmark for high quality, professional advice.

AMP maintained its strong capital position with a surplus of A$2.5 billion at 31 December 2015, above minimum regulatory requirements. The increase was driven by retained profits,  the successful issuances of AMP Wholesale Capital Notes and AMP Capital Notes.

AMP-FY15AMP intends to redeem the AXA Notes on 29 March 2016 when they  cease to be eligible capital under the subordinated transitional arrangements  provided by APRA.  This will reduce  capital resources above minimum regulatory requirements by A$600 million.

AMP maintains a strong balance sheet, with little change to  gearing and access to significant liquidity.

The Board has declared a 4 per cent increase to the final  dividend to 14 cents per share, compared with 13.5 cents per share for the 2014  final dividend. This represents a payout  ratio of 75 per cent of underlying profit.

The 2015 final dividend will be franked at 90 per cent, up from  80 per cent in 2014 with the unfranked amount being  declared as conduit foreign income. AMP has revised its future dividend policy to a target range of 70 to 90 per cent of underlying profit reflecting confidence  in the financial strength of the group.

NAB Q1 2016 Trading Update

National Australia Bank reported Q1 unaudited cash earnings of $1.7 billion, 8% higher than the prior corresponding period. Statutory net profit was $1.5 billion.

Revenue increased 2%, thanks to stronger lending volumes, a higher NIM and stronger Wealth. Expenses rose 5%. They specifically mentioned the benefit to NIM of home loan repricing. which was partly offset by higher funding costs and competition for business lending.

The charge for Bad and Doubtful debt fell 52% to $84 million. This is explained by the non-repeat of provisions for mining and agribusiness previously made, and improved asset quality in the Australian bank.

Common Equity Tier 1 capital (CET1) was 10.1%, slightly down on the 10.2% at September 2015, thanks to the impact of dividends.

Group leverage ratio was 5.4%.

ANZ Q1 2016 Trading Update Highlights Mixed Conditions

ANZ today announced an unaudited cash profit of $1.85 billion for the three months to 31 December 2015. Earnings momentum continued in the quarter with cash profit up 5% compared to the average of the third and fourth quarters of the 2015 Financial Year (FY15). Statutory net profit was $1.6 billion.

Income grew at a faster rate than expenses, with expenses well contained; technology investment and wage inflation were largely offset by a 2.5% reduction in staff numbers.

The Group Net Interest Margin (NIM) was stable excluding the impact of the Markets business; there was a 2 basis points decrease including Markets.

Retail and Commercial. Retail in Australia and New Zealand continued to perform well led by further market share gains in home lending in key markets. Small Business in both markets grew strongly while Corporate Banking income was impacted by higher funding costs and competition. Wealth benefited from stable Life Insurance lapse rates which were offset by investment market volatility.

Institutional. Markets income increased 6% to $553 million. Customer sales comprised 56% of Markets’ total income in line with the average for both the second half and FY2015. Cash Management performed well and the Group further reduced lower returning assets in Trade and Lending. Institutional NIM improved reflecting actions around asset mix and deposit pricing.

The total provision charge for the first quarter 2016 was $362 million (individual provisions $319 million; collective provisions $43 million). The total Group credit charge will be a little above $800 million this half compared to current market consensus of $735 million1. Gross Impaired Assets for the half will be broadly similar to the second half of 20152 despite falling in the first quarter.

APRA Common Equity Tier 1 (CET1) ratio was 9.4%6 at 31 December 2015. Excluding the impact of the 2015 final dividend payment, the CET1 ratio increased 45 basis points compared to 30 September 2015 primarily driven by organic capital generation and assisted by the Esanda portfolio sale.


Bendigo and Adelaide Bank Results Highlight Tough Times

Today Bendigo and Adelaide Bank presented their 1H results to December 2015. It has clearly been a tough half, because they are a small player with high penetration into the mortgage sector, in which competitive pricing has taken its toll. One-offs may flatter, but the underlying trends is the business show there is much to be done.

Statutory profit was $208.7m, while underlying cash earnings were $223.7m, up 2.7% on a year earlier. Cost income ratio remained unchanged at 55.6%. Cash earnings per share were up 1.7% on the prior corresponding period. Return on average ordinary equity was 9.10%.

Total lending growth was 1.5%, much slower than system (8.8%), with business lending falling 1.9% and home lending up 3%. Mortgages account for a significant proportion (66%) of the bank’s business, and they specifically mentioned troublesome competitive dynamics.

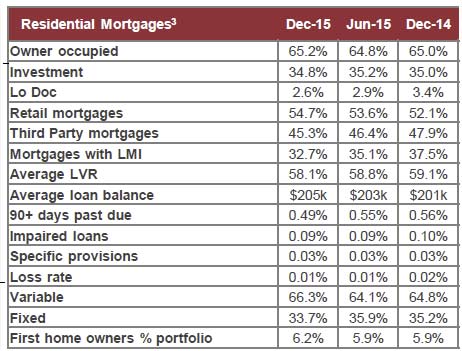
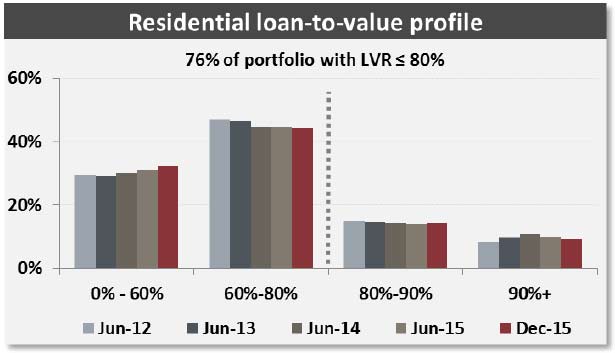
Ben-Mortgages35% of loans are investment property lending, 48% via third parties, and 35% fixed rate loans. Overall residential loan arrears (90 days+) was about 1.3% and is creeping higher.  High LVR loans are controlled.

Ben-LVRRetail banking’s contribution fell 3.7%, to $97.5m, thanks to a fall in NIM and other income, only partially offset by expenses growth. Customers are using more mobile devices for their banking, whilst PC banking is on the decline.

Third party banking’s contribution grew 19.4%, to $80.8m, and NIM grew a little, with around $300m a month, and a portfolio on about $16bn.

Wealth contribution a 4.2% increase to $10m, but again exhibited NIM compression. Funds under management reach about $4.5bn.

Agribusiness’s contribution was up 4.1% to $32.8m, but again NIM was compressed.

Homesafe revenues were up to A$54.5m or 17% of earnings, but this included revaluations, and is probably unsustainable. Margins were down and yet the shared equity portfolio is now $550m (doubled from 2013) and the value is linked directly to house price appreciation, which is slowing.

HomesafeDeposits grew below system at 2.9%.

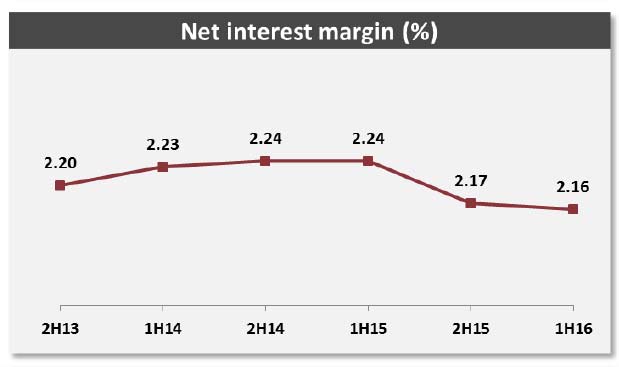
Net interest margin fell by 1 basis point on the prior half year, to 2.16%. The bank suggested mortgage pricing was now a little easier, with monthly NIM trending up.

Ben-nimHowever the longer term data shows the pressure the bank is under.

Ben-MIN-2 Bad and doubtful debt provisions were down 46% to $20.6m.Specific provisions were helped by a fall in Great Southern, but there were rises in retail mortgages and the rural bank.

Ben-Spec-ProvTotal capital increased by 9 basis points to 12.66% and CET1 ratio was 8.24%, up 7 basis points. Work continues to move the bank towards the advanced capital management platform. $64.5m of Basel II costs have been amortised.

Suncorp Cuts Dividend

Suncorp reported their half-year profits to 31 December 2015 today. Group net profit after tax (NPAT) was $530 million, down on HY15 at $631 million, profit after tax was of $544 million compared with HY15 at $681 million, and return on average shareholders’ equity was 7.9%, compared with HY15 of 9.4%. An interim dividend of 30 cents per share fully franked was announced, down from 38 cents HY15.

Basically, after taking a hit on general insurance claims, releasing some reserves, growing the banking business, and driving efficiency savings, the bank has gone backwards. The new CEO, 100 days into the role has a struggle on his hands in the light of market conditions and uncertainties. It is true, that a pure play insurance business would have taken a harder knock, so the portfolio of businesses do offer some hedge. But there is much to be done.

Looking at the segmentals:

General Insurance reported a NPAT of $297 million compared with HY15 of $419 million, with an underlying insurance trading ratio (UITR) of 10.1% compared with HY15 of 14.8%), after adjusting for the impact of higher than expected natural hazards ($362m), investment market volatility and the continuation of strong prior year reserve releases. The bank pointed to both environmental and operational factors to explain the fall off in performance.  There will need to be a strong focus on claims management efficency.

Personal Insurance Gross Written Premium (GWP) returned to growth, increasing by 0.6% as a result of increases in average premiums offset by the exit of some corporate partner relationships. This is the first time growth has been reported in five halves. Customer retention remained strong, demonstrating the strength of the Group’s brands and stabilisation in the personal insurance market.

Commercial Insurance GWP grew by 2.2% with a strong growth across the compulsory third party (CTP) portfolio, partially offset by a negative impact from the Western Australian Workers Compensation portfolio.

Compulsory Third Party (CTP) GWP grew 6.8% with Suncorp leveraging the scale of its national CTP model to continue expansion into the ACT market as well as benefitting from the withdrawal of competitors in key markets.

New Zealand GWP was up 2.6% (in $A terms) due to strong growth in personal lines.

Bank NPAT increased to $194 million compared with HY15 at $176 million as a result of improving credit quality and very low impairment losses, which fell to $11 million, or 4 basis points of gross loans, well below the expected range of 10 to 20 basis points of gross loans. Gross impaired assets reduced by 32.8% and total gross non-performing loans reduced by 15.1%.

Net interest income increased 2.4% to $566 million. The Bank’s NIM improved 2 bps over the half to 1.85% to sit at the top of the 1.75% to 1.85% target operating range, with market-wide repricing offsetting increases in funding costs and heightened competition, and the Cost to Income ratio of was 53.0% compared with HY15 of 52.2%.

Suncorp-NIMHome lending grew 8.2% to $43.0 billion despite intense price competition particularly in the Bank’s traditional owner-occupied segment given the current regulatory landscape. Mortgage brokers are responsible for 63% of Suncorp’s $43 billion mortgage book, leaving its direct branch channel behind 37% of home loans settled. The Bank pursued growth outside its traditional Queensland market with 60% of new business originating interstate supported by strengthened capability in the intermediary channel. A disciplined approach to investor lending has seen growth reduce below 10% year-on-year. Business lending contracted 3.0% during the half to $9.5 billion, partially driven by better than expected seasonal repayments from cropping and livestock proceeds in the agribusiness portfolio.

Retail deposits remain the core source of funding, with a deposit to loan ratio of 65.6%, comfortably within the Bank’s 60% to 70% target range. The Group’s A+/A1 rating continued to provide a competitive advantage allowing access to both secured and unsecured funding markets and significant diversification and flexibility.

Impairment losses on loans and advances were $11 million, representing 4 bps of gross loans and advances. Gross non-performing loans reduced 15.1% to $557 million. Gross impaired assets decreased 32.8% to $176 million, representing 33 bps of gross loans and advances. Provision coverage remains appropriate and the Bank continues to retain the prudent $8 million drought overlay.

The CET1 ratio increased 30 bps to 9.45%, above the top end of the 8.5% – 9.0% target range. The Bank’s Return on CET1 continues to improve, up 90 bps to 13.1% and is within the Bank’s 12.5% to 15.0% target range. This improvement has been supported by the Bank’s Advanced Accreditation program, with a better understanding of risk selection, pricing and capital planning.

Suncorp Life NPAT was $53 million compared with HY15 of $86 million, with underlying NPAT increasing to $58 million compared with HY15 of $52 million,  following the third consecutive period of positive claims and lapse experience.

After accounting for the interim dividend, the Group’s total capital position remains strong with CET1 capital of $506 million held above the Group’s operating targets. The General Insurance CET1 is 1.25 times PCA and the Bank CET1 is 9.45%.

Going forwards, the strategy appears to focus on cross-selling more products to existing customers, rather than growing the customer base. There will also be a focus on cost optimisation, including prospective benefits of $170m in 2018.

CBA Profit Up 2% HY to Dec 2015

In CBA’s results, announced today, we see a well managed portfolio, with no surprises on either capital or dividends. They had the benefits of higher home loan pricing, and deposit rate management helping to offset some pressure in returns from the Institutional Banking arm. CBA’s early moves into digital banking continue to pay off, with 40% of retail banking sales now via mobile devices. Exposure to the resources sector is controlled, and the bank is well capitalised (on  a relative and absolute basis), with a lift in key ratios. Earning per share decreased a little.

Statutory net profit after tax (NPAT) for the half year ended 31 December 2015 was $4,618 million, a 2 per cent increase on the prior comparative period (‘pcp’). Cash net profit after tax increased 4 per cent to $4,804 million, 6 per cent higher on the prior half. Return on equity was 16.6% and earnings per share was 273.6 cents, a decrease of 1% on the prior comparative period.

The Board declared an interim dividend of $1.98 per share, unchanged from the 2015 interim dividend. The dividend payout ratio is 70.8 per cent of cash NPAT. The interim dividend, which will be fully franked, will be paid on 31 March 2016. The ex-dividend date is 16 February 2016. The Dividend Reinvestment Plan (DRP) will continue to operate, but no discount will be applied to shares issued under the plan for this dividend. The Group is also considering the issue of a Tier 1 capital instrument to replace PERLS III should markets be receptive.

In summary, operating income growth was solid across most businesses, relative to both the prior comparative period and prior half but operating expenses increased due to underlying inflationary pressures, the impact of foreign exchange, increased investment spend and higher amortisation, though partly offset by the incremental benefit generated from productivity initiatives. Also loan impairment expense increased mainly due to higher provisioning in Institutional Banking and Markets, Retail Banking Services, and IFS.

Group transaction balances grew 21 per cent and above-system growth was achieved in household deposits (up 10.6 per cent) and business lending (up 6.8 per cent, excluding Bankwest). A balanced approach to margin over volume in home lending produced growth of 6.5 per cent, slightly below system. ASB saw 12 per cent growth in business and rural balances.

Other banking income increased 4 per cent, due to higher profits from associates and solid growth in fees and commissions, partly offset by derivative valuation adjustments.

Growth in insurance and funds management income of 17 per cent and 6 per cent, respectively, led to a 10 per cent increase in underlying profit after tax for the Wealth Management division.

Operating expenses increased 6% to $5,216 million, including a 1% impact from the lower Australian dollar. This reflects higher staff costs from inflation-related salary increases, increased investment spend and higher amortisation. This was partly offset by the continued realisation of incremental benefits from productivity initiatives

Ongoing investment spend, inflation and unfavourable foreign exchange movements resulted in a 6.1 per cent increase in total operating expenses. On an underlying basis, expenses grew 3.8 per cent as a result of cost discipline in business units. Total investment spend increased 14 per cent, with the majority earmarked for productivity and growth initiatives.

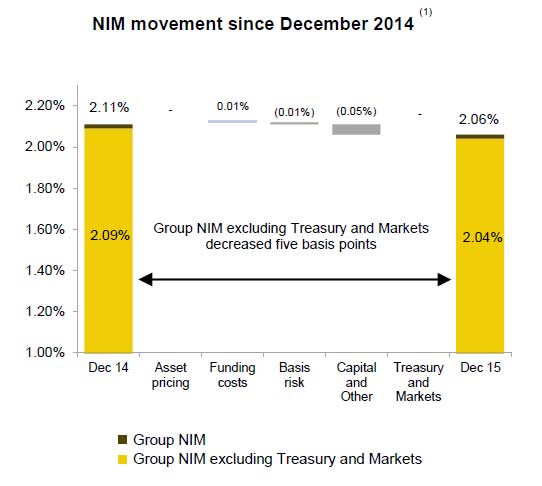
Net interest income increased 6 per cent to $8,364 million, reflecting 9 per cent growth in average interest earning assets driven by solid volume growth and revenue momentum across the business. This increase includes a 1% benefit from the lower Australian dollar. Net interest margin excluding Treasury and Markets decreased five basis points on the prior comparative period to 2.06%.

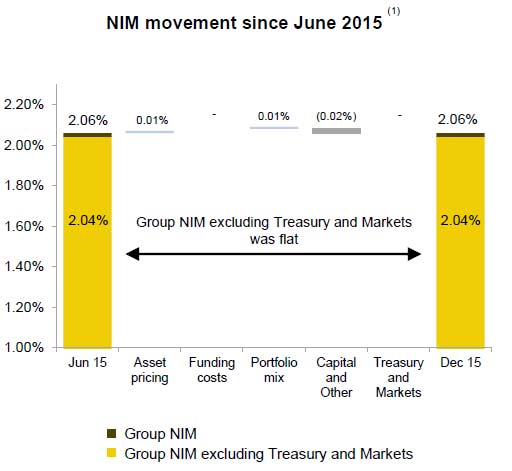
CBA-Feb-2106-1However, overall, 2.06% is the same as Jun 15 Half.  This was helped by higher home lending margins, due to investor and variable rate pricing; and stable deposit margins, driven by a benefit from a change in deposit mix, offset by the lower cash rate environment. In addition, better margins from lending to business, and lower business deposit rates contributed.  However, at BankWest, net interest margin decreased on the prior half, due to lower business lending margins and the lower cash rate impact on deposit margins, partly offset by increased home loan margins resulting from repricing.

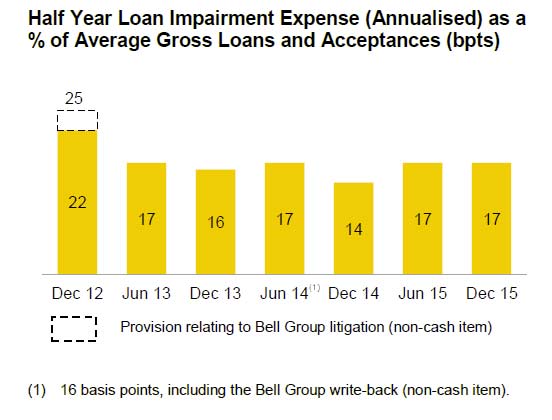
CBA-2016-NIMLoan impairment expense increased 3 per cent on the prior half to $564 million, and the loan loss ratio remained stable at 17bpts.

CBA-2016-3Various elements contributed to this  including higher collective provisions and a lower level of writebacks in Institutional Banking and Markets; an increase in IFS as a result of provisions in the
commercial lending portfolio; partly offset by reduced expense in Retail Banking Services driven by seasonally lower arrears across all portfolios; increased write-backs and lower collective provisions in Business and Private Banking; and decreased expense in New Zealand resulting from lower home loan impairment expense, and an increased level of write-backs in the business lending portfolio.

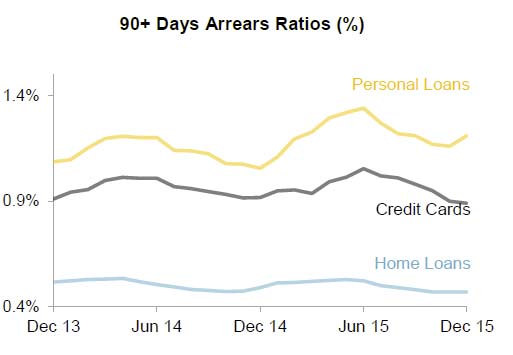
Consumer arrears were well controlled, though whilst the arrears for the home loan and credit card portfolios are relatively low, personal loan arrears remained elevated, driven primarily by Western Australia and Queensland.

CBA-2016-4Commercial troublesome assets increased 2% during the half to $3,123 million. Gross impaired assets were lower on the prior half at $2,788 million. Gross impaired assets as a proportion of GLAAs of 0.41% decreased 3 basis points on the prior half, reflecting the improving quality of the corporate portfolios.

There was no change to the economic overlay.

The Group’s balance sheet and conservative positions on capital, funding and liquidity have been strengthened in the first half. Growth in customer deposits of 9 per cent to $500 billion increased deposit funding to 64 per cent of total funding, up 1 per cent. The Group’s liquidity coverage ratio increased to 123 per cent as at 31 December 2015, up from 120 per cent at the end of the prior half, with the Group continuing to benefit from a strong position in more stable deposits.

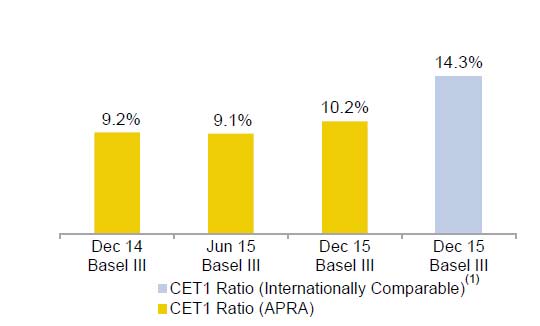
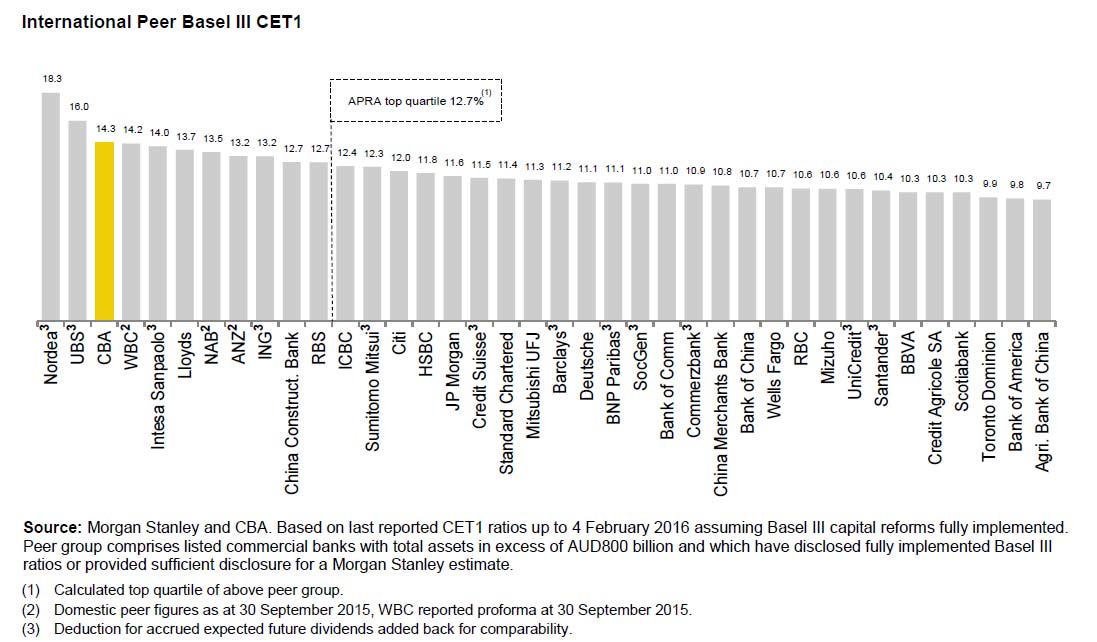
Basel III Common Equity Tier 1 (CET1) capital increased 100bpts to 10.2 per cent on an APRA basis (14.3 per cent on an internationally comparable basis), reflecting organic capital growth and the proceeds of the rights issue.

CBA-2016-5They say this puts the Group in the top quartile of banks globally for capital adequacy.

CBA-2016-6Customer satisfaction rankings continued to improve.
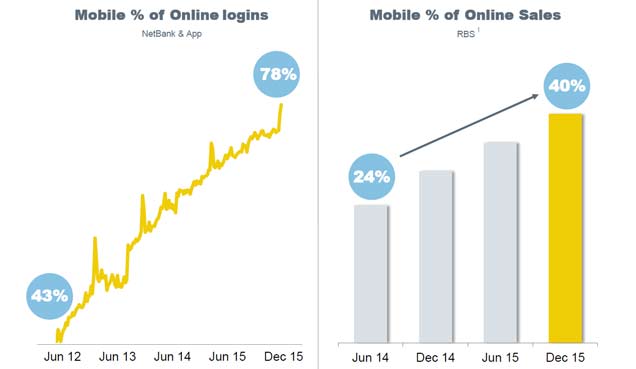
They reported a strong uptake of digital and mobile services in the half with  Tap & Pay card numbers  more than doubling on the prior half, Cardless Cash transactions grew 96 per cent, and the value of transactions via the CommBank app was up 27 per cent. The volume of transfers via mobile now exceeds BPAY volumes through Netbank. They are also seeing customers increasingly turn to mobile for product purchases with mobile now accounting for 40 per cent of Retail Banking Services sales.

CBA-2016-7In the half, CBA made additional future-focused investments in technology and skills. This included $10 million to help Australian researchers build the world’s first silicon-based quantum computer,  committed $1.6 million to develop a centre of expertise for cyber security education with the University of New South Wales. They also launched a series of blockchain workshops for industry and regulators, and are collaborating with other international banks on blockchain trials.

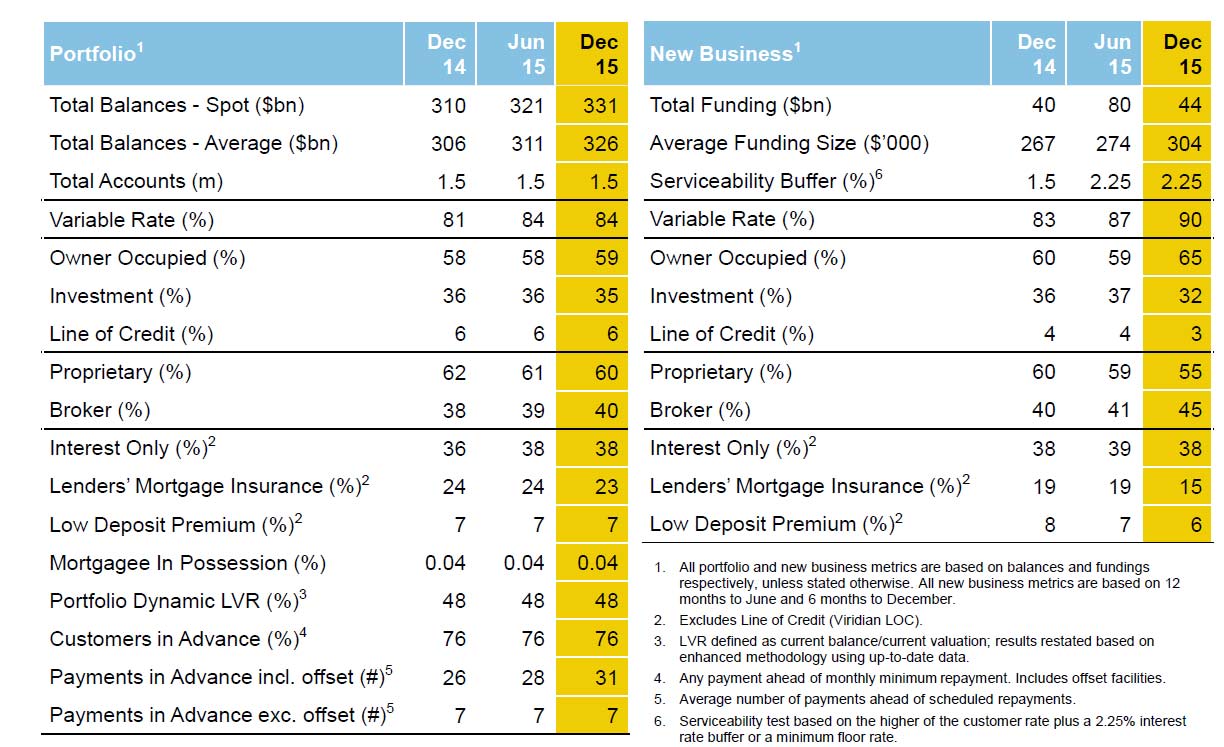
Looking in detail at home lending in Australia, CBA provided some interesting insights. For example,  looking at the core Australian Bank portfolio, 45% of new home loans are originated via brokers. 38% of new loans are interest only, and the current serviceability buffer has been lifted by 75 basis points in the past year. Those customers paying in advance, including offsets, was 76%.

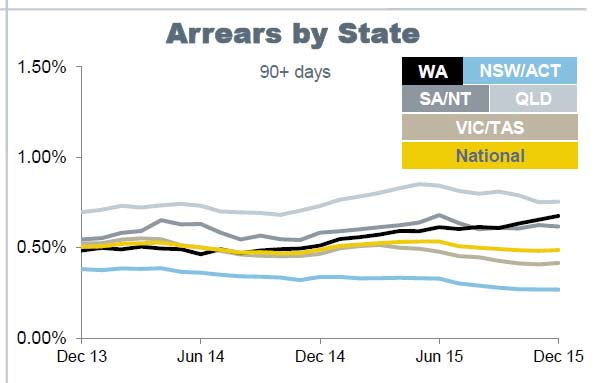
CAB-2016-8They also show that 90+ arrears are growing fastest in WA.

CBA-2016-9On the other hand, portfolio is much stronger in NSW and VIC.

Finally, they reported exposures to Mining, Oil and Gas at $18.9bn – or 1.8% of Group TCE. They argue much of the portfolio is investment grade. Within the portfolio, impaired assets have risen from 0.8% in Jun 15 to 1.9% in December 15.

Bank Of Queensland Tweaks Business Model And Warns On Margins

BOQ has today announced that it is embarking on a program to reshape its organisational structure to better affect BOQ Group’s strategy.

Managing Director & Chief Executive Officer Jon Sutton said the size and shape of BOQ’s business had changed significantly over the last three years as the Group had grown organically and through acquisition.

“We have redefined our strategy over the last 12 months and need to ensure our organisational structure continues to support this strategy,” Mr Sutton said.

“We are building a more flexible and efficient operating model, which is increasingly important given the accelerated pace of change in financial services. This will also improve the way we work by reducing duplication and manual processes and will assist us in finding better ways to share capabilities across the Group.”

To enable these organisational changes to be implemented, an investment in the order of $15m (pre-tax) is anticipated to be incurred over the course of FY16. This expense will not be excluded from Cash Earnings in FY16. The investment required to implement the change initiatives should deliver 100% payback through cost savings within 12 months.

“We expect this investment in fine-tuning our operating model will help accelerate our path towards a Cost to Income ratio in the low 40% range in the years ahead.” Mr Sutton said.

“The uncertainty in the global economic outlook over recent months has resulted in a significant increase in volatility in funding markets. While strong competition for new business remains, this creates headwinds for our margin outlook. The challenges of this market reinforce the need for us to be more nimble and efficient to ensure we can take advantage of opportunities as they arise.”

BOQ will report its half year results for the period ending 29 February 2016 on 7 April 2016.

Macquarie’s Q316 Trading Update

In the latest trading update from Macquarie, despite ructions on the global markets, they said that trading conditions across the Group were satisfactory in the December 2015 quarter. Macquarie continues to expect the FY16 result to be up on FY15. We think they will deliver a profit north of $2.0bn full year.

The annuity-style businesses’ combined December 2015 quarter net profit contribution was up on December 2014 quarter (prior corresponding period) but down on September 2015 quarter (prior period) which benefited from strong performance fees in Macquarie Asset Management. On the other hand, the capital markets facing businesses’ combined December 2015 quarter net profit contribution were down on the prior corresponding period, which benefited from fee income from the Freeport LNG transaction in Commodities and Financial Markets and Macquarie Capital, and up on the prior period.


They reported APRA Basel III Group capital of $A17.3 billion and Group surplus of $A2.8 billion at 31 December 2015.

They said that the Banking and Financial Services’ (BFS) Australian mortgage portfolio was $A27.8 billion at 31 December 2015, up one per cent on 30 September 2015, representing approximately 1.9 per cent of the Australian market. Macquarie platform assets under administration increased to $A59.8 billion at 31 December 2015 up 28 per cent on 30 September 2015 , while BFS deposits increased to $A39.5 billion at 31 December 2015, up two per cent on 30 September 2015. During the quarter, BFS launched the first Macquarie savings and transaction accounts, and new Macquarie Black credit card with premium rewards.

The Group’s short term outlook remains subject to a range of challenges including: market conditions; the impact of foreign exchange; the cost of our continued conservative approach to funding and capital; and potential regulatory changes and tax uncertainties.

Mr Moore said: “Macquarie remains well positioned to deliver superior performance in the medium term due to its deep expertise in major markets, strength in diversity and ability to adapt our portfolio mix to changing market conditions, the ongoing benefits of continued cost initiatives, a strong and conservative balance sheet, and a proven risk management framework and culture.”