Investor and Owner Occupied Loans Rotate

Australian Finance Group has  released its Mortgage Index for the final quarter of 2015.

Investors have continued their retreat from the market with the latest figures showing investor lending had fallen from 40% of total loans processed early in the calendar year to 31% in the last quarter. Gains in both refinancing (36% to 38% of total loans) and upgrader (30% to 35%) categories led to a 7% lift in the total number of home loans processed by AFG for the December quarter compared to the same lending period in 2014.

The figures were led by upward swings in Victoria of 17.69% and New South Wales at 12.23% with a surge in South Australia of 13.41%. These positive results offset a flat market in Queensland at 0.85%, and a decline in the Northern Territory -21.7%, in a comparatively smaller market. WA dipped, -9.55% reflecting a cooling housing market in that state.

AFG General Manager Sales and Operations Mark Hewitt said the final quarter of 2015 painted a fitting picture of the year that was. “2015 was a year of adjustment for both borrowers and lenders. A shift in requirements for lenders set down by regulators saw many changes to lending policy and interest rates resulting in a level of confusion amongst borrowers. This has made the role of the broker even more important for Australians looking to buy homes.

As foreshadowed by AFG’s Competition Index late last month, the number of people keen to fix their loans is on the rise. A long period of low interest rates has many people predicting an upward swing may be on its way in 2016.

As the year drew to a close fixed rate lending lifted by nearly 3% to 14.2% of the product mix. This figure, as a percentage of AFG’s overall volume saw its first increase since the final quarter of 2013.

How private equity won while other Dick Smith investors got burnt

From The Conversation.

The recent somewhat rapid demise of Dick Smith Holdings, resulting in its entry into voluntary receivership, is a stark reminder of the risks of investing in companies listed by private equity firms without doing careful research. Another example from the recent past is Myer, which has also never recovered anywhere near its original listing price.

Some commentators have blamed the demise on poor strategy, circumstances in the retail sector, or poor inventory management. But while investors in Dick Smith Holdings shares could end up with nothing, the private equity firm that acquired Dick Smith from Woolworths in 2012 has already recouped its cash investment several times.

How is this possible?

How did Anchorage Capital Partners manage to acquire Dick Smith from Woolworths in 2012 in a deal worth A$115 million and list it in the market for an equivalent total market value of A$520 million?

Private equity 101

Private equity firms typically represent informed investors such as high net worth individuals, or fund managers looking for higher returns through leveraged investments.

Typically a private equity firm will undertake a portfolio of highly leveraged investments in different sectors achieving a level of diversity but at a high risk the longer they stay in.

The firms have a very clear objective: identify businesses with potential for high returns based on their balance sheet, operating potential or capacity for leverage and for tax benefits but to exit as soon as objectives are achieved.

The objective is not to acquire a business with the objective of investing for the longer term, but purely with a view to exiting at a point where the return for risk relation is maximised.

Window dressing

This means that an exit is planned from day one to the extent return is not compromised. The long term prospects for the business are only of interest to the private equity firm to the extent that it helps dress the business for the market to help with the private equity firm’s exit. In the case of exit by listing this will typically involve changing and packaging the business so it is perceived as a more valuable investment by future investors. The packaging will typically involve all essential market positive aspects of the business, the balance sheet, capital structure and management.

If an acquired business is already listed, often they will de-list the firm, restructure and repackage it and then place in on the market through a stock exchange or sell it as going concern in part or whole in a sale. Often they will acquire divisions or segments of businesses within larger enterprises as was the case for Dick Smith.

Typically private equity deals are highly leveraged, namely there is much more debt than equity used to fund the acquisition, but once interest and debt is covered all returns go to shareholders, and initially this is the private equity firm. When a business is acquired by a private equity company, it is done through an entity or holding company (newco). Newco under private equity control, typically buys itself, in the sense that newco will own the acquired business but private equity controls newco.

Private equity will fund the acquisition of the business by a majority of debt within newco and not the private equity firm. The private equity firm and management will contribute the minimum equity required; this will depend on the financing arrangements which will be governed by newco’s balance sheet, the reputation of the private equity firm and management, and the appetite of the financial institutions for newco debt. Tax benefits will also be maximised to the extent that interest is tax deductible, a huge benefit given the degree of debt. Furthermore the tax paid on such gains is capital gain, taxed at a lower rate. Private equity firms will use very smart tax lawyers and accountants to structure the deal so that taxes paid will be well minimised.

The private equity firm and management will hold all the equity in newco, but with restrictions on managers in terms of selling their equity. Private equity firms will only accept restrictions on their selling down shares to the extent that it is a condition precedent for debt financing and they believe it maximises the price they can receive on exit so it doesn’t create the wrong impression.

Private equity firms will also earn returns by charging the acquired firm sometimes exorbitant management fees as well as by extracting returns from sale of the business in part or whole, and may even extract dividends, depending on financial covenants from lenders that are put in place at time of acquisition.

Private equity may plan to maintain a stake in the longer term, past their initial exit, to the extent it helps maximise the value received for their sold down stake and will be prepared to write off that continuing stake having already achieved their desired return.

This is what I suggest has already happened in the case of Dick Smith. Anchorage received a price of more than A$2 a share, liquidating the majority of its holding and in the process is also likely to have raised new equity to retire some of the debt, depending on the convenants in place. Regardless Anchorage will have made many times its intial investment at the listing of Dick Smith Holdings even after paying the upside to Woolworths if any requirement as part of the deal.

The losers will be those who are committed, management, shareholders, particularly those who held on since the Dick Smith Holdings listing and unsecured creditors with skin in the game vs Achorage which is simply involved. It’s like bacon and eggs, the hen is involved but the pig’s committed.

Author: John Vaz, Director of Education, Department of Banking and Finance, Monash University

Major Banks’ Shareholders Highly Leveraged; Profits $37bn, Up 10%

The recently released APRA quarterly banking performance statistics to September 2015 tells an interesting story. We have charted data for the major Australian banks which shows continued housing loan growth, and considerable lifts in the capital ratios in 2015.

However, looking directly at the ratio of gross advances to share capital (ignoring reserves and other factors), we still see the shareholders are highly leveraged, at 4.9% (up from a recent all-time low of 4.7% in June). This is a function of having an ever greater share of home loans in the portfolio, (with lower risk weights). It shows how reliant the banks are on expanding their mortgage books (so directly linked to rising house prices etc.).

Major-Banks-Financals-Sept-2015More broadly, looking at all the ADI’s, on a consolidated group basis, there were 159 firms operating in Australia. The net profit after tax for all ADIs was $37.0 billion for the year ending 30 September 2015. This is an increase of $3.5 billion (10.3 per cent) on the year ending 30 September 2014.

The return on equity for all ADIs was 14.1 per cent for the year ending 30 September 2015, compared to 14.2 per cent for the year ending 30 September 201.

The total assets for all ADIs was $4.58 trillion at 30 September 2015. This is an increase of $420.9 billion (10.1 per cent) on 30 September 2014.

The total gross loans and advances for all ADIs was $2.91 trillion as at 30 September 2015. This is an increase of $237.7 billion (8.9 per cent) on 30 September 2014.

The total capital ratio for all ADIs was 13.7 per cent at 30 September 2015, an increase from 12.4 per cent on 30 September 2014.

The common equity tier 1 ratio for all ADIs was 10.1 per cent at 30 September 2015, an increase from 9.2 per cent on 30 September 2014.

The risk-weighted assets (RWA) for all ADIs was $1.86 trillion at 30 September 2015, an increase of $157.0 billion (9.2 per cent) on 30 September 2014.

Impaired facilities and past due items as a proportion of gross loans and advances was 0.87 per cent at 30 September 2015, a decrease from 1.09 per cent at 30 September 2014. Specific provisions as a proportion of gross loans and advances was 0.22 per cent at 30 September 2015, a decrease from 0.28 per cent at 30 September 2014.

Suncorp Says Insurance Margins Impacted

Suncorp today reported that the increased cost of settling claims following last year’s record run of natural hazard events, combined with the lower Australian dollar, would impact the General Insurance margin for the half year to 31 December 2015.

Suncorp Group Chief Executive Officer (CEO) Michael Cameron said the Group had implemented a range of claims and pricing initiatives to take account of the increased volume and cost of claims. “While the industry remains very competitive, costs have been increasing as a result of the lower Australian dollar and the impact of the $4 billion of weather events during 2015. These increased costs will have a significant impact on the underlying margin in our Personal Insurance business,” he said. Personal Insurance CEO Gary Dransfield said a comprehensive program of work is underway to further improve claims processes.

“We are also working closely with our building panel and other suppliers to better manage costs,” he said.

In addition to the impact of working claims cost inflation in Personal Insurance, the underlying Insurance Trading Ratio (ITR) has also been impacted by:
• the $75 million increase in the natural hazards allowance which the Group had previously announced;
• higher than anticipated large loss experience in Commercial Insurance;
• increased claims frequency in Compulsory Third Party (CTP) insurance in NSW; and
• lower investment yields.

As a result, the underlying ITR is expected to be around 10% for the half year to 31 December 2015. The underlying ITR for the full year would be supported by increased claims management and pricing initiatives, as well as the Group’s Optimisation program which is on track to deliver $170 million of benefits in the 2018 financial year.

Commenting on the outlook for premium revenue, Mr Cameron said the Group was continuing to see the stabilisation of the Australian General Insurance pricing environment and increasing premiums had, to date, not had any material impact on retention rates.

As a result, the Group expects to report positive Gross Written Premium (GWP) growth for the six months to 31 December 2015. This compares to flat GWP growth and premium reductions across most portfolios during the 2015 financial year.

Mr Cameron said the Group’s reported profits would continue to benefit from releases from long-tail portfolios, which remain well above long-run expectations.

The continued absence of superimposed inflation and improvements in long-tail claims management are expected to result in prior year net reserve releases of between $120 million and $140 million or approximately 3% to 3.5% of Net Earned Premium for the six months to 31 December 2015. Mr Cameron said he had spent the first 10 weeks as CEO working with the team to gain a deeper understanding of all facets of the business, and meeting with employees, regulators, investors and others.

“The Group is in good shape other than the short-term operational challenges in General Insurance that we are highlighting today,” he said.

“I’m confident we can address these challenges and continue to drive changes that improve outcomes for our customers, shareholders and other key stakeholders.”

Suncorp’s detailed financial results for the six months to 31 December 2015 will be released on Thursday 11 February 2016. The Group’s interim dividend, based on the target payout ratio of 60% to 80% of cash earnings, will be announced on 11 February with an ex-dividend date of 18 February 2016 and a payment date of 1 April 2016.

CBA 1Q Results Shine

The Commonwealth Bank (“the Group”) today advised that its unaudited cash earnings for the three months ended 30 September 2015 (“the quarter”) were approximately $2.4 billion. Statutory net profit on an unaudited basis for the same period was approximately $2.3 billion, with non-cash items treated on a consistent basis to prior periods.

The cash profit was in line with expectations, margin was consistent (before the upside from recent repricing), losses were well controlled, and implied expenses were managed well.  Capital ratios have improved (though are slightly lower than expected) and funding remains strong.

Key outcomes for the quarter are summarised below:

  •  Income growth was similar to FY15. Underlying Group Net Interest Margin (excluding Treasury and Markets) was stable, whilst overall Group NIM was slightly lower largely due to higher liquid assets. Trading income was a little lower than the quarterly average of FY15, reflecting a slightly negative Derivative Valuation Adjustment in the quarter;
  • Across key markets, household deposits balance growth was strong and above system. Home lending continued to trend in line with recent growth rates, whilst core domestic business lending growth remained at mid-single digit levels (12 months rolling). In Wealth Management, FirstChoice and Custom Solutions achieved combined net flows of $0.9bn for the quarter, whilst FUA declined two percent on falling investment markets, partially offset by exchange rate movements and investment performance. ASB lending growth was solid;
  • Operating expense growth continued to reflect a combination of business growth and investment, ongoing regulatory and compliance costs and FX impacts;
  • Credit quality remained sound, with arrears levels reducing across all consumer portfolios in line with seasonal expectations. Troublesome and impaired assets reduced to $5.5 billion. Total loan impairment expense was $220 million in the quarter, with strong provisioning levels maintained and the economic overlay unchanged;
  • The Group’s Basel III Common Equity Tier 1 (CET1) APRA ratio increased 70 basis points to 9.8 per cent, driven by the proceeds of the Group’s entitlement offer and capital generated from earnings, partially offset by the impact of the June 2015 final dividend and higher risk weighted assets. The Group’s Basel III Internationally Comparable CET1 ratio as at 30 September 2015 was 13.6 per cent. The Group’s Leverage Ratio was 4.7 per cent at 30 September 2015 on an APRA basis and 5.3 per cent on an internationally comparable basis;
  • Funding and liquidity positions remained strong, with customer deposit funding at 63 per cent and the average tenor of the wholesale funding portfolio at 3.8 years. Liquid assets totalled $137 billion with the Liquidity Coverage Ratio (LCR) standing at 123 per cent.  The Group’s long term funding increased by $8.6 billion in the quarter.

Westpac FY15 Result Shows Growth Pressure Building

Westpac Group today announced statutory net profit for the 12 months to 30 September 2015 of $8,012 million, up 6% over the prior year.  The Group benefited from some one-off items, stable NIM, but lower non-interest income whilst credit quality improved. The the real challenge is finding future growth, in an environment where mortgage lending growth is likely to slow.

There were a number of significant infrequent items that in aggregate increased net profit. These included the partial sale of the Group’s shareholding in BT Investment Management Limited (BTIM) which generated an after tax gain of $665 million, several tax recoveries of $121 million, partially offset by higher technology expenses of $354 million (post-tax) following changes to accounting for technology investment spending and derivative valuation methodologies changes which resulted in an $85 million (post-tax) charge.

Net interest income of $14,239 million was up 6%, with net interest margin unchanged. It increased $725 million or 5% compared to Full Year 2014, with total loan growth of 7% and customer deposit growth of 4%. Net interest margin was stable at 2.09%, with lower Treasury income, reduced asset spreads and higher liquidity costs offset by reduced cost of funds from both deposit products and wholesale funding.

WBC-NIM-2015There was an 8 basis points decrease from asset spreads. The primary driver was increased competition in mortgages, with business, institutional and unsecured lending spreads also lower, offset by a 10 basis points benefit from customer deposit impacts, mostly from improved spreads on term deposits and savings accounts. Treasury and Markets contribution to the Group net interest margin decreased 2 basis points reflecting lower returns from the management of the liquids portfolio and balance sheet management in Treasury.

Non-interest income increased $980 million or 15% compared to Full Year 2014 primarily due to the gain associated with the sale of BTIM shares ($1,036 million). Excluding this item, non-interest income reduced $56 million or 1%, from lower trading income and lower insurance income reflecting higher insurance claims predominantly associated with severe weather events. Fees and commissions decreased $14 million, or 1%. Growth in business lending line fees and institutional fees were offset by seasonally lower Australian credit card point redemption income and promotional credit card point awards related to the launch of the Westpac New Zealand Airpoints loyalty program.

Operating expenses increased $926 million or 11% compared to Full Year 2014. This included $505 million related to changes to accounting for technology investment spending. Excluding this item, operating expenses increased $421 million or 5% primarily due to higher investment related costs, including increased software amortisation and foreign currency translation impacts.

Cash earnings of $7,820 million, up 3%, and cash return on equity (ROE) of 15.8%, down 57 basis points. Australian retail and business banking has been the key driver of performance, with Westpac RBB increasing cash earnings by 8% and St. George up by 7%. The New Zealand division also reported a 6% increase in cash earnings (in NZ$).

WBC-Cash-2015The Board increased the final dividend by 1 cps to 94 cps (compared to the interim 2015 dividend). This takes the total dividends for the year to 187cps, up 3% and represents a payout ratio of 75% of cash earnings.

Asset quality improved over the year with stressed exposures to total committed exposures falling 25bps reducing from 1.24% to 0.99%, while impairment charges rose 16%, at 12 basis points or $103 million compared to Full Year 2014. Direct write-offs were also higher. Total impairment provisions were $3,332 million with individually assessed provisions of $669 million and collectively assessed provisions of $2,663 million.

In the consumer sector, unsecured consumer delinquencies trended higher over Full Year 2015 as unemployment increased. Group consumer unsecured 90+ day delinquencies increased 8 basis points since 30 September 2014, but have fallen 10 basis points since 31 March 2015 (typically delinquencies fall in the second half of the year). In New Zealand delinquencies reduced further in Second Half 2015 to be 20 basis points lower than at 30 September 2014.

Australian 90+ day mortgage delinquencies were at 0.45% at 30 September 2015, 2 basis points lower than 30 September 2014 and 31 March 2015, as the portfolio continues to be supported by a strong property market and falling interest rates. The investment property segment has a 90+ day delinquency rate of 0.31% which is lower than the portfolio average. Despite low delinquencies, the modest pace of economic growth and rising
unemployment has led to some increase in delinquencies in those states and regions closest to mining and where there has been a structural shift in manufacturing. This is being offset by robust conditions in NSW where economic activity has been stronger.

Australian properties in possession decreased by 8 over Second Half 2015 to 255. Realised mortgage losses were $70 million for Full Year 2015, equivalent to 2 basis points of Australian housing loan balances.

New Zealand mortgage 90+ day delinquencies improved 7 basis points since 30 September 2014 to 0.14% at 30 September 2015. The low level of delinquencies reflects the improving economy and the strong Auckland housing market.

Westpac first raised around $2.0 billion in capital at its First Half 2015 results by partially underwriting the DRP. Capital was further increased by $0.5 billion following the partial sale of shares in BTIM. These two actions added $2.5 billion to the Group’s capital base and contributed to lifting Westpac’s CET1 capital ratio at 30 September 2015 to 9.5%, above the Group’s preferred range of 8.75% – 9.25%.

WBC-Equity-2015Allowing for the approximately $3.5 billion of ordinary equity expected to be raised through its recent renounceable entitlement offer, Westpac will be well within the top quartile of banks globally with a CET1 ratio of over 14% on an internationally comparable measure.

Looking at the segmentals, Westpac RBB’s focus on service and having Australia’s leading mobile/online capability for customers helped deliver both core and cash earnings growth of 8%. Record customer growth of over 191,000 helped drive loan and deposit growth up 6% and 7% respectively.

St. George Banking Group’s brands, St. George, BankSA, Bank of Melbourne and RAMS contributed to the 7% increase in cash earnings, with core earnings rising 8%. The Bank of Melbourne opened its 100th branch during the year and was voted best regional bank in Australia for the second time2. Revenue increased 7% with net interest income up 7% due to 8% growth in lending and a 3% rise in deposits.

BT Financial Group continues to be the leading wealth provider in Australia, ranking number 1 on all Platforms, with Funds under Administration (FUA) share of 19.9%. BTFG delivered flat cash earnings over the year with the result impacted by the partial sale of BTIM, lower performance fees, and higher insurance claims.

Westpac Institutional Bank is the number one institutional banking franchise in Australia. Financial conditions have been challenging, with margins 15 basis points lower in line with global capital market conditions. This contributed to a 12% reduction in cash earnings to $1,286 million. The decline was also due to methodology changes to derivative valuations (which reduced revenue by $122 million) and a lower impairment benefit. The business continued to achieve good underlying growth, with lending up 12% and customer revenue up 2%.

Westpac New Zealand delivered another solid result with a 7% increase in core earnings and a 6% increase in cash earnings (9% and 8% respectively in A$). The result was supported by revenue growth of 7% and good balance sheet growth, with a 7% rise in lending and a 5% increase in deposits.

Following changes to the Group’s technology and digital strategy, rapid changes in technology and evolving regulatory requirements, a number of accounting changes have been introduced, including moving to an accelerated amortisation methodology for most existing assets with a useful life of greater than three years, writing off the capitalised cost of regulatory program assets where the regulatory requirements have changed, and directly expensing more project costs. The expense recognised this year to reduce the carrying value of impacted assets has been treated as a cash earnings adjustment given its size and that it does not reflect ongoing operations.

Macquarie First Half 16 Results Strong

Macquarie Group announced a net profit after tax attributable to ordinary shareholders of $A1,070 million for the half-year ended 30 September 2015 (1H16), up 58 percent on the half-year ended 30 September 2014 (1H15) and up 16 percent on the half-year ended 31 March 2015 (2H15). Net operating income of $A5.3 billion for 1H16 increased 24 percent on 1H15, while total operating expenses of $A3.7 billion for 1H16 increased 17 percent on 1H15. Return on equity was 15.8%.

Macquarie’s annuity-style businesses (Macquarie Asset Management (MAM), Corporate and Asset Finance (CAF) and Banking and Financial Services (BFS)) continued to perform well, with 1H16 combined net profit contribution up 38 percent on 1H15. Macquarie’s capital markets facing businesses (Macquarie Securities (MSG), Macquarie Capital and Commodities and Financial Markets (CFM)) continued to improve with combined net profit contribution up 66 percent on 1H15.

Net operating income of $A5.3 billion in 1H16 was up 24 percent on 1H15 and up seven percent on 2H15, while operating expenses of $A3.7 billion were up 17 percent on 1H15 and up three percent on 2H15.

International income accounted for 71 percent of the Group’s total income for 1H16. A 10 percent movement4 in the Australian dollar is estimated to have approximately seven percent impact on full year net profit. Given currency movements, Macquarie estimates approximately a quarter of the increase in 1H16 net profit on 1H15 is attributable to foreign exchange.

The effective tax rate of 33.1 percent was down from 38.9 percent in 1H15 and down on the full year ended 31 March 2015 (FY15).

Macquarie’s assets under management (AUM) at 30 September 2015 were $A504 billion, up four percent on 31 March 2015.

Key drivers of the change from the prior corresponding period were:

  • A 38 percent increase in combined net interest and trading income to $A2.3 billion, up from $A1.6 billion in 1H15, with key drivers being improved trading opportunities in MSG driven by increased market volatility, increased client activity across most of the CFM platforms as a result of price volatility, the accretion of interest income on loans acquired at a discount and the favourable impact of the depreciation of the Australian dollar, partially offset by increased funding costs associated with growth of the operating lease portfolio in CAF and strong volume growth in Australian mortgages, business lending and deposits in BFS.
  • A 29 percent increase in fee and commission income to $A2.8 billion, up from $A2.2 billion in 1H15, primarily driven by a significant increase in MAM performance fees; an increase in MAM base fees, largely due to higher AUM that benefited from favourable currency and market movements, fund raisings and investments in Macquarie Infrastructure and Real Assets (MIRA), together with net flows into higher fee margin products in Macquarie Investment Management (MIM); increased mergers and acquisitions, advisory and underwriting fees in Macquarie Capital; as well as increased brokerage and commissions income in MSG.
  • A 31 percent decrease in other operating income and charges to $A0.3 billion, down from $A0.5 billion in 1H15, due to an increase in impairment charges and collective provisions particularly in CFM and Macquarie Capital, partially offset by an increase in net operating lease income in CAF.
  • A 17 percent increase in total operating expenses, driven by higher employment expenses primarily due to higher staff compensation resulting from the improved performance of the Group, increased brokerage, commission and trading-related expenses driven by increased trading-related activity in MSG, higher non-salary technology expenses due to ongoing investment in technology projects to support business growth, and an increase in other operating expenses resulting from increased activity across Macquarie and the amortisation of capitalised technology costs. Overall operating expenses were also impacted by the depreciation of the Australian dollar on offshore expenses.

Staff numbers were 13,582 at 30 September 2015, down from 14,085 at 31 March 2015.

Macquarie also announced today an interim dividend of $A1.60 per share, 40 percent franked, up from the 1H15 dividend of $A1.30 per share and down from the 2H15 dividend of $A2.00 per share, both 40 percent franked. This represents a payout ratio of 51 percent. The record date is 11 November 2015 and the payment date for the interim dividend is 16 December 2015.

While the impact of future market conditions makes forecasting difficult, it is currently expected that the combined net profit contribution from operating groups for the year ending 31 March 2016 (FY16) will be up on FY15.

The income tax expense for 1H16 was $A530 million, up 23 percent from $A432 million in the prior corresponding period. The effective tax rate of 33.1 percent was down on FY15. 

Total customer deposits increased 7.8 percent from 31 March 2015 to $A42.8 billion at 30 September 2015. During 1H16, $A10.3 billion of term funding was raised covering a range of sources, tenors, currencies and product types as well as $A4.0 billion raised as an AWAS Aviation Capital Limited (AWAS) acquisition debt facility. 

During 1H16, Macquarie completed the on-market purchase of shares to satisfy the FY15 Macquarie Group Employee Retained Equity Plan (MEREP) requirements of $A383 million at a weighted average price of $A80.68.

In October 2015, the Group issued $A0.4 billion in equity via an Institutional Placement (Placement) to provide capital for the acquisition of the Esanda dealer finance portfolio from ANZ Banking Group. An associated Share Purchase Plan (SPP) will be offered to eligible shareholders in Australia and New Zealand from 2 November 2015, who can apply for shares with a dollar value of up to $A10,000. If eligible shareholders participated in the March 2015 SPP, the maximum value of shares allocated from both the March 2015 SPP and this offer is limited to $A15,000. The record date for participation in the SPP was 7 October 2015 (the day prior to the launch of the Placement).

SPP Shares will not be eligible for the 1H16 dividend, however the offer price will be adjusted to reflect this. SPP shares will be offered at the lower of:

–      $A78.40 representing the issue price paid under the Placement ($A80.00) less the 1H16 dividend ($A1.60); and

–      a 1.0 percent discount to the volume weighted average price of shares traded during the pricing period7.

Macquarie intends to redeem the Preferred Membership Interests $US400m hybrid in December 2015 and expects to replace these in due course.

Macquarie Group remains very well capitalised with APRA Basel III Group capital of $A16.9 billion at 30 September 2015, a $A3.1 billion surplus to Macquarie’s minimum regulatory capital requirement from 1 January 2016. The Bank Group APRA Basel III Common Equity Tier 1 capital ratio was 9.9 percent at 30 September 2015, which was up from 9.7 percent at 31 March 2015.

Macquarrie-CapitalIn August 2014, APRA issued its final rules for Conglomerates with implementation timing yet to be announced. Macquarie continues to work through the application of the rules with APRA and the current assessment remains that Macquarie has sufficient capital to meet the minimum APRA capital requirements for Conglomerates.

The government released its response to the Financial System Inquiry on 20 October 2015, agreeing with the majority of the recommendations and setting a timetable for their implementation. The government endorsed APRA to implement most of the resilience recommendations and so the final design of any policy changes has yet to be determined.

Based on finalised BCBS leverage ratio requirements9 released in January 2014, the Bank Group is well in excess of the currently proposed Basel III 3.0 percent minimum10, with a 6.0 percent leverage ratio as at 30 September 2015. APRA’s ‘super equivalence’ in relation to the definition of capital carries over to the leverage ratio. On an APRA basis, the Bank Group’s leverage ratio is 5.1 percent as at 30 September 2015.

Liquidity Coverage Ratio (LCR) requirements came into effect from 1 January 2015, with disclosure required from 1 July 2015. For the quarter ended September 2015 the Bank Group’s average LCR was 170 percent11.

Operating Group performance:

  • Macquarie Asset Management (MAM) net profit contribution of $A1,139 million for 1H16 increased 45 percent from $A785 million in 1H15. MAM’s base fee income of $A784 million for 1H16 increased 22 percent from $A641 million in 1H15, largely due to increased AUM that benefited from favourable currency and market movements, fund raisings and investments in MIRA, together with net flows into higher fee margin products in MIM. Performance fees of $A609 million for 1H16 increased significantly from $A373 million in 1H15, including performance fees from Macquarie Infrastructure Corporation (MIC) and Macquarie European Infrastructure Fund 1 (MEIF1), as well as performance fee income from co-investors in respect of a UK asset.
  • Corporate and Asset Finance (CAF) net profit contribution of $A611 million for 1H16 increased 31 percent from $A468 million in 1H15. The improved result was largely driven by the favourable impact of the depreciation of the Australian dollar, the accretion of interest income on loans acquired at a discount in the Lending portfolio and increased net operating lease income mainly due to the contribution of aircraft acquired to date from AWAS. CAF’s asset and loan portfolio increased 13 percent from $A28.7 billion at 31 March 2015 to $A32.3 billion at 30 September 2015 mainly driven by the impact of the depreciation of the Australian dollar, the acquisition of aircraft during the period as well as and the acquisition of Advantage Funding in July 2015.
  • Banking and Financial Services (BFS) net profit contribution of $A170 million for 1H16 increased 21 percent from $A141 million in 1H15. In 1H16, BFS benefited from strong volume growth in Australian mortgages, business lending and deposits partially offset by increased investment in technology projects to support growth in the business, including the development of a new Core Banking system. The Australian mortgage portfolio increased to $A27.6 billion, up 13 percent on 31 March 2015, representing approximately 1.8 percent of the Australian mortgage market. Macquarie platform assets under administration were broadly in line with 31 March 2015 at $A46.7 billion.
  • Macquarie Securities Group (MSG) net profit contribution of $A240 million for 1H16 increased significantly from $A17 million in 1H15. MSG benefited from improved market and trading conditions in Australia and Asia due to increased market volatility, particularly in China, driving strong growth in trading-related income as well as increased brokerage and commissions income. Income growth was partly offset by increased operating expenses relative to 1H15 driven by the depreciation of the Australian dollar.
  • Macquarie Capital net profit contribution of $A170 million for 1H16 increased 13 percent from $A150 million in 1H15 predominately due to increased mergers and acquisitions fee revenue, particularly in Australia and the US, partially offset by increased impairment charges relating to certain underperforming principal investments. During 1H16, Macquarie Capital advised on 208 transactions valued at $A116b including acting as joint lead manager and joint underwriter on National Australia Bank’s $A5.5b accelerated renounceable entitlement offer and financial adviser, debt and equity arranger to Freeport LNG on its $US4.6b project financing of Train 3 of its Liquefaction and Export Project.
  • Commodities and Financial Markets (CFM) net profit contribution for 1H16 was $A282 million, an increase of 13 percent from $A250 million in 1H15. This result reflected improved returns across the commodities trading platform and the favourable impact of the depreciation in the Australian dollar while income from credit, interest rates and foreign exchange markets remained flat compared with 1H15. These were partially offset by higher provisions for impairments taken on certain underperforming commodity related loans.

ANZ 2015 Full Year Results Mixed Bag

ANZ has announced a statutory profit after tax of $7.5 billion up 3% and a cash profit of $7.2 billion up 1%. The second half profit was down on expectations. On a cash profit basis, income was $14.6 bn, up 4.8% on FY14, and expenses were $9,4bn, up 6.8% on FY14. In the second half of the year, revenue grew only 1.5% whilst expenses lifted 3.8%, and 2H provisions were also higher. Customer deposits grew 10% with net loans and advances up 9%. Return on Equity (RoE) was 14.0%. Overall net interest income grew 5.9%, (a mix of rising volumes +9.3%, and falling NIM -4.2%). Group net interest margin fell 2H14 of 212 basis points to 204 basis points, thanks to loan discounting and FX impacts, despite higher returns from deposits and improved funding mix. However, NIM was more stable in the second half.

ANZ-NIM-2015Gross impaired assets decreased 6% over the course of the year. While the total provision charge increased to $1.2 billion or 22 bps, loss rates remain well under the long term average having risen from their historically low levels. However, second half provisions were higher. The individual provision charge declined $34 million and while the collective provision charge increased it remained low in absolute terms at $95 million compared to a net release the prior year.  During FY15 the movement in the risk profile component of the charge reflected moderating economic activity with a lower number of credit downgrades being recorded whereas the prior year saw a higher level of upgrades.

ANZ-Provisons-2015Final Dividend 95 cents per share (cps) fully franked. Total Dividend for the year 181 cps up 2%. Earnings per share was flat at 260.3 cents, reflecting increased shares on issue following the capital raising in the second half.

At the end of FY15 the Group’s APRA CET1 ratio was 9.6%, up 87 basis points (bps) from March 2015. On an Internationally Comparable basis the CET1 ratio was 13.2%, placing ANZ within the top quartile of international peer banks. The completion of the sale of the Esanda Dealer Finance portfolio will deliver a further 20 bps of CET1.

ANZ-Capital-2015ANZ raised a total of $4.4 billion of new equity throughout the past year, including $3.2 billion in response to APRA’s increased capital requirement for Australian residential mortgages which applies from July 2016. ANZ expects the APRA CET1 ratio to remain around 9% post implementing the mortgage RWA change next year. The Group continues to retain significant capital management flexibility to progressively adjust to further changes in regulatory capital requirements if required.

Segmentals

The Australia Division continued its trend of cash profit improvement with profit and PBP growth of 7%. The result was driven by growth in customer numbers (to 5.3 million)  along with increased product sales and market share. Cash profit rose 7.2% and impaired assets fell from 0.43% in 2014 to 0.38% in 2015. However NIM fell 2 basis points.  Investment focused on digital platform enhancement, increasing distribution sales capacity and capability, growing presence in particular in New South Wales (NSW), a high growth market where ANZ has historically been underweight, and building out specialist propositions in key sectors of Corporate and Commercial Banking (C&CB). Lending grew 9% with deposits up 5%. Sales performance has been strong, particularly in Home Lending, Credit Cards and Small Business Banking. ANZ has grown home lending market share consistently now for six years driven by capability and capacity improvements in branches, online, in ANZ’s mobile lender team and improved broker servicing. Home loans went from $209bn in 2014 to $231 in 2015.

ANZ-HomeLoans-2015

ANZ-OZ-Delinquencies-2015Excluding non=performing loans, home loan delinquencies 90day+ sit at 0.63%, with higher rates in QLD and WA.

ANZ’s C&CB business grew lending by 6% despite patchy sentiment in the Commercial sector, with Small Business Banking performing particularly strongly, up 12%. Increased specialist capability saw lending to the Health sector up 16% in the second half. ANZ has seen strong commercial outcomes from its investment in digital capability with increased numbers of customers engaging with the business via digital channels. In FY15 sales via digital channels grew 30%, new to bank goMoney customers grew 89% and product purchases on mobile devices increased 121%.

International and Institutional Banking cash profit declined 1.6% from $2.7 bn in 2014 to $2.66 bn in 2015. NIM fell from 1.5% in 2014 to 1.34% in 2015. While it has been a challenging year for the business they continued to develop the customer franchises in Asia, New Zealand and Australia with particularly good outcomes in Asia. Customer sales in higher returning products demonstrated good growth with cash deposits up 11%, commodities sales up 44% and rates sales up 32%. Global Markets customer income continued a pattern of steady year on year (YOY) increases, up 7%. Despite a strong performance over the nine months to the end of the third quarter, changed financial market conditions in the last six weeks of the fourth quarter caused significant dislocation and a widening of credit spreads, which particularly impacted trading income as well as suppressing sales. This meant total Global Markets income finished the year down 2%. A multi-year investment in the high returning Transaction Banking Cash Management capability has seen Cash Management deposits up 48% over the past three years. Similarly investment in Global Markets product, technology and customer sales capability has driven good outcomes with Foreign Exchange income up 24% over the past three years to represent 42% of the book. IIB has been refining key business areas. Reduced exposure to some lower returning areas of the Trade business, while lowering Trade income slightly, has improved returns. In the Global Loans business, increased focus on RWA efficiency over the course of the second half saw profit decline but margins and returns on RWA begin to stabilise.

New Zealand Division cash profit grew 3% with PBP up 7%. NIM fell 1 basis point in the year. Ongoing business momentum is reflected in balance sheet growth which along with capital and cost discipline (costs +2%) has grown returns. While underlying credit quality remains robust and gross impaired assets continued to decline from 0.61% in 2014 to 0.35% in 2015, a lower level of provision write-backs YOY saw the provision charge normalising although remaining modest at $59 million. Lending grew 8% with deposits up 14%. Brand consideration remains the best of the top four banks, strengthening further. In turn, this is translating into lending demand with ANZ now the largest mortgage lender across all major cities. ANZ has grown market share in key categories during the year including mortgages, credit cards, household deposits, life insurance, KiwiSaver and business lending. The Commercial business grew strongly across all regions with lending up 8%. ANZ increased investment in digital and in sales capability. Sales revenue generated from digital channels increased 32%. A focus on delivering a great digital experience for customers has seen ANZ’s mobile banking app ‘goMoney’ consistently scoring above 98% in customer satisfaction and, with over half a million customers, it is the most downloaded banking app in New Zealand.

The Global Wealth Division increased profit by 11%. Positive performance was experienced across all business units. Insurance delivered growth in in-force premiums along with stable claims and lapse experience, which contributed to an 18% increase in both embedded value and in the value of new business. Private Wealth continued to deliver growth through customer focused investment solutions – with FUM increasing 22% and customer deposits 33% YOY. Global Wealth continues to reshape the customer experience through new digital solutions. Recent innovations include ‘Advice on Grow™’, new tools improving the advice experience, while ‘Insurance on Grow™’ will soon be released to the market. ANZ Smart Choice Super leads the industry in value for money and innovation. FUM now exceeds $4.3 billion and for the second year ANZ Smart Choice received the prestigious Super Ratings Fastest Mover award. ANZ KiwiSaver continues to build its market position with FUM growing 32% to A$7 billion. Global Wealth’s focus on improving customer experience is reflected in the increased sale of Wealth solutions through ANZ channels with growth of 8% YOY.

Overall contribution by region shows how reliant ANZ is on Australian net income.

Income-By-Type-ANZ-2015Finally there was a clear emphasis on their strategy to drive digital channels, with considerable volume growth and focus, as well as efficiency. FTE declined 3%.

ANZ-Digital-2015

NAB Full Year Results to 30 Sept 2015 Below Expectations

NAB released their full year results today, which were below expectation, thanks to specific provisions to cover UK issues, lower net margin, and exchange rate movements. This despite a reduction in bad debt provisions by 14 basis points. The final dividend is 99 cents per share (cps) fully franked, unchanged from the 2015 interim and 2014 final dividends. This is a return on capital employed of 13.8%, which is 5% lower than CBA, the most profitable Australian bank.

However, once NAB gets rid of their UK problems, and focusses on the local market, it has the potential to leverage its franchise and up the ante. By tackling the capital issues aggressively, it has laid strong foundations.

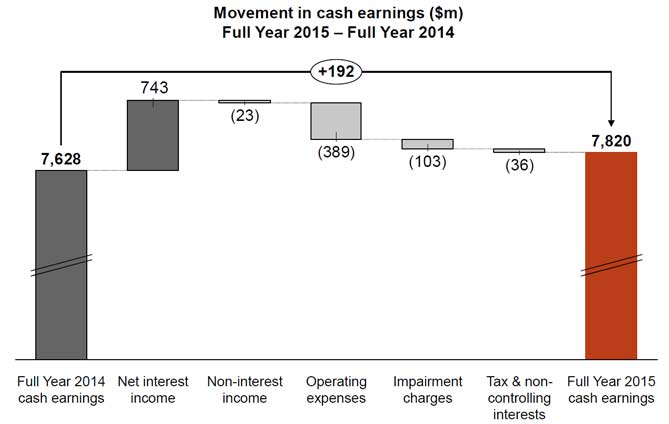
Cash earnings were $5.84 billion, an increase of $0.78 billion or 15.5%. Analysts were expecting more than $6.2bn. In 2013 they reported a record $5.94bn. There are a large number of moving parts in the Group.

Excluding specified items, the increase was 2.4% over the year and 2.8% compared to the March 2015 half year. On a statutory basis, net profit attributable to the owners of the Company was $6.34 billion, an increase of $1.04 billion or 19.7%. Excluding discontinued operations, statutory net profit increased 22.7% to $6.36 billion. The main difference between statutory and cash earnings over the year relates to the effects of fair value and hedge ineffectiveness.

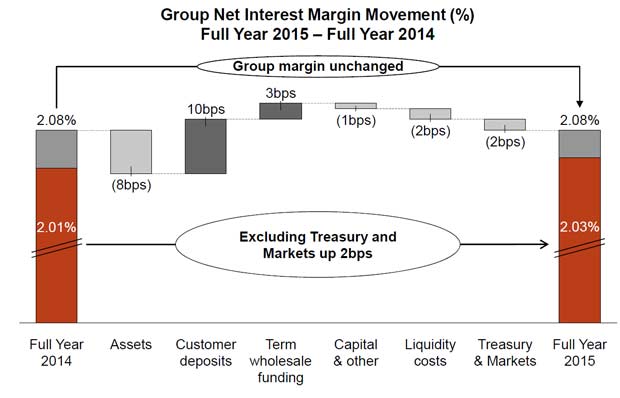
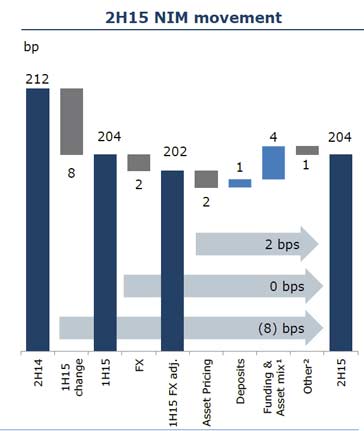
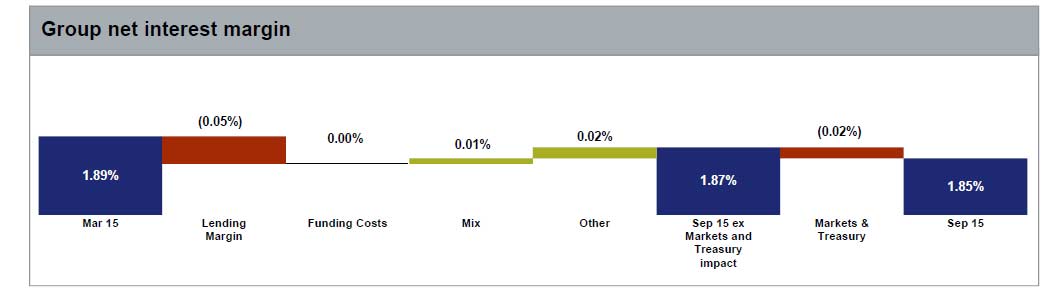
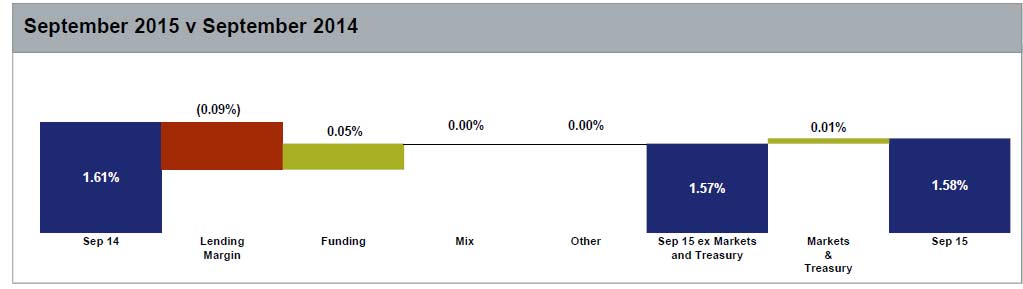
Revenue increased approximately 4%. Excluding gains from a legal settlement and the UK Commercial Real Estate loan portfolio sale and SGA asset sales, revenue rose approximately 3%, benefitting from higher lending balances, stronger Markets and Treasury income, increased NAB Wealth net income, and the impact of foreign exchange rates. Group net interest margin (NIM) declined 4 basis points, mainly due to competition for business lending.

Group-Interest-Margin-NAB-2015Expenses fell approximately 1%, but excluding specified items and foreign exchange rate impacts rose approximately 4%. Key drivers include investment in the Group’s priority customer segments, increased technology costs, higher UK spend associated with preparing for separation, combined with wage increases.

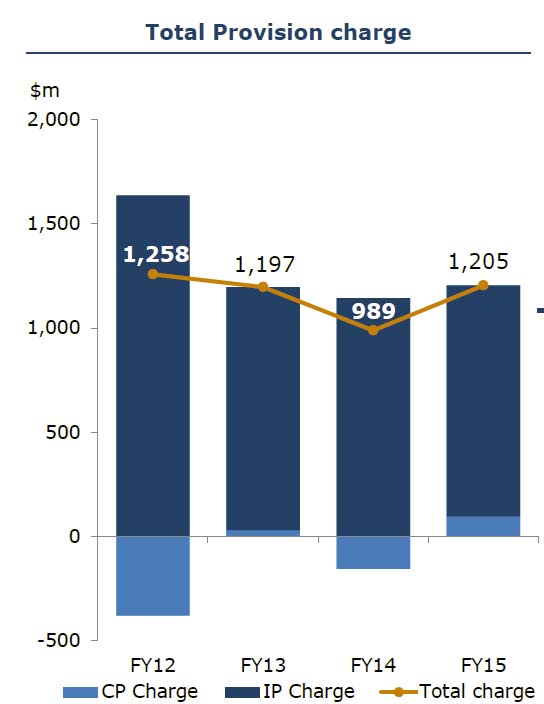
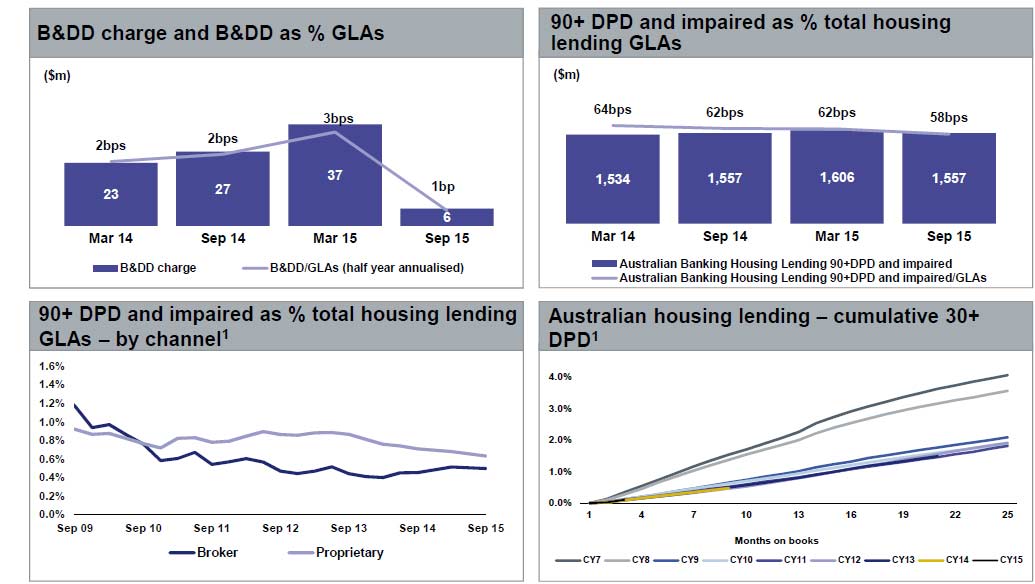
Improved asset quality resulted in a total charge for Bad and Doubtful Debts (B&DDs) of $823 million, down approximately 5% due to lower charges in Australian Banking and UK Banking. The charge includes a collective provision overlay of $102 million for Australian agriculture and resource sectors, and an increase in New Zealand collective provision charges of NZ$78 million predominantly relating to the dairy sector.

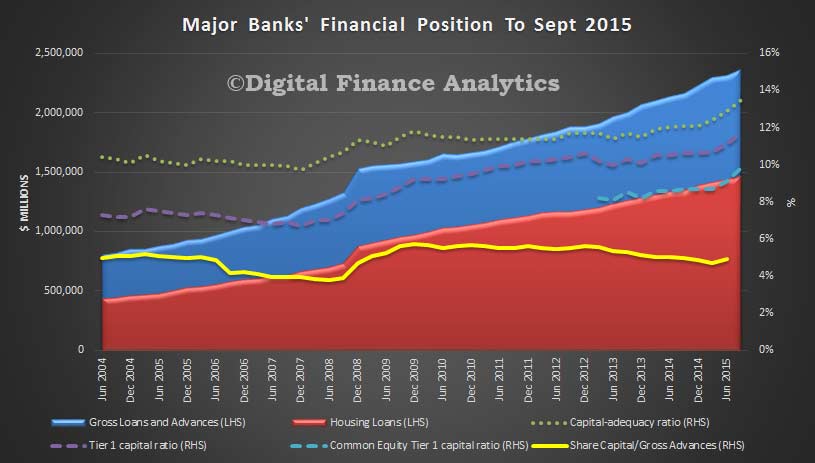
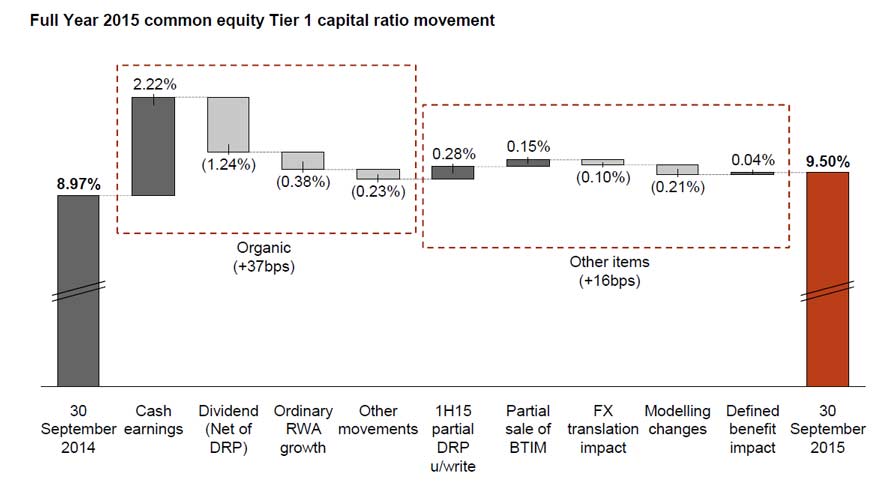
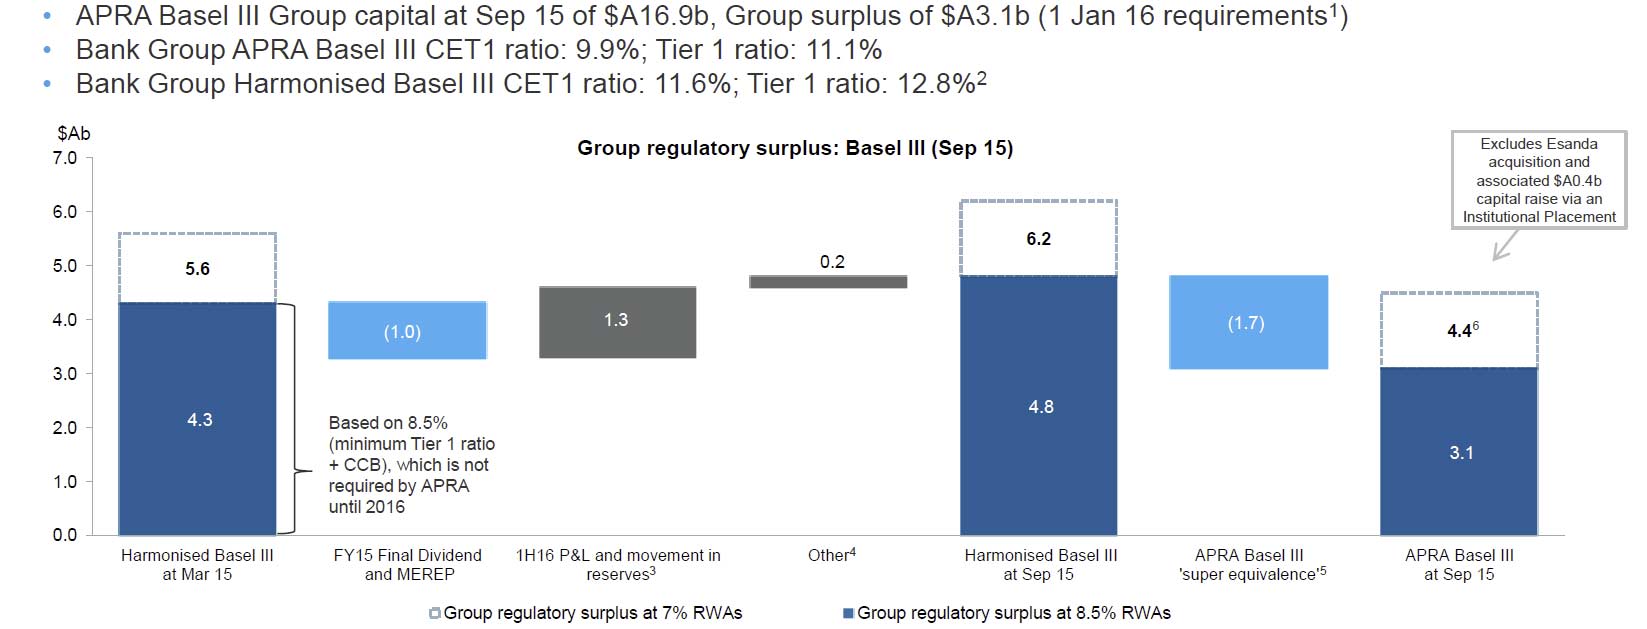
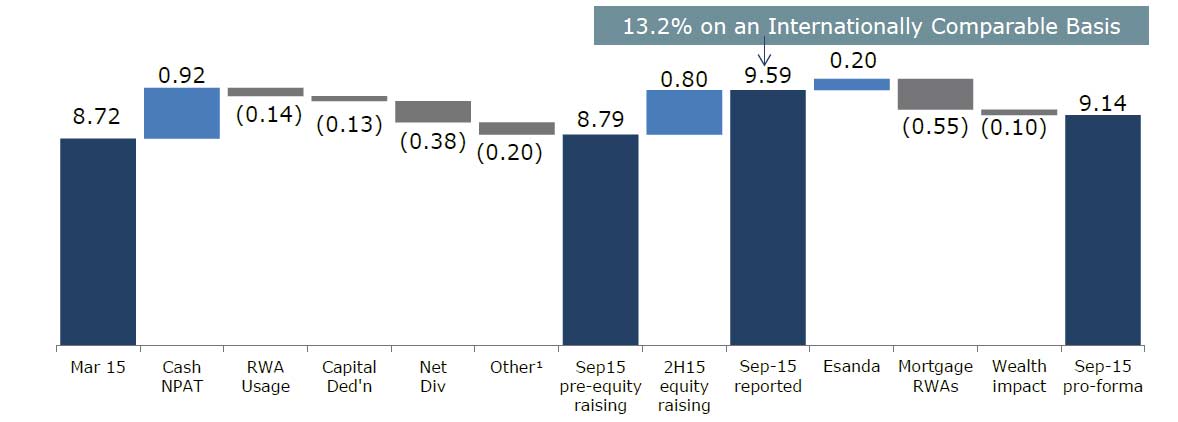
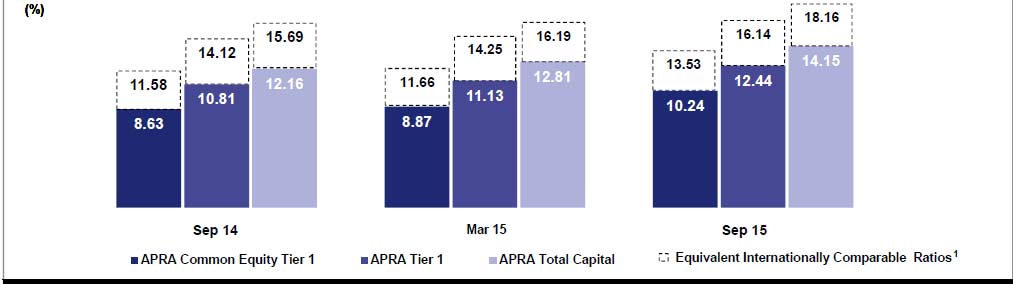
The Group’s Common Equity Tier 1 (CET1) ratio was 10.2% as at 30 September 2015, an increase of 137 basis points from March 2015 mainly reflecting the rights issue proceeds. The Group’s CET1 target ratio remains between 8.75% – 9.25%, based on current regulatory requirements. The CET1 ratio at 30 September 2015 is above the target range reflecting regulatory increases in mortgage risk weights from 2016 and the intended UK demerger.

The impact of recent capital raisings on the capital ratios are clear. The bank is now well positioned, and one of the strongest positioned in the world.

Basel-III-Capital-Ratios-NABThe Group maintains a well diversified funding profile and has raised approximately $26.5 billion of term wholesale funding in the 2015 financial year. The weighted average term to maturity of the funds raised by the Group over the 2015 financial year was 4.7 years. The stable funding index was 92.3% at 30 September 2015, 1.9 percentage points higher than at 30 September 2014. The Group’s quarterly average liquidity coverage ratio as at 30 September 2015 was 115%.

Sale of Life Insurance Business

NAB announced an agreement to sell 80% of NAB Wealth’s life insurance business to Japanese insurer Nippon Life Insurance Company (Nippon Life) for $2.4 billion. This transaction is separate and in addition to the life reinsurance transaction finalised in July 2015. As part of the partnership NAB will enter a 20 year distribution agreement to provide life insurance products through its owned and aligned distribution networks.

NAB will retain existing ownership of its investments business which includes superannuation, platforms, advice and asset management. The transaction will occur through the sale of 80% of MLC Limited after the extraction of NAB’s superannuation and investments business and certain other restructuring steps. NAB will retain the MLC brand, although it will be licensed for use by the life insurance business for 10 years, and will continue to be applied as is currently the case in our superannuation, investments and advice business. The transaction is expected to be completed by the second half of calendar 2016 subject to certain conditions including regulatory approvals, establishment of the life insurance business as a standalone entity, extraction of the superannuation business from MLC Limited and the finalisation of certain agreements. NAB will retain responsibility for managing the life insurance business until completion.

The transaction is expected to result in an indicative loss on sale of approximately $1.1 billion inclusive of transaction and separation costs, based on expected completion life insurance net assets of $3.6 billion including $1.6 billion of allocated goodwill. In addition, NAB’s pro forma FY15 CET1 ratio is expected to increase by approximately 50 basis points after allowing for transaction and separation costs, with this increased capital expected to be retained by NAB to meet potential increased regulatory capital requirements. One off post-tax costs of approximately $440 million are expected to be incurred by NAB relating to separation, and the extraction and simplification of the superannuation business.

UK Demerger

The Group has announced its intention to divest CYBG PLC (CYBG), through a demerger and Initial Public Offering (IPO), in early February 2016. Significant progress has been made on the proposed transaction, including advanced engagement with key regulators and listing authorities in both jurisdictions.

The Group’s intention is to pursue a demerger of approximately 75% of CYBG to NAB shareholders and a sale of the balance by way of IPO (up to approximately 25%) to institutional investors. It is proposed that CYBG will have a primary listing on the London Stock Exchange (LSE) and a CHESS Depositary Interest (CDI) listing on the Australian Securities Exchange (ASX).

The proposed demerger and IPO remains subject to a range of matters, including various court and regulatory approvals and NAB shareholder approval. Shareholder approval will be sought at a meeting expected to be in late January 2016.

As announced at the third quarter trading update on 10 August 2015, additional conduct provisions were expected to be required at the Full Year 2015 results in relation to both payment protection insurance (PPI) and interest rate hedging product (IRHP) costs.

These additional provisions have now been determined and comprise the following:

  • Provisions of £390 million (£323 million or A$704 million after tax) in relation to PPI reflecting the impact of the past business review and the consequent need to undertake further proactive customer contact, as well as costs to run the remediation program
  • Provisions of £75 million (£63 million or A$135 million after tax) in relation to interest rate hedging products and fixed rate tailored business loans based on additional expected claims

As announced at the March 2015 Half Year results, in order to achieve the proposed CYBG demerger and IPO the UK PRA requires capital support for CYBG of £1.7 billion in relation to potential future legacy conduct costs. The provisions of £465 million recognised in the September 2015 half year will form part of the £1.7 billion support package and, combined with £120 million for CYBG’s share of future conduct liabilities, will result in a capped indemnity from NAB of £1.115 billion upon separation. Assuming no further pre-demerger provisions are raised, future legacy conduct costs will be shared 90.3%/9.7% between NAB and CYBG respectively.

On completion of the demerger, the capped indemnity amount of £1.115 billion is expected to result in a deduction from NAB’s CET1. To the extent that claims against NAB under the capped indemnity are ultimately less than £1.115 billion, this is expected to result in a commensurate CET1 benefit for NAB.

Group asset quality metrics continued to improve over the period. The ratio of Group 90+ days past due and gross impaired assets to gross loans and acceptances of 0.71% at 30 September 2015 was 14 basis points lower compared to 31 March 2015 and 48 basis points lower compared to 30 September 2014.

The ratio of collective provision to credit risk weighted assets was 1.01% unchanged from 31 March 2015. The ratio of specific provisions to impaired assets was 32.7% at 30 September 2015 compared to 36.0% at 31 March 2015.

Segmentals

Australian Banking cash earnings were $5,111 million, an increase of 3% reflecting higher revenue and lower B&DD charges. Revenue rose 4% benefitting from stronger Markets and Treasury performance combined with higher volumes of housing and business lending while NIM declined 3 basis points as a result of lending competition. Expenses rose 6% or 5% excluding the impact of changes in foreign exchange rates, with investment in front line banker roles in priority customer segments combined with higher project costs, partly offset by productivity savings. Asset quality metrics continued to improve and B&DD charges of $665 million fell 10% over the year and 18% over the March 2015 half year. This largely reflects lower new impaired loans, and is despite higher collective provision charges including a $102 million overlay for the agriculture and resource sectors.

OZ-Bank-Margin-2015-NAB
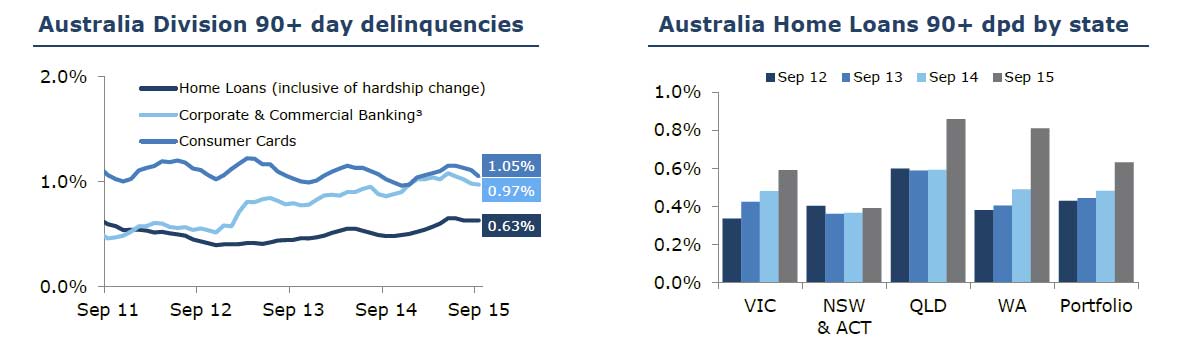
Looking at housing in particular, net margin is unchanged, and the impact of recent loan classifications are visible.

NAB-House-LendingLoss rates are down in September 2015.

Home-B&D-NAB-2015
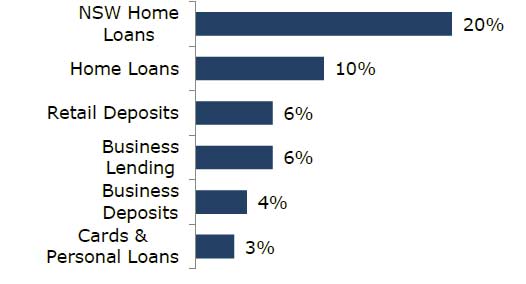
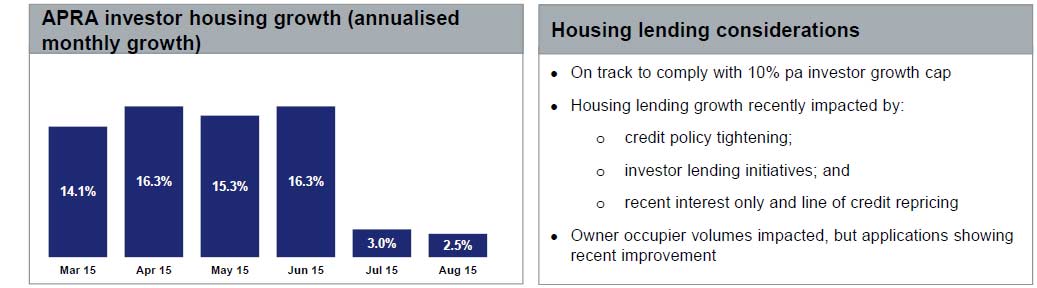
NAB says they will be within the 10% APRA speed limit for investment home loans.

APRA-Data-NAB-2015NAB Wealth cash earnings increased 27% to $464 million benefitting from stronger insurance income and stable costs. Net income rose 10% reflecting higher premium pricing, improved insurance lapses and claims, and non-recurrence of insurance reserve strengthening in the prior year. While funds under management rose 8% with strong investment markets and the acquisition of Orchard Street Investment Management in the March 2015 half year, this was offset by lower IoRE and lower investment margins mainly due to MySuper plan transitions and business mix changes.

NZ Banking local currency cash earnings of $823 million rose 2% over the year. Good underlying profit growth was partly offset by higher collective provision charges in the September 2015 half year predominantly relating to the dairy sector. Revenue rose 4% with improved lending volumes and higher margins. Cost growth was contained to 2%, while still investing in staff and technology to support the Auckland focused growth strategy.

UK Banking local currency cash earnings of £156 million were broadly flat. Mortgage volume growth and a halving of B&DD charges to £38 million reflecting asset quality improvements, were more than offset by higher costs particularly in the September 2015 half year, and lower margins. Costs rose 7% reflecting investment in the franchise and the impact of pre separation activities, which were partly offset by a one-off pension scheme gain.

NAB In Trading Halt

The securities of National Australia Bank Limited will be placed in Trading Halt Session State at the request of the Company, pending the release of an announcement by the Company.

The securities will remain in Trading Halt Session State until the commencement of normal trading on Thursday, 29 October 2015.

It will most likely be the sale of a non-core business, releasing capital, as part of NAB’s balance sheet build. Speculation is that it may related to the potential sale of NAB’s life insurance business.