
Category: Household Survey
Household Financial Confidence Slides [Again]
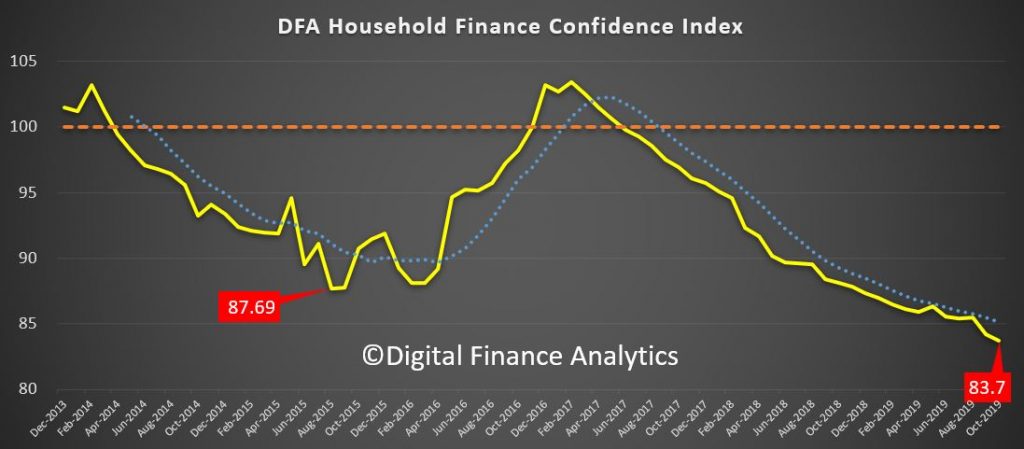
We continue to release the data from our household surveys to end November 2019. Today we look at our Household Financial Confidence Index, which examines how households are feeling about their financial status, relative to a year ago.
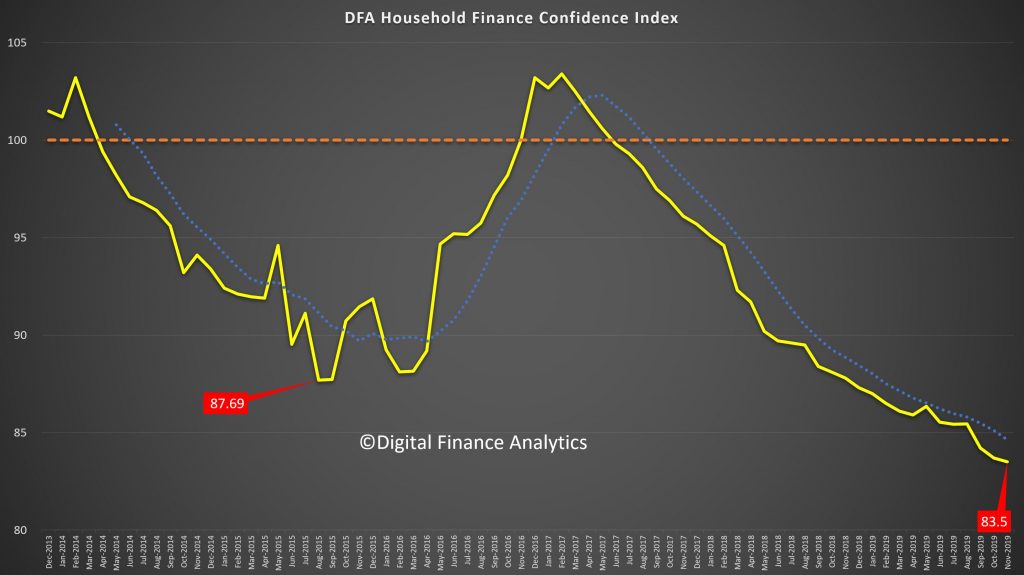
The index dropped again to 83.5, which is a new low in the series, and well below the previous 87.69 back in 2015. This level of concern suggests households will be keeping their wallets firmly in their pockets, so expect more retail weakness and household consumption easing lower ahead. The one “bright” spot was that more households are now believing their net worth is higher, thanks to the perceived recovery in home prices, and recent stock market highs, though offset by lower returns on deposits, flat incomes in real terms and rising costs. Recent rate cuts and tax refunds do not seem to have touched the sides!
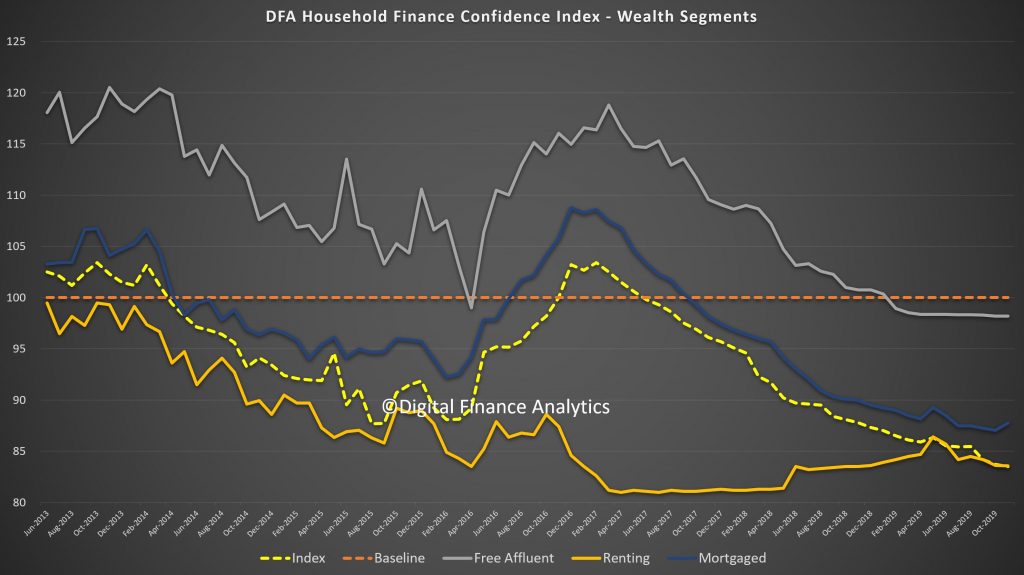
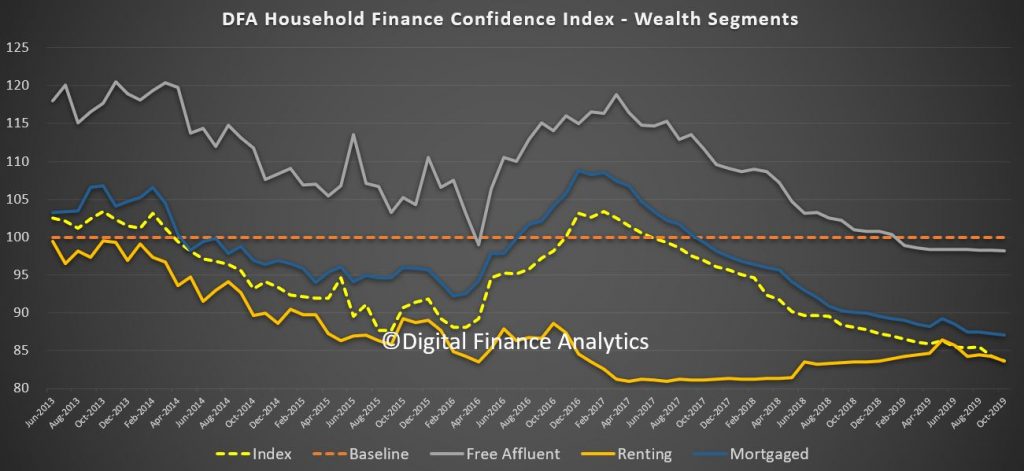
The declines in confidence are broad based, with those mortgage free still below neutral, while those with a mortgage still more negative, and those in the rental sector (without property) even more down than that.
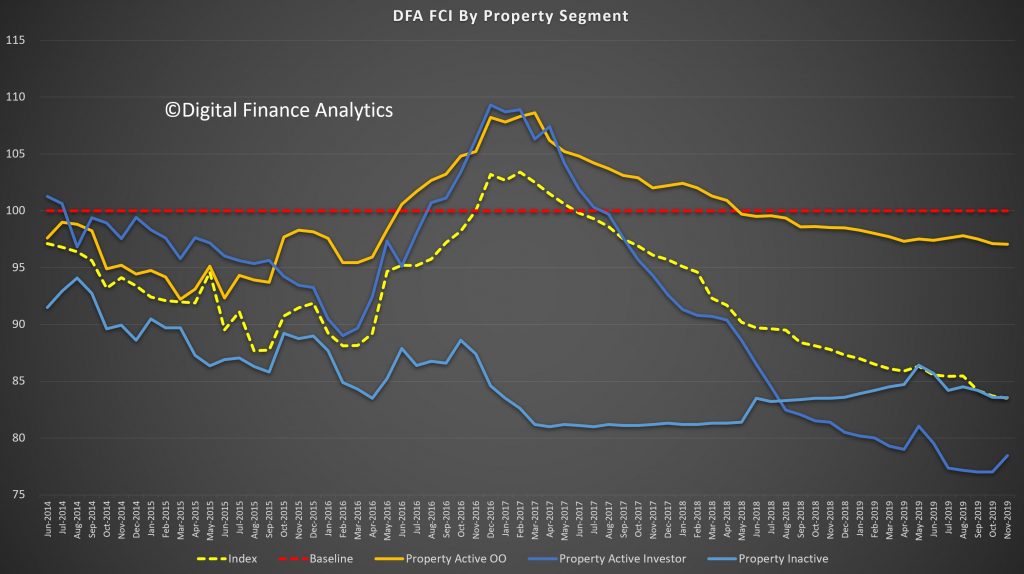
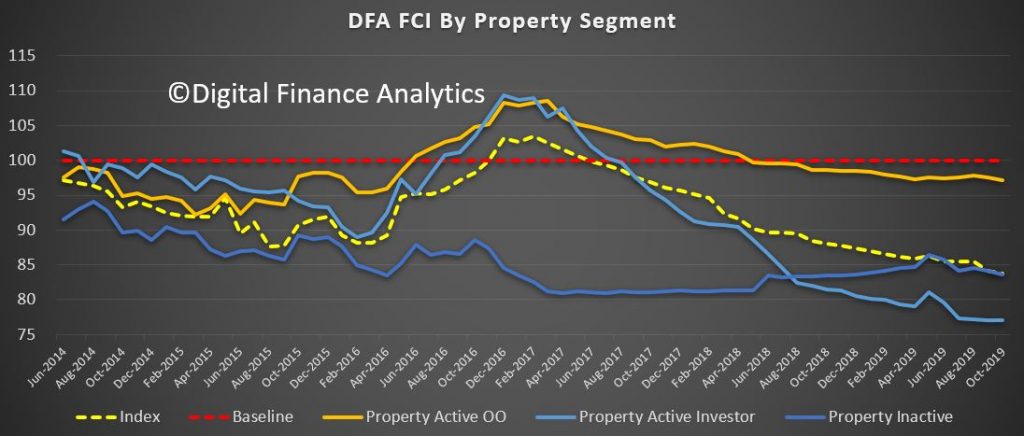
The news about rising home prices as impacted property investors, despite the continued weakness in rental income, thus we see a rise from very low levels for this cohort, from 77.01 to 78.45 in the month. On the other hand, property active owner occupied households were a little less positive, moving from 97.1 to 97.05. Property inactive households also drifted lower.
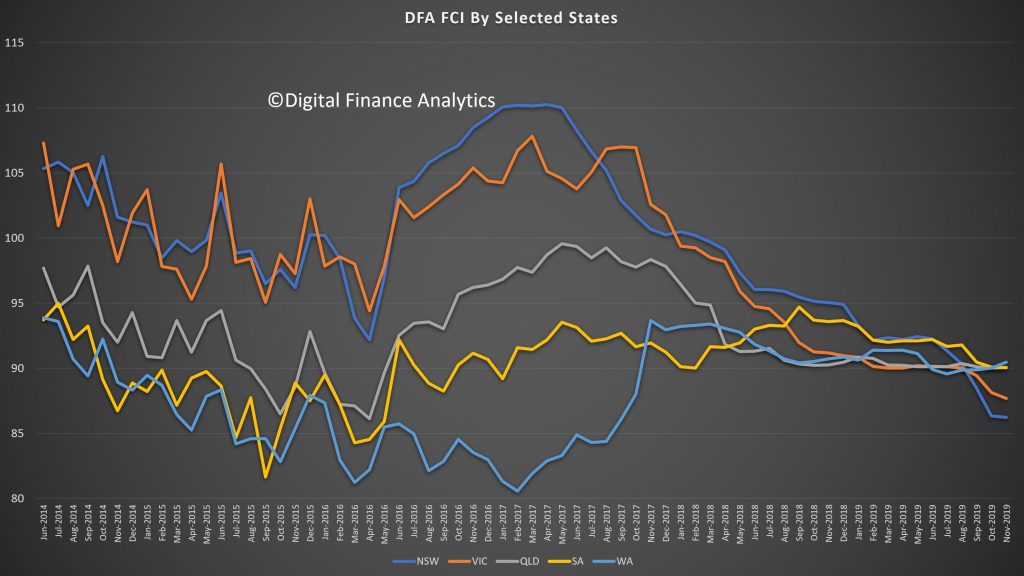
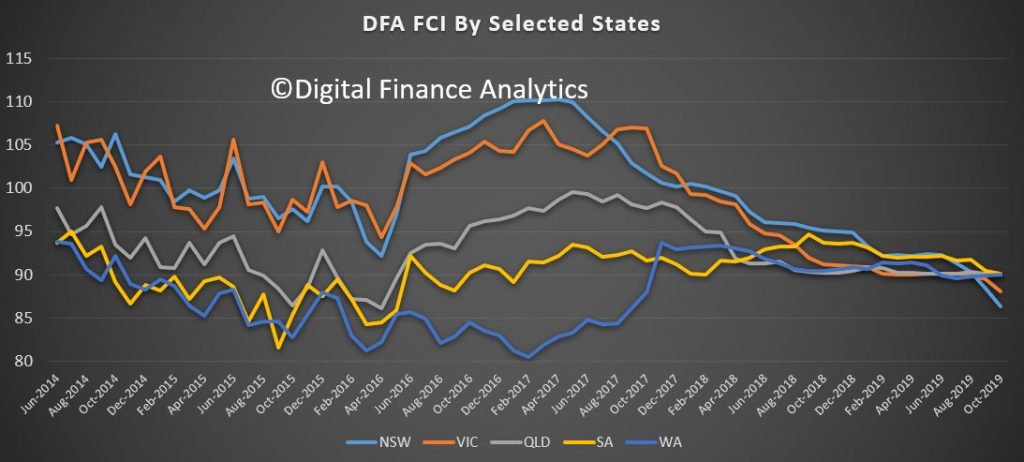
Across the states there was a significant decline in NSW, from 88.4 to 86.2, and this is connected with rising household budget pressures, and large mortgages in Sydney, plus the fires and drought across the state. VIC fell a little too, while there was a small rise in WA.
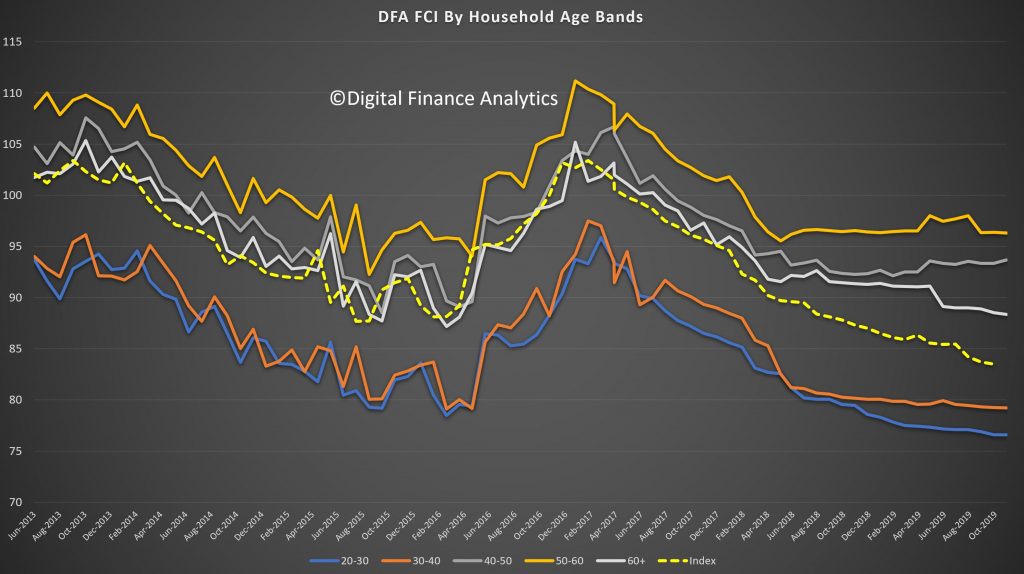
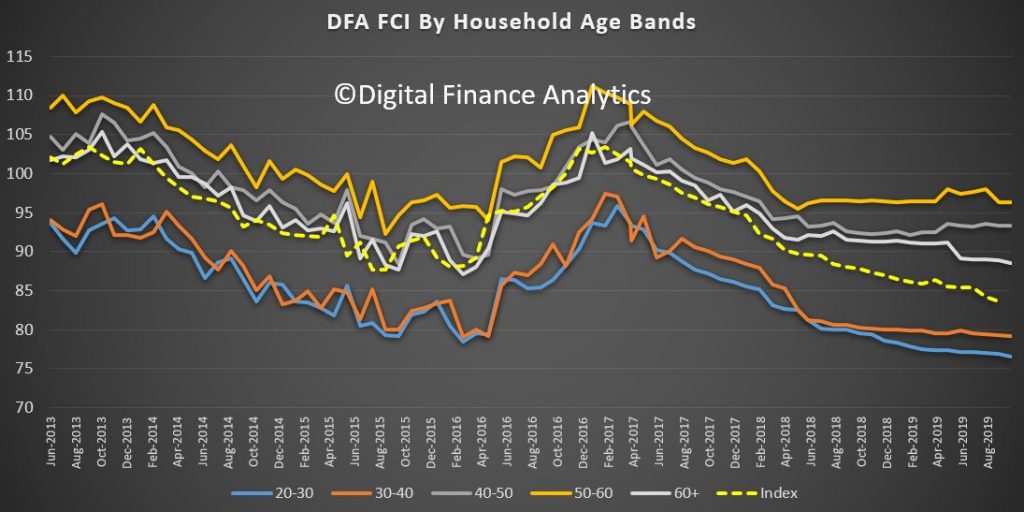
Across the age bands, those aged 20-30 reported the largest fall, thanks to pressure on incomes and rising costs. A number of new first time buyers who bought in recent months reside here. On the other hand, older cohorts are a little more positive this month, thanks to recent stock market rises, and some better home price news. We note, for example the headline of 6% plus rises in prices across Sydney have been interpreted by households in ALL post codes as appropriate to them – which shows the impact of a tricky headline, remembering that price rises are much higher in the more affluent upmarket postcodes.
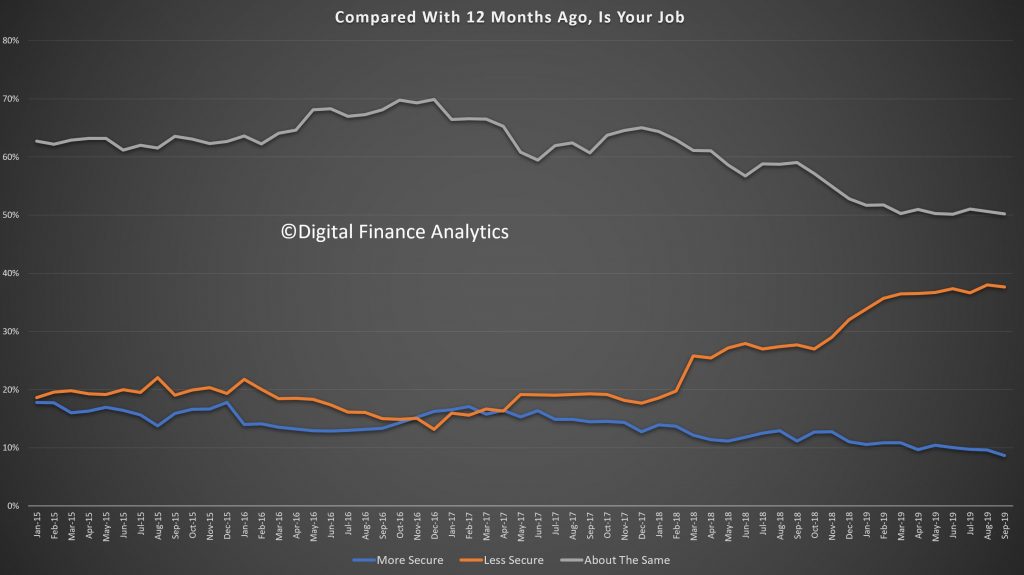
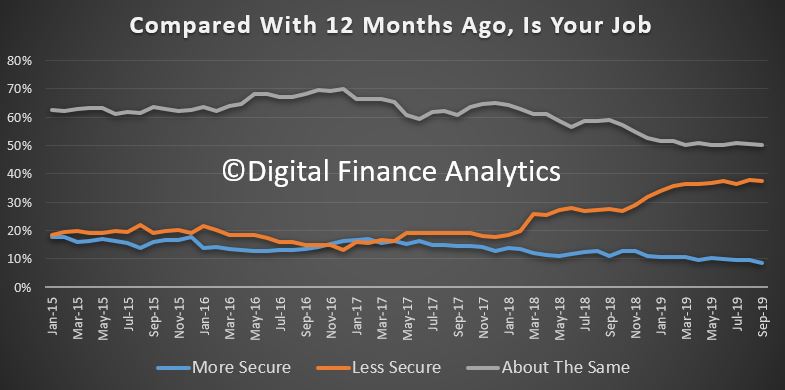
Turning to the moving parts within the index, job security is under pressure, thanks to underemployment, weakness in retail and construction, and the upcoming holidays. 7.8% felt more secure than a year ago, down from 8.23% last month. 38.65% said they were less secure compared with 38.12% last month.
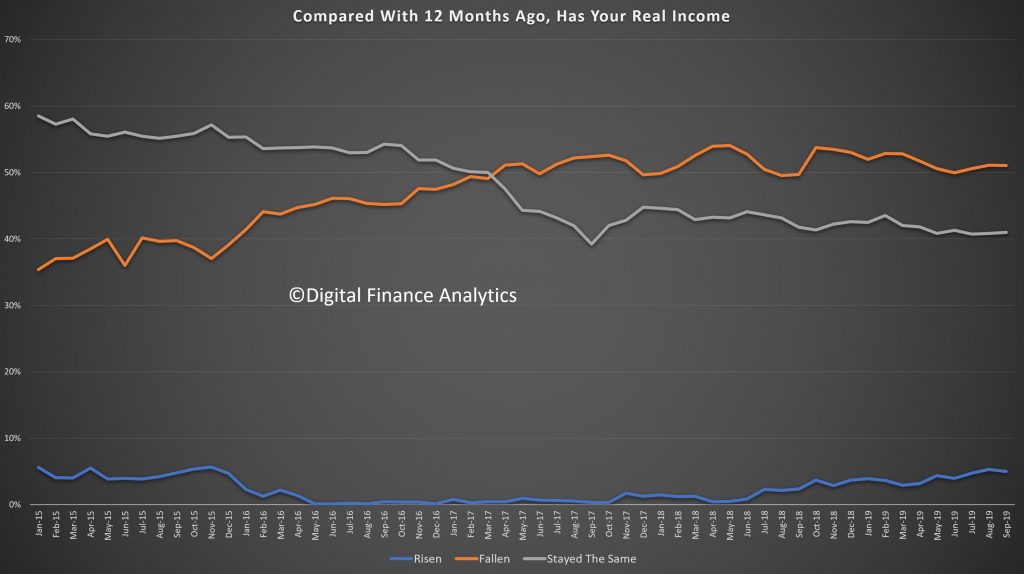
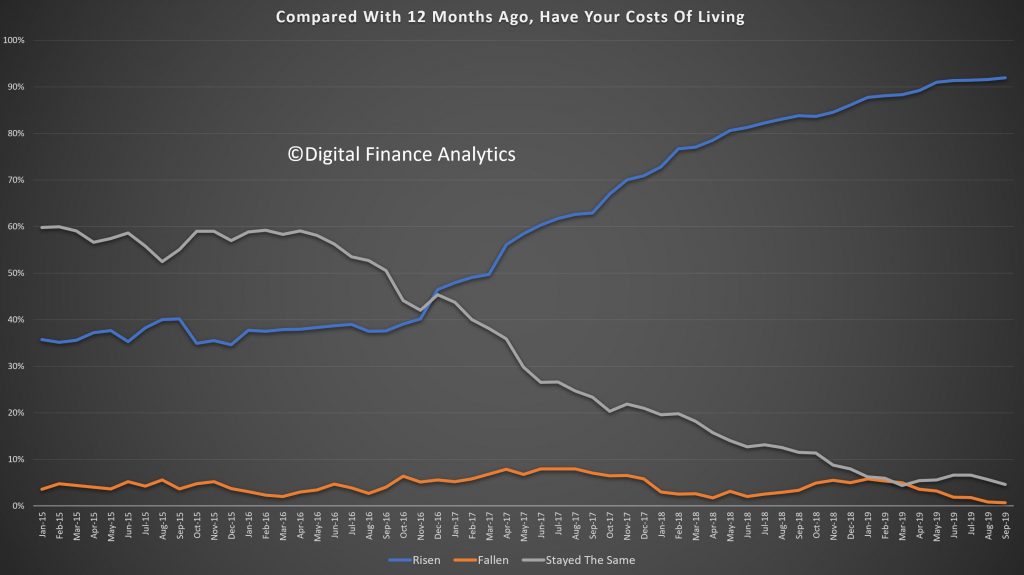
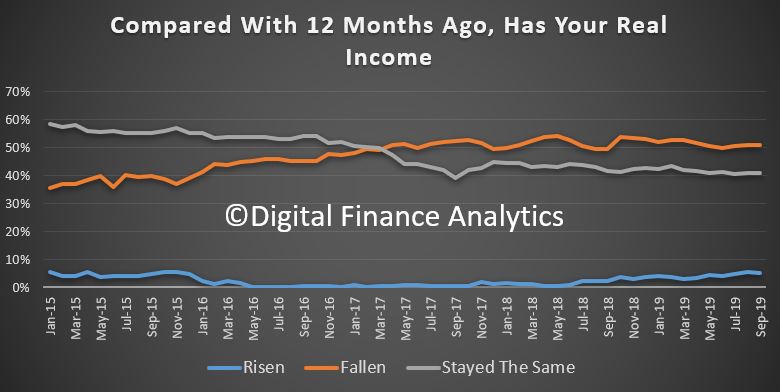
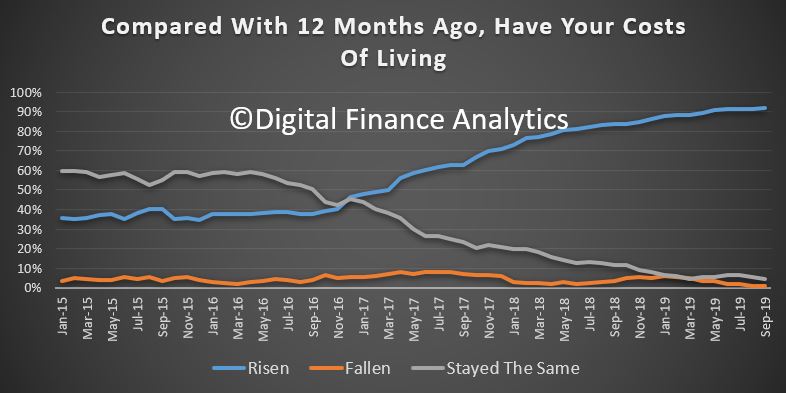
Incomes remain under pressure, with just 4.3% saying in real terms their incomes were higher than a year back, down from 5.3% last month. Pressure on household budgets is a pincer movement, as incomes are compressed (and returns from some investments and deposits fall). But costs of living are rising. In fact 94.2% reported higher costs than a year back, thanks to higher prices for fuel, electricity, school fees, childcare, and every needs. Only 1.3% said their costs of living had fallen.
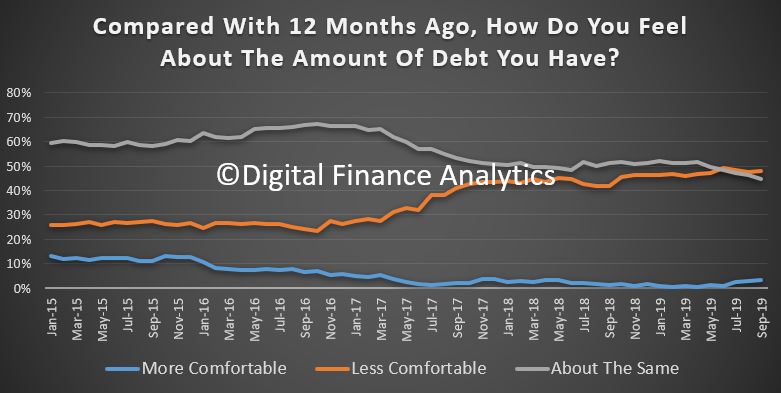
Debt remains a major issue for many households, despite the rate cuts. Some households are paying down their mortgage faster than required, and are using the lower rates, and tax refunds for this. In an era of uncertainty, this is not a surprise. We also see a rise of households under pressure turning to payment options like AfterPay to support their purchases. Just 2% of households were more comfortable with their debt levels than a year ago, while 48% were less comfortable.
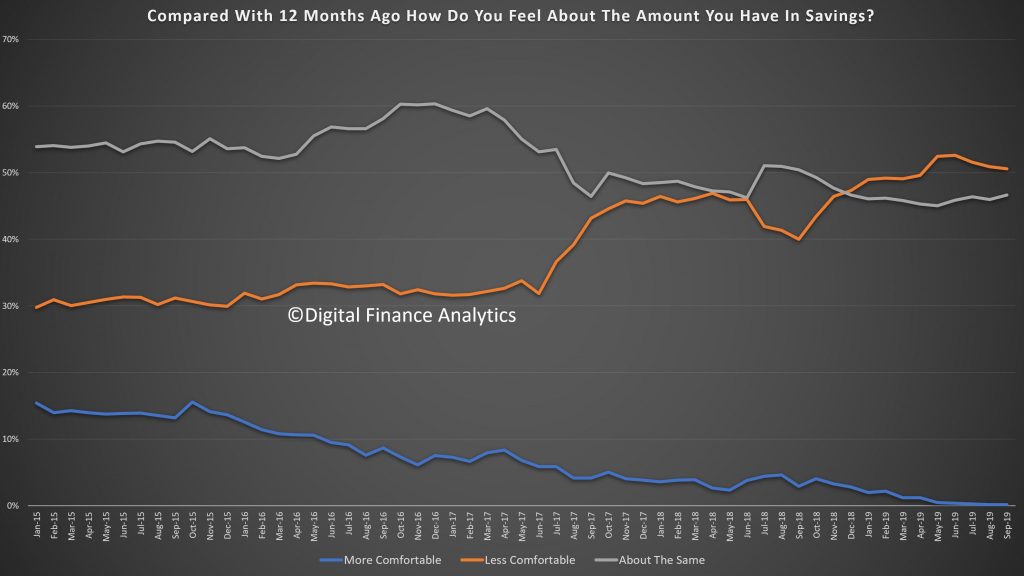
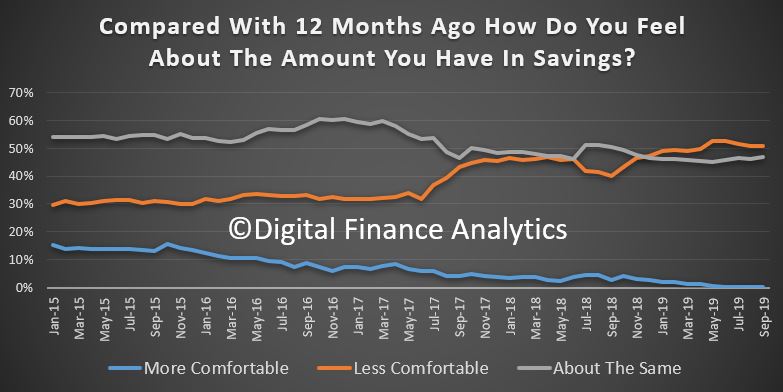
Some households have been building their savings (using lower mortgage rates and tax refunds) to build resilience for later. However, lower interest rates on deposits are creating its own pressures, while those with stocks and shares are seeing some dividend pressures too. Around 20% of households have insufficient funds to cover a month without work. Just 0.42% of households were more comfortable than a year ago, 49% were less comfortable and 45% about the same.
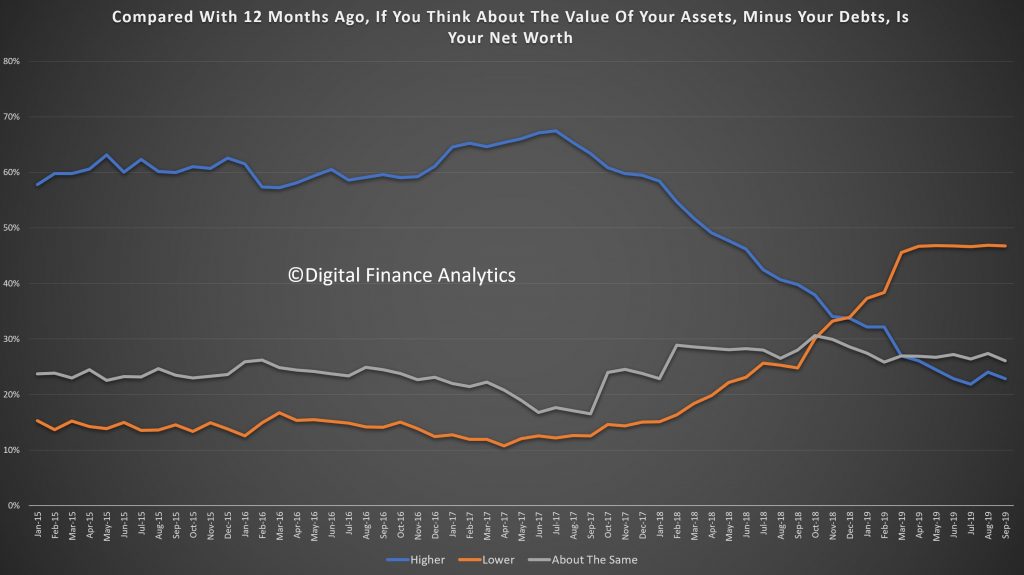
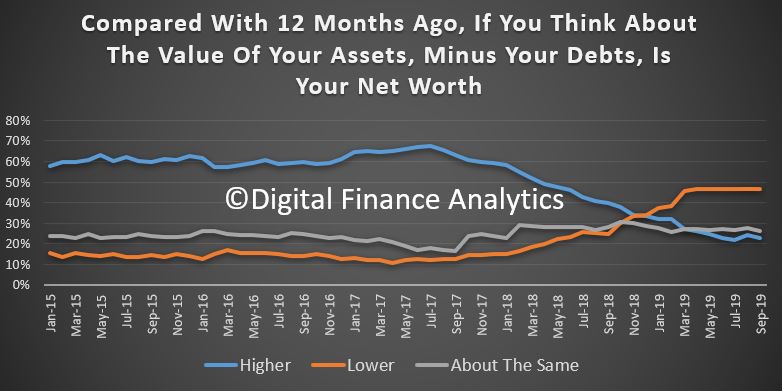
Finally, net worth – assets less liabilities, reacted to the higher reported home prices so that 27% say their net worth was better than a year ago up from 24% last month, while 43% were lower, and 24.65% about the same. Net worth was also boosted by high stock market prices and exchange rate movements.
So in conclusion, the household sector remains under pressure, and as a result financial confidence is bruised beyond immediate repair, that is until such time as wages growth really starts to accelerate in real terms. In addition the broader discussions about lower cash rates and quantitative easing are also helping to degrade confidence. The only bright spot, real or illusory, is the recovery in home prices (which are of course not uniform across the main centres and post codes). On this front, households are hoping for the best. We will see.
Mortgage Stress Strikes Higher Again! [Video]
We review the latest results from our household surveys.
Mortgage Stress Strikes Higher Again
DFA has released our mortgage stress survey results to the end of November. And after a couple of months going sideways, thanks to some rate cuts and tax refunds, the trajectory has gone sharply higher again this month.
One factor which is now biting is the switch from interest only loan to principle and interest loan repayments, which has lifted average monthly repayments by more than 20% for some. In addition the underemployment and unemployment factors are playing in, as is the drought. In fact, the drought now appears to be right up there in terms of directly hitting regional unemployment as well as lifting food prices more generally. This all suggests that even more stress is baked in ahead.
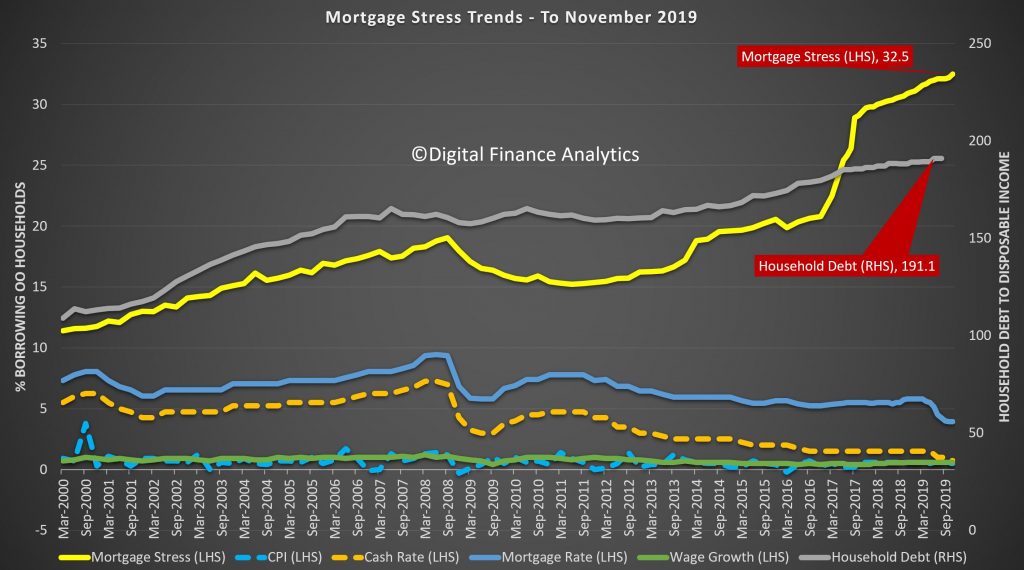
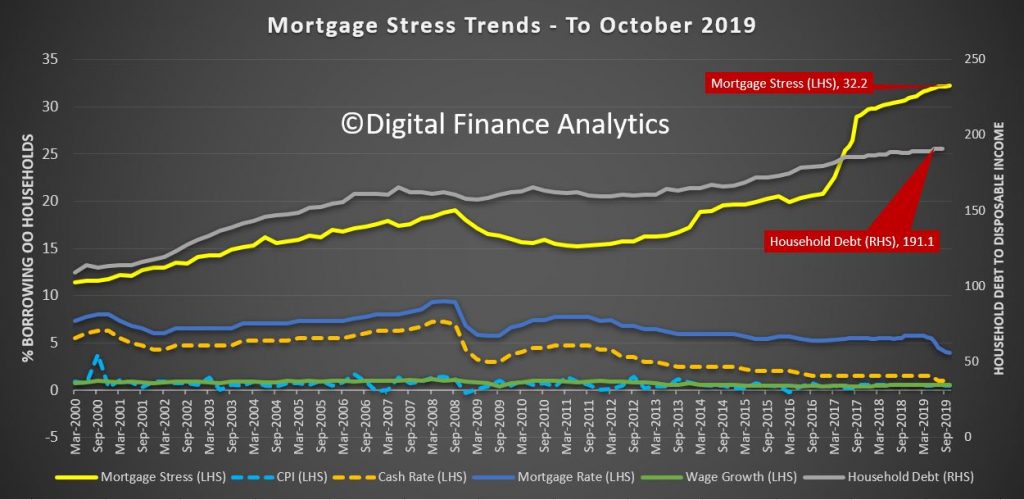
The proportion of households now in mortgage stress, based on an assessment of their cash flow (money in, compared with money out, including mortgage repayments where appropriate), has now lifted to 32.5% of households.
This equates to 1,082,000 households, the highest ever measured in our surveys. Worse, more are slipping into risk of mortgage default, according to our forward modelling*. More are also in severe stress, reaching over 80,000 for the first time. These households are more likely to default ahead.
Household debt to income remains at an all-time high. In addition, more continue to raid deposits to make ends meet.
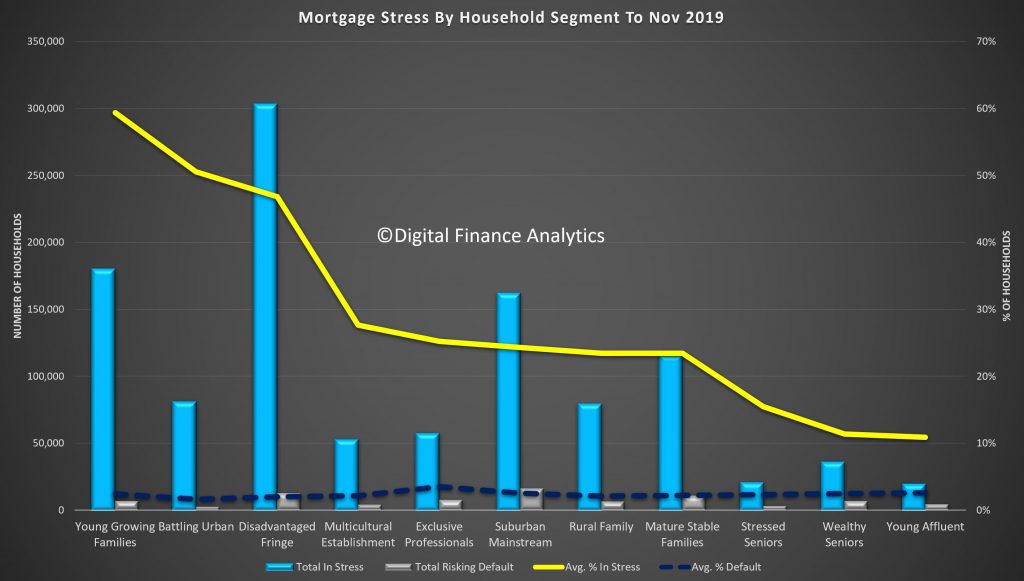
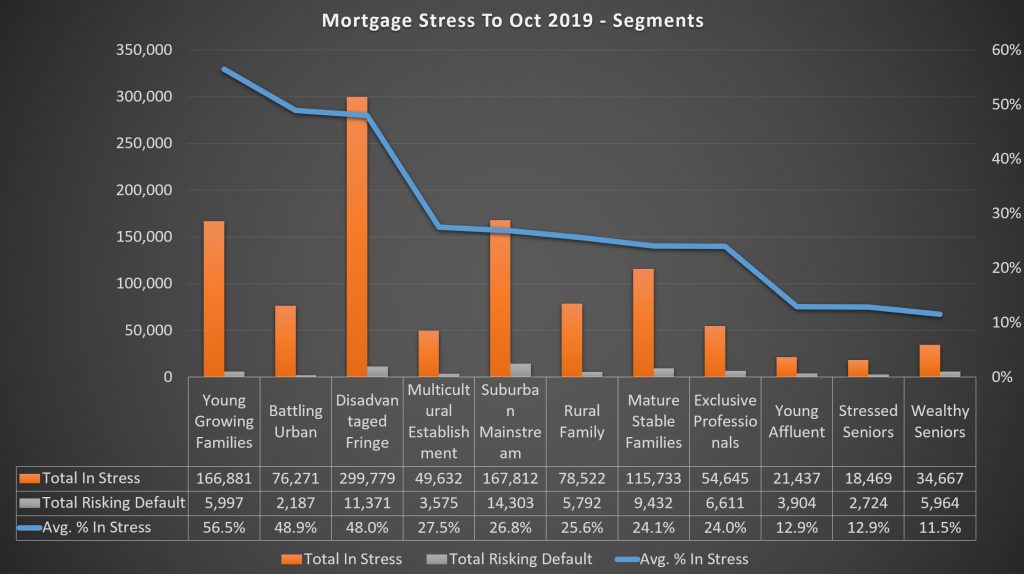
Across the DFA household segments we continue to see some variations between cohorts. Young Growing families have the highest stress, and many first time buyers are represented in this group. The largest counts are located on the urban fringe, and many of these households are living on newly build high density estates. However, stress continues to spill over into more affluent groups, and here the impact of the IO loan switch is quite strong. Some of these are living in the high rise sector, where construction issues are also biting.
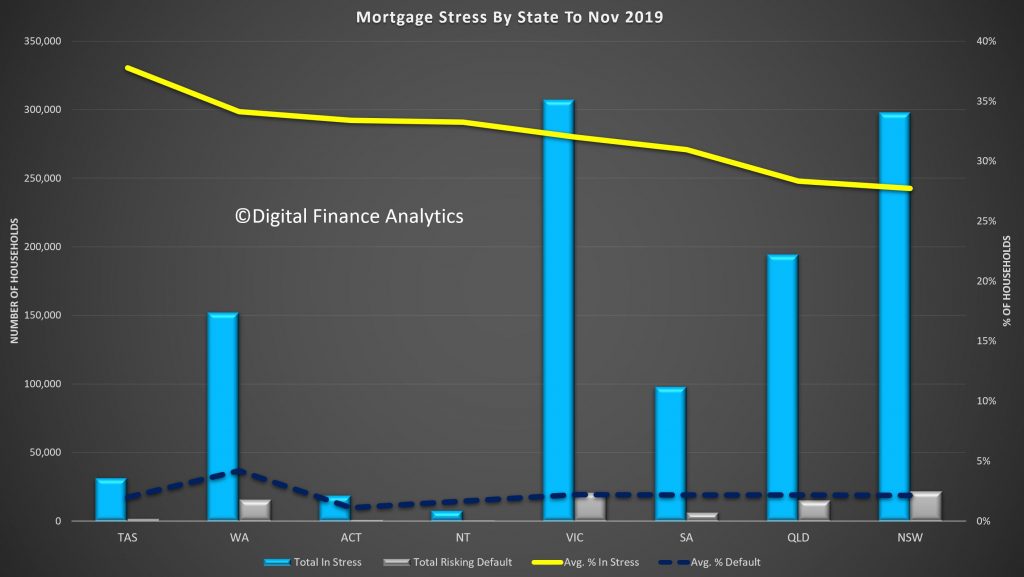
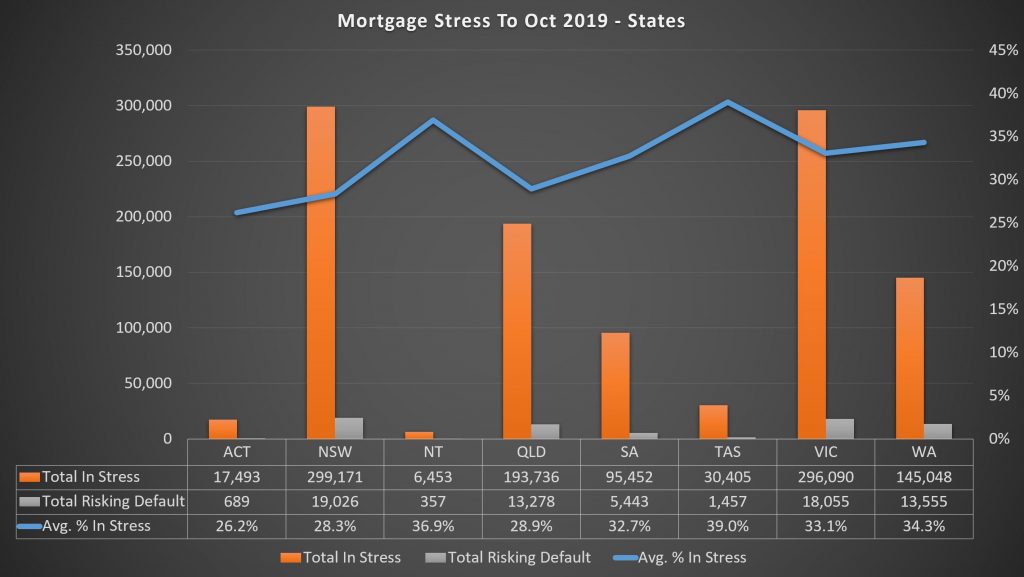
Across the states Tasmania has the highest proportion in stress, thanks to low wages, and recent price hikes, but the largest number of households in any one state is in Victoria. However, the default rates look to be rising faster in Sydney, where values are more extended relative to incomes.
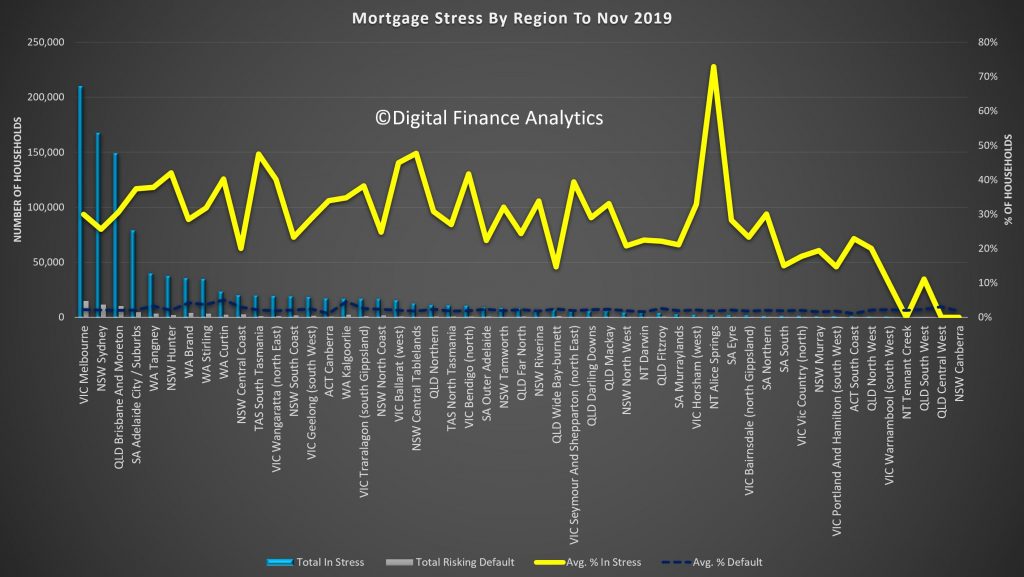
At a regional level, the largest counts are in the main urban centres of Melbourne and Sydney as expected, although stress is spilling out more widely into regional centres.
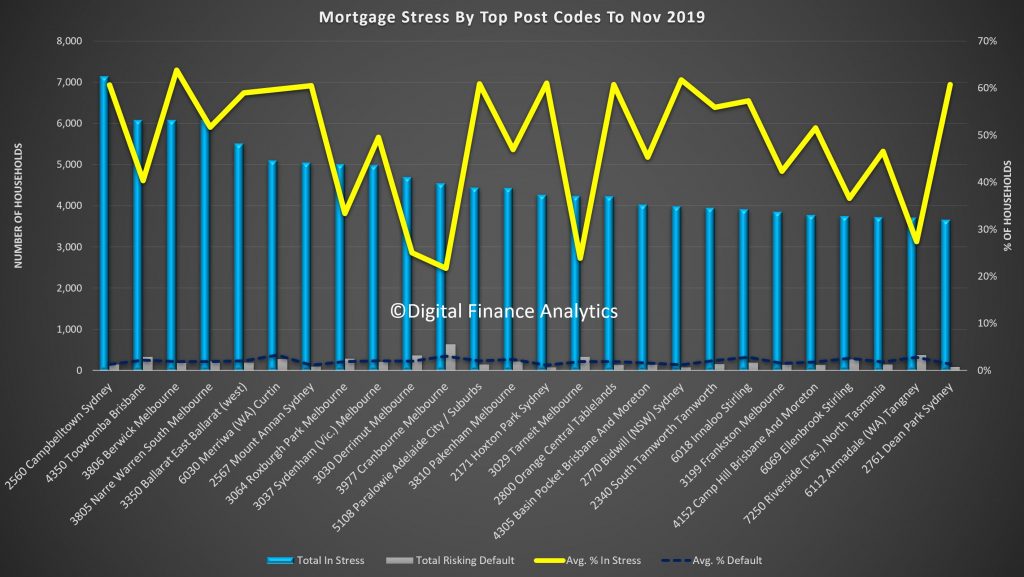
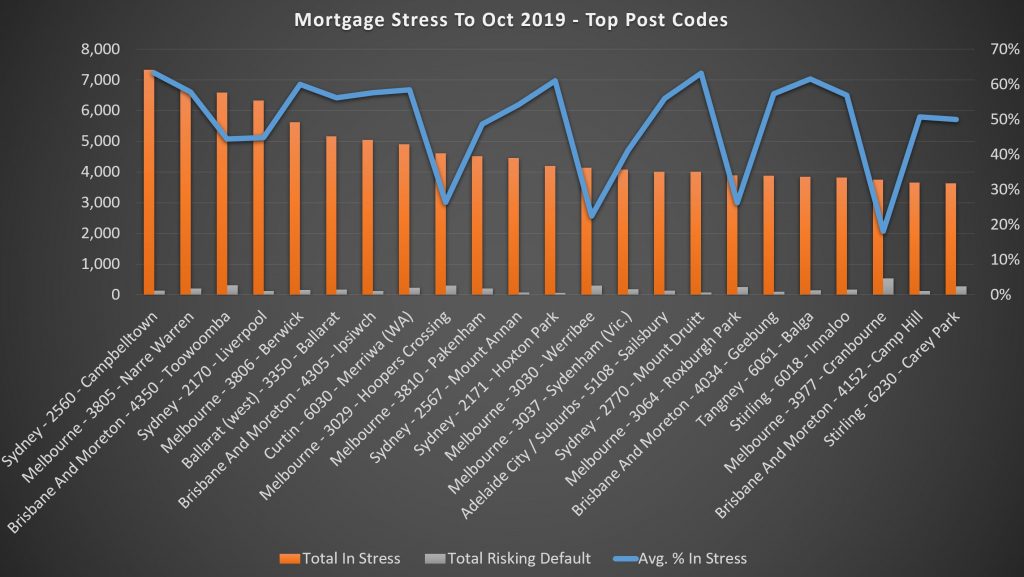
And our top post codes continues to centre in on the urban fringe, with Campbelltown, Toowoomba and areas around Melbourne including Berwick and Narre Warren all showing the largest counts of stressed households. Cranbourne 3977 has the highest count of potential defaults this month. Postcodes in WA are still under pressure as the economic grind continues.
*Note: last month we briefing misreported the household stress figure at 1.77 million not 1.07 million. This was corrected within a few moments of posting. You can see the previous post here.
Our surveys are based on a rolling 52.000 household sample, which equates to around 0.5% of households.
DFA Live Property And Finance Q&A 20 Nov 2019 And Updated Scenarios
We ran our regular live event last night. This is the high quality edited edition, including some behind the scenes footage.
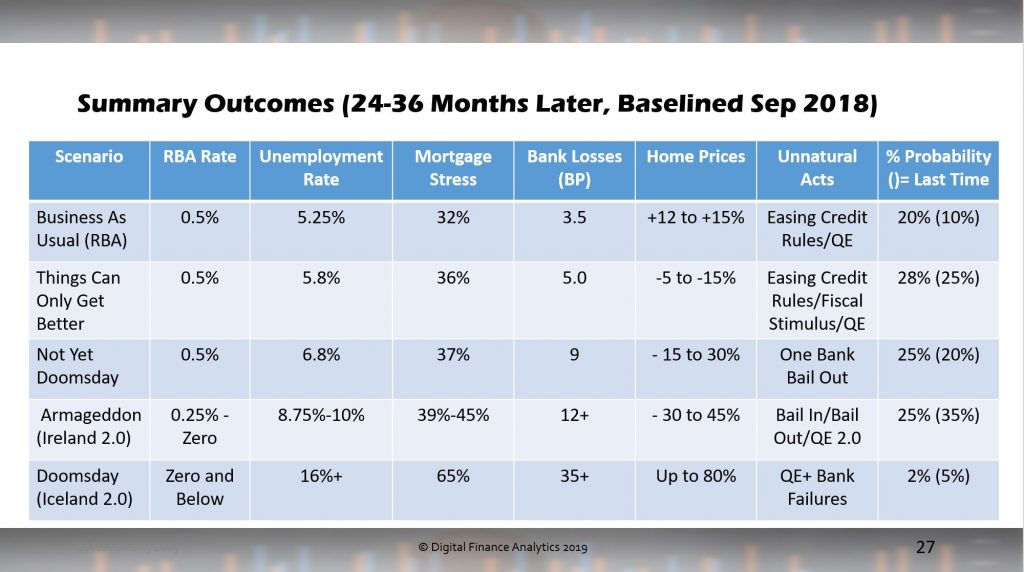
We discussed our scenarios on property prices and other economic metrics over the next couple of years as well as a range of other important questions from the community.
The original recording of the pre-show, show and live chat is also available here. The formal show begins at 32:30.
Home Price Expectations Are Held Up By Hot Air! [Video]
I discuss the final results from our latest surveys.
Home Price Expectations Held Up By Hot Air!
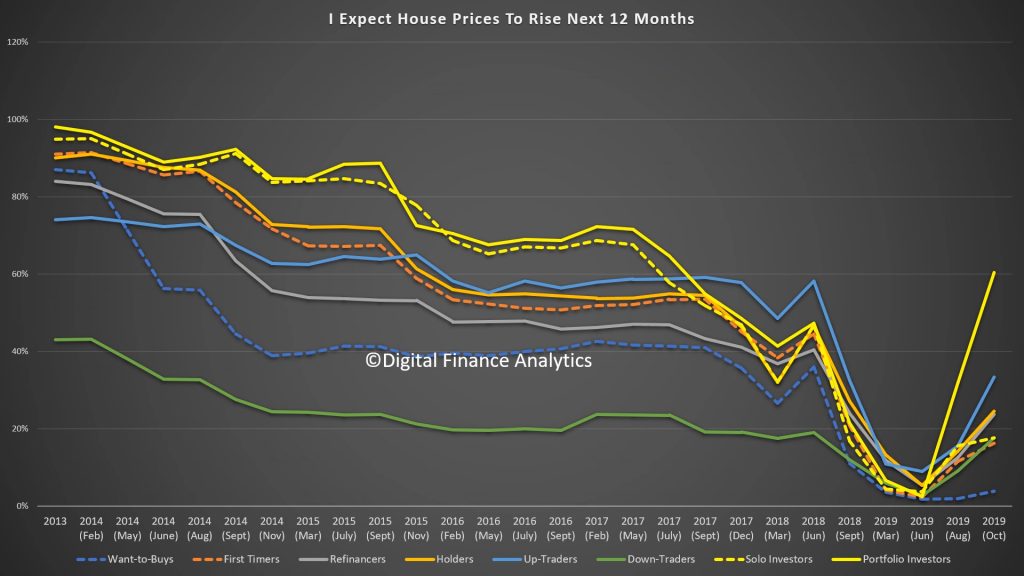
In the final part of our October 2019 Household Survey we look at the results through the lens of our segmentation models. What is clear is there is a disconnect between future home price expectations (much more positive) and proposed activity (lower demand for credit, and intentions to transact). This is at the heart of the weirdness in the market at the moment, and it helps to explain the low levels of listings and transactions (and hence the high auction clearance rates on those low volumes). There is nothing in the latest results however which flags significant momentum increases ahead.
We start with the cross-segment trends. First there is a significant hike in those expecting home prices to be higher in the next 12 months. It reached a low around the election, and has been rising since the cash rate cuts. Portfolio Investors (those with multiple investor properties are the most bullish). But the expectations are there across the board.
However, this does not necessarily translate into intention to transact. First Time Buyers and Down Traders (around 900k) are most likely to be in the market, the former aided by the extra incentives available and the latter by the need to pull equity from existing properties. Property investors remain largely on the sidelines. There is also a slight downward inflection in the past quarter.
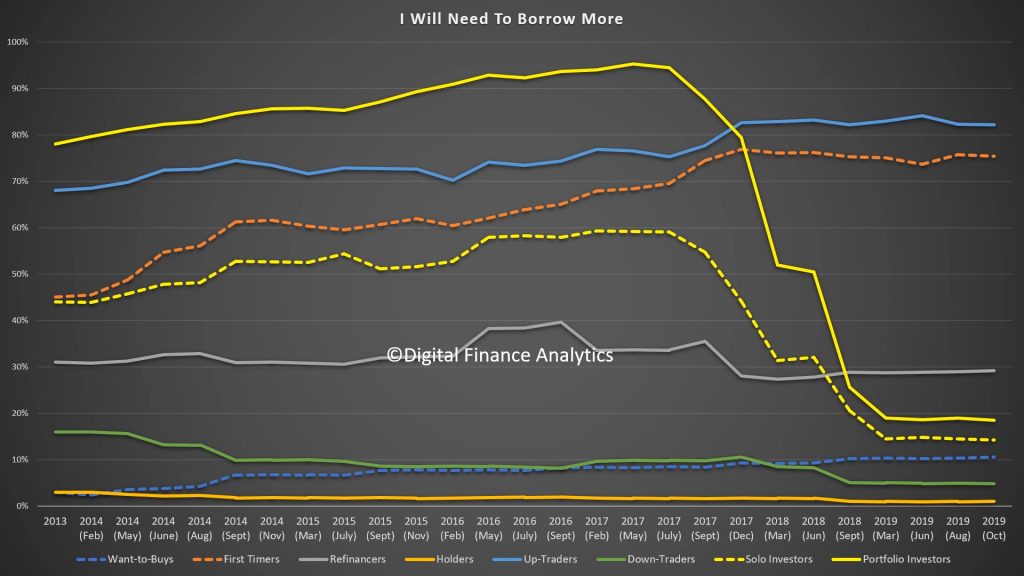
Another lens is demand for credit which shows stubborn resistance other than from First Time Buyers ~around 150k actively looking) and Up Traders (around 550k actively looking). Refinancing is tracking at levels we have seen for some time. This suggests that banks will have to compete hard for meager pickings, and refinancing and first time buyers will be the targets for special deals.
Those Wanting to Buy say that availability of finance (40%) and costs of living (30%) are the main barriers, although high home prices at 16% still registers. Interest rates and fear of unemployment are low relatively speaking.
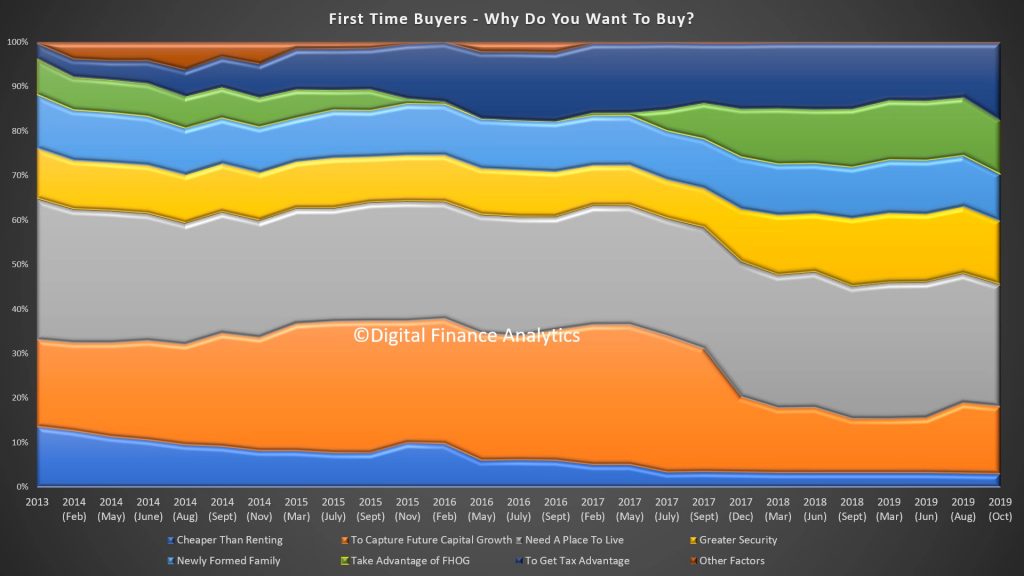
First time buyers are being driven by a range of factors including the need for shelter and a place to live (28%), greater security (14%), tax advantage (17%) and to take advantage of the FHOG (12%). But that said there are significant barriers as well.
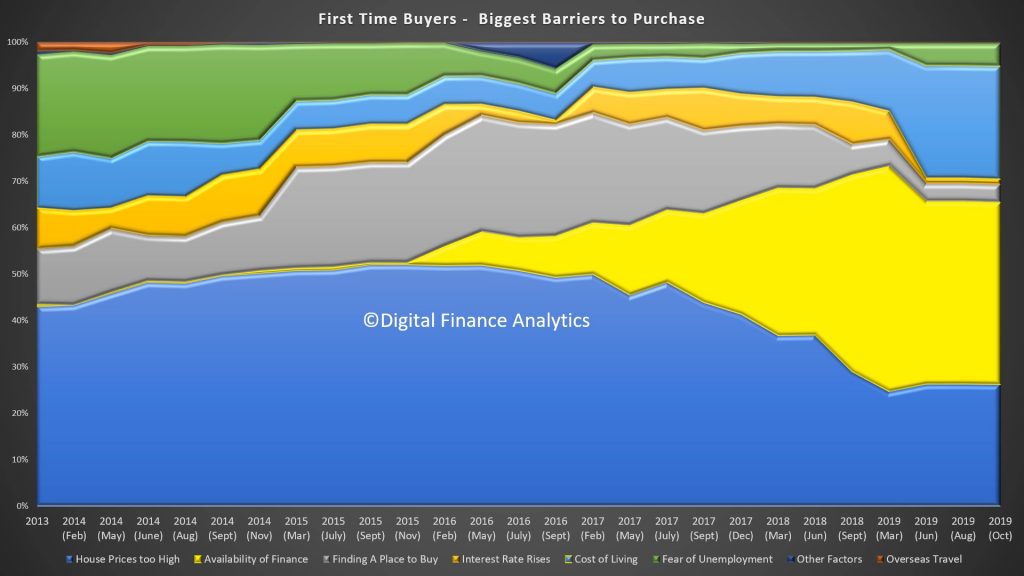
Barriers include home prices too high (26%), availability of finance (39%) and costs of living (24%). On the other hand finding a place to buy and rising interest rates hardly registered.
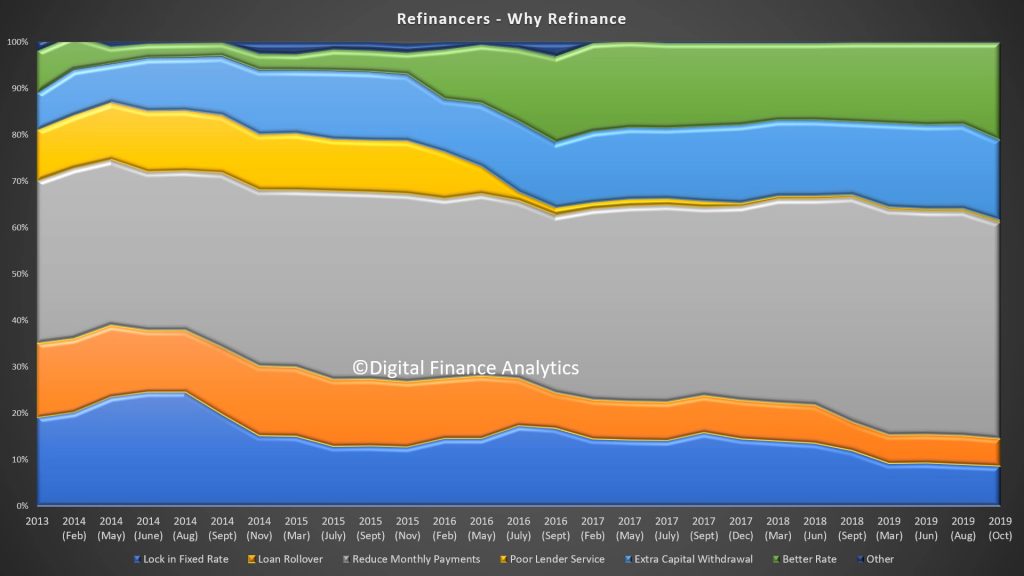
Household seeking to refinance are being driven by reducing monthly repayments (50%), for a better rate (22%) and extra capital withdrawal 20%.
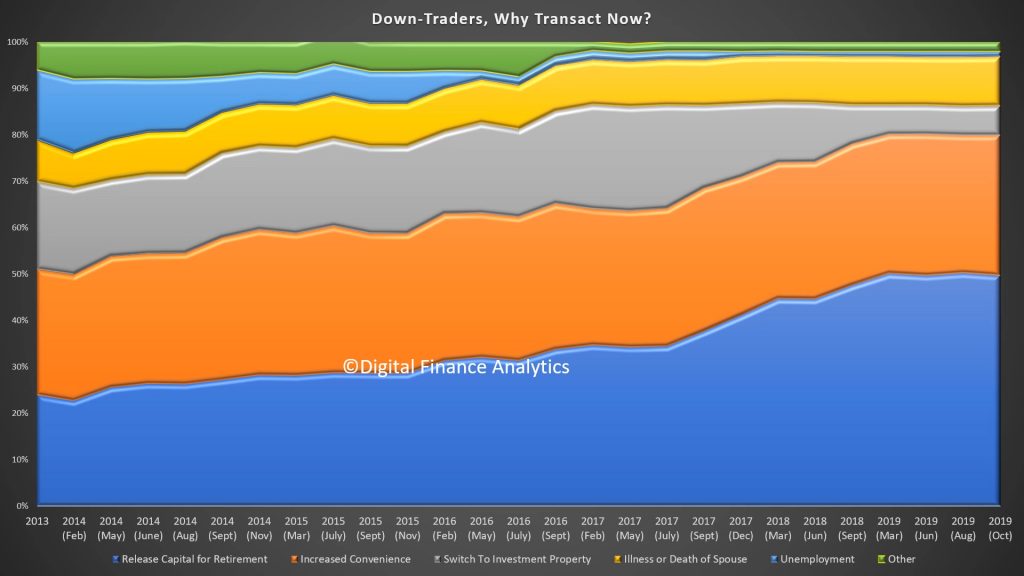
Down Traders are driven by the desire to release capital for retirement (50%), increased convenience (30%) and illness or death of spouse (11%). Interest in investment property has faded to 6%.
Up Traders are being driven by the desire for more space (41%), job change (16%), property investment (22%) and life-style changes 20%).
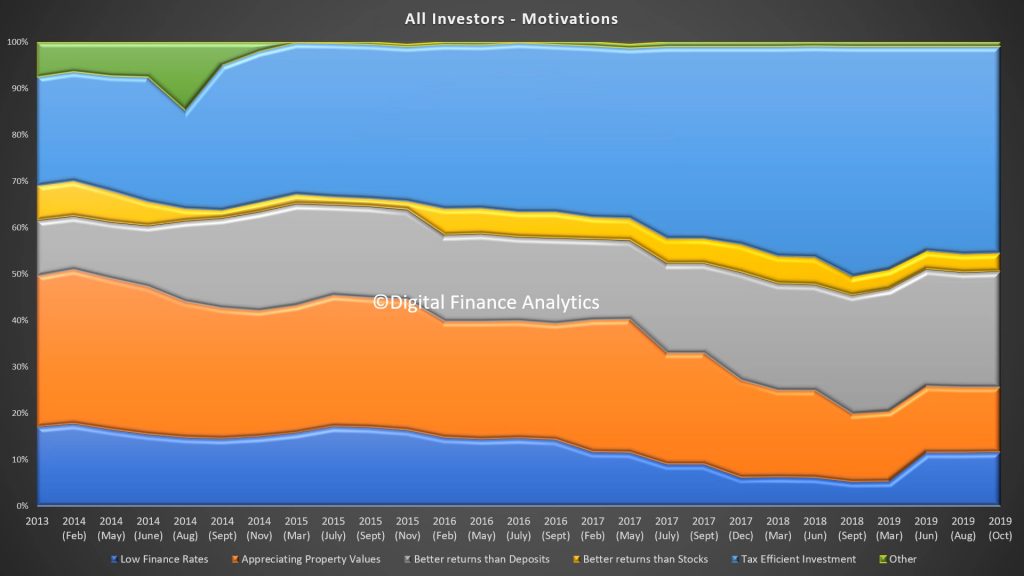
Turning to investors 45% are driven by tax benefits, better returns than deposits (25%) and appreciating property values (14%).
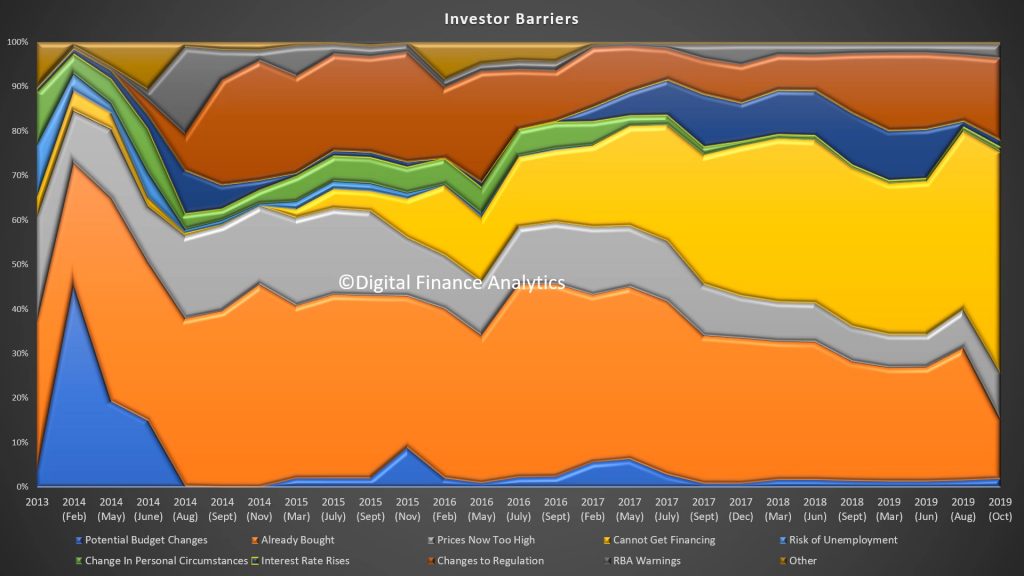
On the other hand, investors face a number of barriers including cannot getting finance (49%), and they have already bought (13%).
And finally across the segments the prime selection point is price, although it varies, and loyalty is not seen as significant or rewarded.
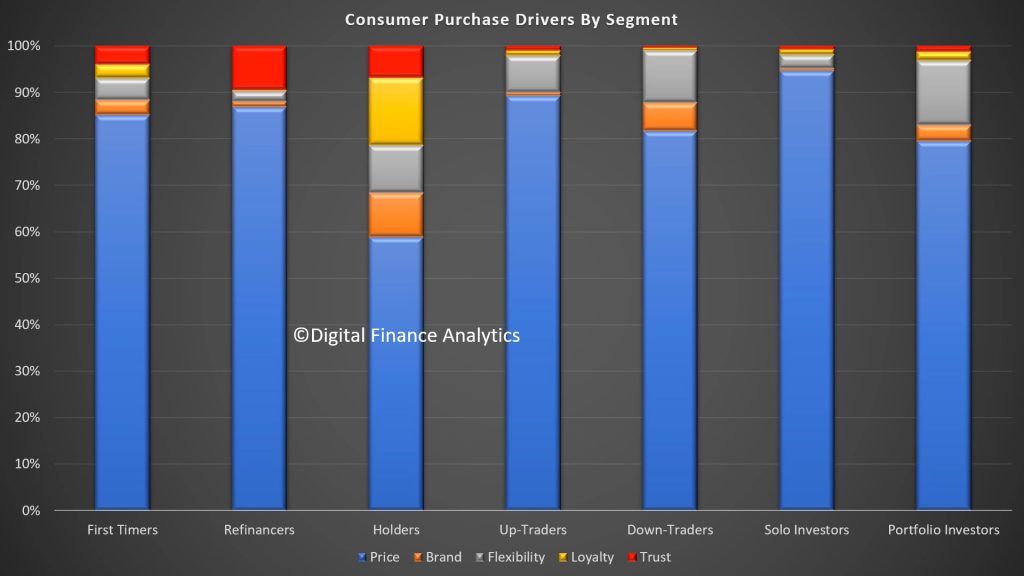
Standing back, it appears that property sector momentum is likely to remain patchy at best, with more action at the more expensive end of the value spectrum, and first time buyers remaining as the primary “canon fodder” with regards to new transactions. It will be interesting to see how the Government scheme due in January changes the picture.
Latest Household Research On Stress And Confidence [Video]
We have released two videos today which summarise our latest household research.
Note at the 3 min mark I misspoke on the stress data – should be “shows a further 7,000 household fell into stress taking the total to more than 1.07 million households or 32.2%”
Household Financial Confidence Erodes Some More
The bad news keeps coming, with the latest DFA Household Financial Confidence Index for October at the lowest ever of 83.7.
This continues the trends of recent months, since dropping through the neutral 100 score in June 2017.
The falls were widespread across our property segments, with investors still way down, under the pressure from low net rental yields, the need to switch to principal and interest from interest only, and worries about construction defects. Owner occupied households were less negative, but those renting continue to struggle with higher levels of rental stress.
Across the states there were significant falls in NSW and VIC, whilst other states continued to track as in recent months. The main eastern states are now lower than WA and SA, which is a surprising new development.
Across the age bands, the falls are mainly among lower aged groups, while those aged 50-60 are feeling more positive thanks to recent stock market rises.
This is also reflected across our wealth segments, with those holding property mortgage free and other financial assets more positive (though still below neutral) compared with mortgage holders and those not holding property at all.
We can then turn to the moving parts within the index, based on our rolling 52,000 household surveys. Employment prospects continue to look shaky, both in terms of under-employment and job security. Jobs in retail and construction and also finance are under-pressure, and the impact of the drought is also hitting some areas. 8% of household felt more secure than a year ago, the lowest read ever in this part of the survey. More households have multiple part-time jobs.
Income remains under pressure, with 51% saying their real incomes have fallen in the past year, while 5% reported an increase, often thanks to switching jobs or employers.
Household budgets are under pressure as costs of living rise, with 91% reporting higher real costs that a year ago, this is a record in our survey. Expenses rose across the board, from child care, health care, school fees and rates. Food costs were higher partly thanks to the drought. There was a small fall in the costs of power, and fuel, but not enough to offset rises elsewhere. Mortgage interest rate falls were blotted up quickly, and the tax refunds where they were received were much lower than people had been expecting.
Some households are deleveraging (paying down debt) , while others are more concerned about the amount they owe from mortgages to credit cards and on other forms of credit. 48% of households are less comfortable than a year ago. Lower interest rates are only helping at the margin.
Savings are under pressure from several fronts. Some households are tapping into savings to keep the household budget in check – but that will not be sustainable. Others are seeing returns on term deposits falling away, yet are unwilling to move into higher-risk investment assets. Those in the share markets are enjoying the current bounce, but many expressed concerns about its sustainability. 49% of households are less comfortable than a year ago, while 47% are about the same. Significantly around 27% of households have no savings at all and would have difficulty in pulling $500 together in an emergency. Around half of these households also hold a mortgage. Worth reflecting on this with 32.2% of households in mortgage stress as we also reported today!
And finally, we consider net worth (assets less liabilities). Here the news is mixed as some households are now convinced their property is worth more citing the recently if narrowly sourced data on rises in Sydney and Melbourne. However other households reported net falls. 24% of households said their net financial position was better than a year ago (up 1.3%), while 45% said they were worse off (down 1.6%). There are also significant regional differences with households in Western Australia and Queensland significantly worse off, while some in inner city areas of Sydney and Melbourne claimed significant advances.
So, overall the status of household confidence continues to weaken, which is consistent with reduced retail activity, and a focus on repaying debt. Unemployment is lurking, but underemployment is real. We also see weaker demand for mortgages ahead, and we will discuss this in more detail in our upcoming household survey release. Without significant economic change, these trends are likely to continue for some time. If the RBA and Government is relying on households to start spending, they will need a very different strategy – including a significant fiscal element. Lower interest rates alone will not cut the mustard.
Mortgage Stress Tracks Higher Yet Again
After talking a breather last month, thanks to rate cuts and tax refunds (minimal those these were in practice), the results from our surveys for October shows a further 7,000 household fell into stress taking the total to more than 1.07 million households or 32.2%
Household debt is at record highs, and while costs are still rising, incomes are not in real terms. There was a spate of refinancing which helped some households but the bulk of these were NOT in stress in the first place. The rejection rates for those in mortgage stress are and remain consistently higher.
Mortgage stress is assessed on a cash flow basis, where, based on our 52,000 household rolling annual survey we measure income and outgoings for households, including mortgage repayments. Where the cash flow is net negative, households are in stress. They are required to draw down on savings, put more on credit cards or hunker down – one reason the retail sales data yesterday at o.2% in September was so weak. Stress is based on current circumstances.
We also model the probability of default ahead over the next 12 months, which is a predictive estimate and we expect defaults to continue to rise – we are seeing worrying signs in both New South Wales and Victoria now as economic conditions in these states weaken. Job losses in retail and construction are leading the downturn. But underemployment is widespread. On the other hand, Canberra, with higher public sector wages, is more insulated from the reality elsewhere.
Across our household segments more than half (56.5%) of Young Growing Families are in stress, accounting for more than 166,000 households; followed by Battling Urban at 48.9% or 76,000 households and Disadvantaged Fringe at 48%, with nearly 300,000 household. Rural households are under pressure thanks also to the drought, with 25.6% in mortgage stress, or 78,500 households and even the most affluent segment – Exclusive Professionals are 24% in stress with 54,600 households. In other words mortgage stress is appearing in every sector of society.
Across the states the highest proportion of households in stress are located in Tasmania (39%) and Northern Territories (36.9%), although the number of households is relatively low. New South Wales now has nearly 300,000 households in difficulty or 28.3% of households, and Victoria has 296,000 households in stress or 33.1%. We have been tracking the spike in Victoria in recent months. However, Western Australia has 34.3% of households in stress, or 145,000 households and conditions continue to deteriorate there with more foreclosures in train, as banks speed up their resolution processes.
We analyse stress to post code level, and can identify those postcodes with the largest count of stressed households. Post code 2560 – the area around Campbelltown has the highest count, with 7,300 in stress or 63% of households. Next is Melbourne post code 3805, including Fountain Gate and Narre Warren with 6,600 stressed households representing 57.8% of households. Third is Toowoomba in Queensland with 6,500 households, representing 44% of households in the district, and fourth is 2170 around Liverpool in New South Wales with 6,300 in stress or 44.8% of households. A common characteristic are areas of high urban expansion on the fringe, with many new builds competing with existing property, and many recently purchased. That said, stress can take several years to emerge, and there are pockets of pain from purchases made several years ago.
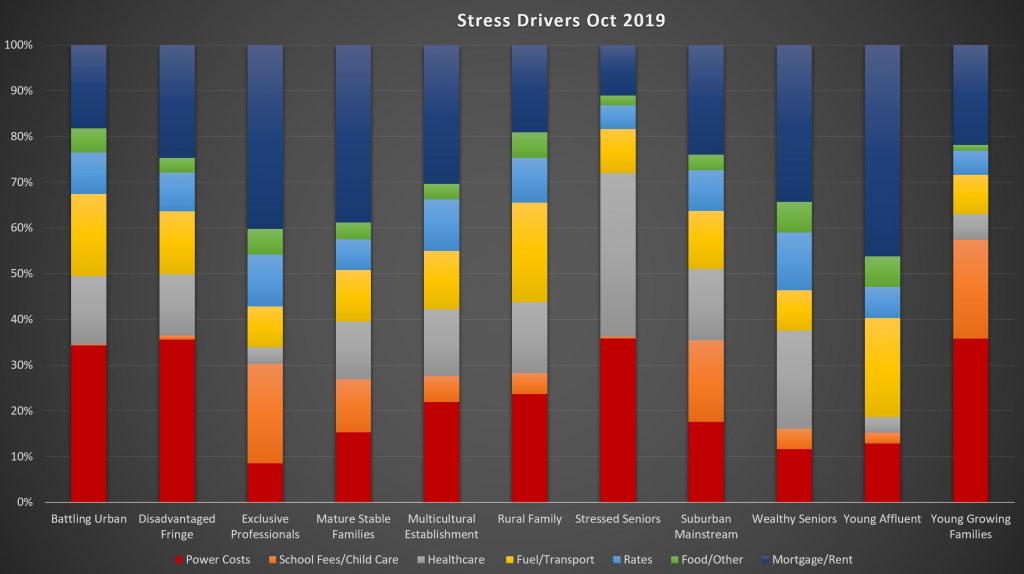
Finally, we also examined the expense drivers of stress from our surveys. These vary across the segments with power prices, school fees and child care, all significant, as well as housing costs overall.
This is likely to drive stress higher unless real wages start to improve, but given the current economic outlook that appears unlikely for now.