Mortgage Stress Tracks Higher Yet Again

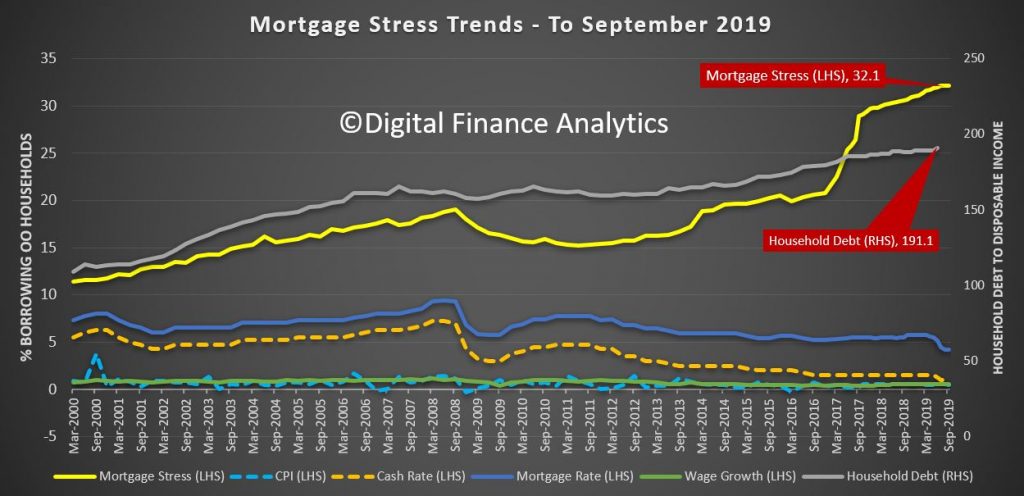
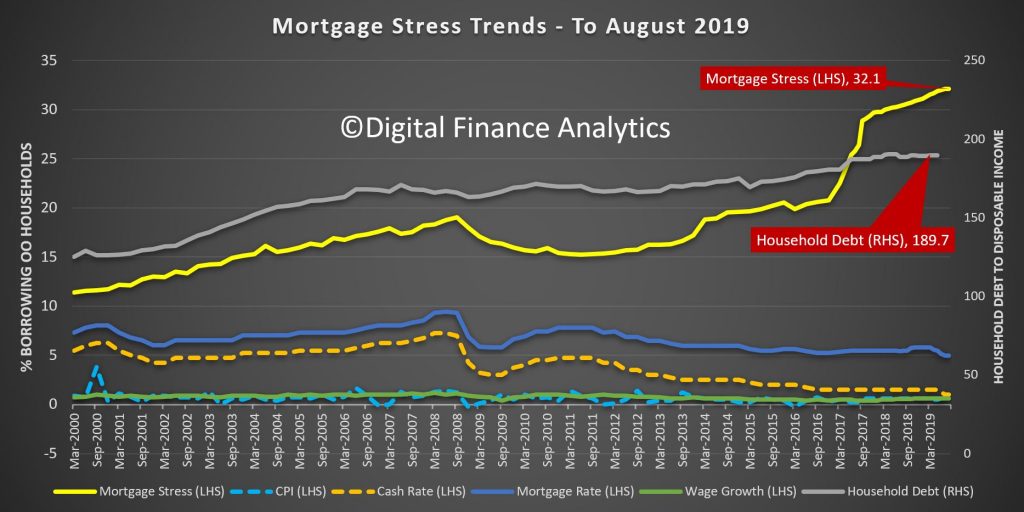
After talking a breather last month, thanks to rate cuts and tax refunds (minimal those these were in practice), the results from our surveys for October shows a further 7,000 household fell into stress taking the total to more than 1.07 million households or 32.2%

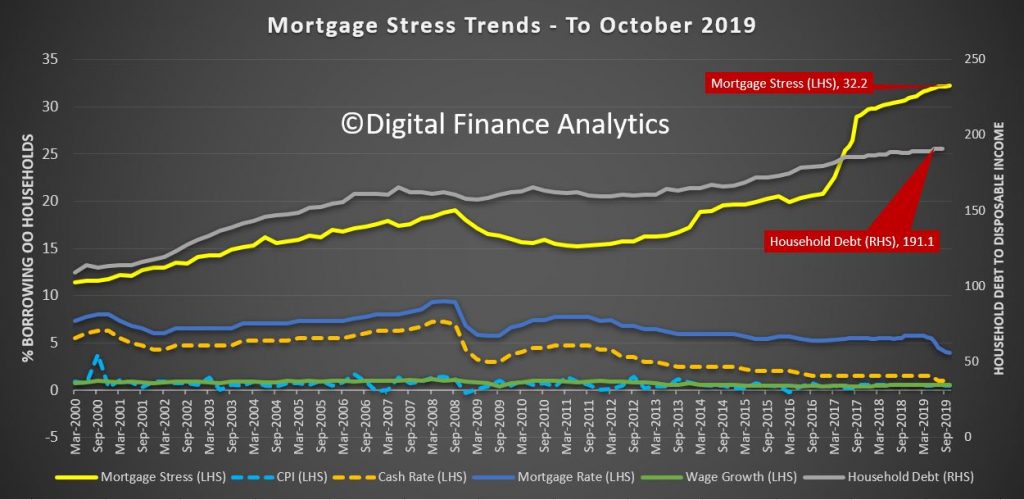
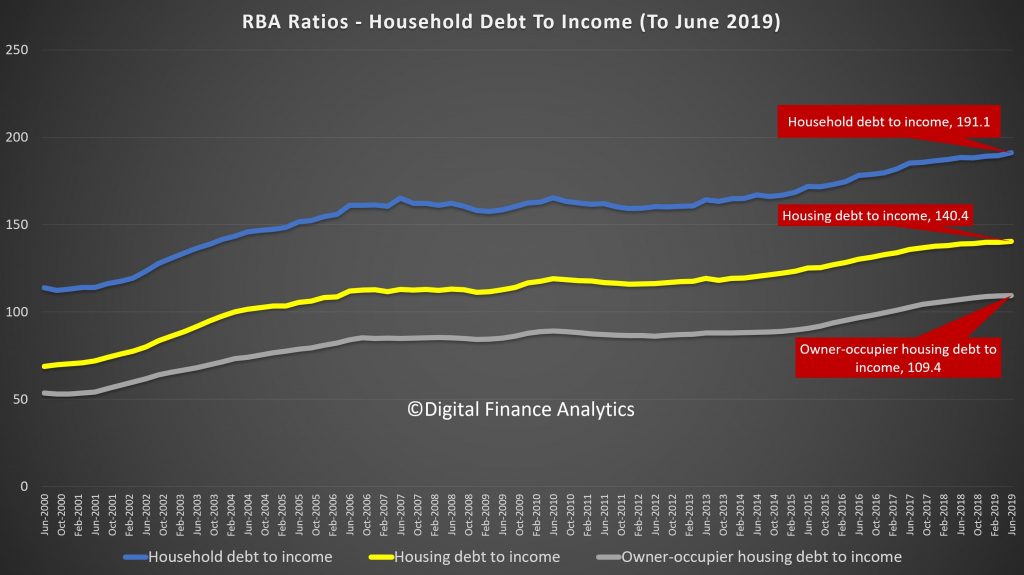
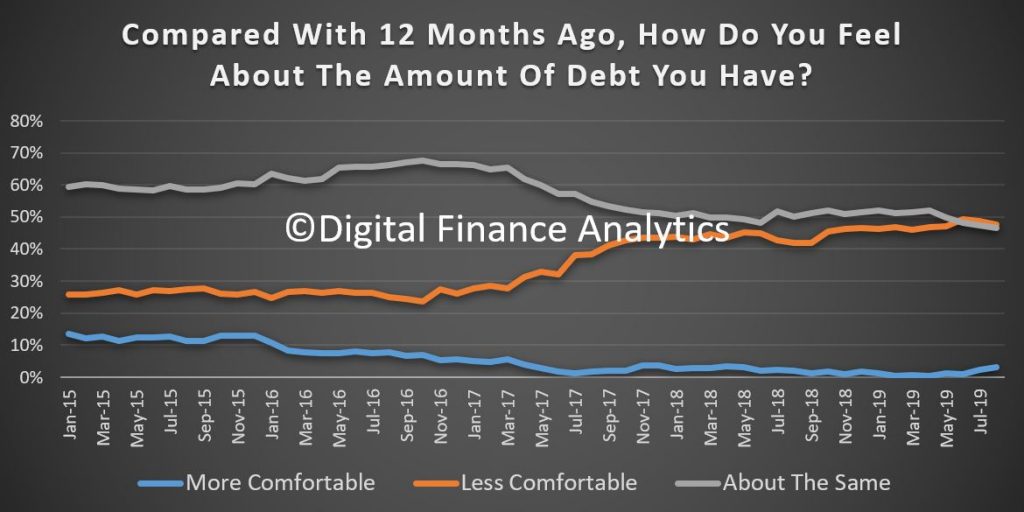
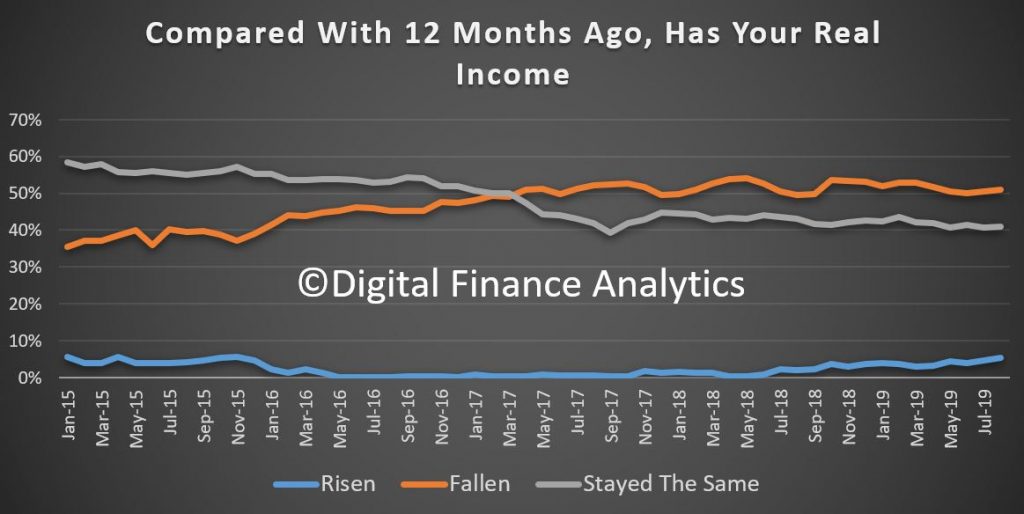
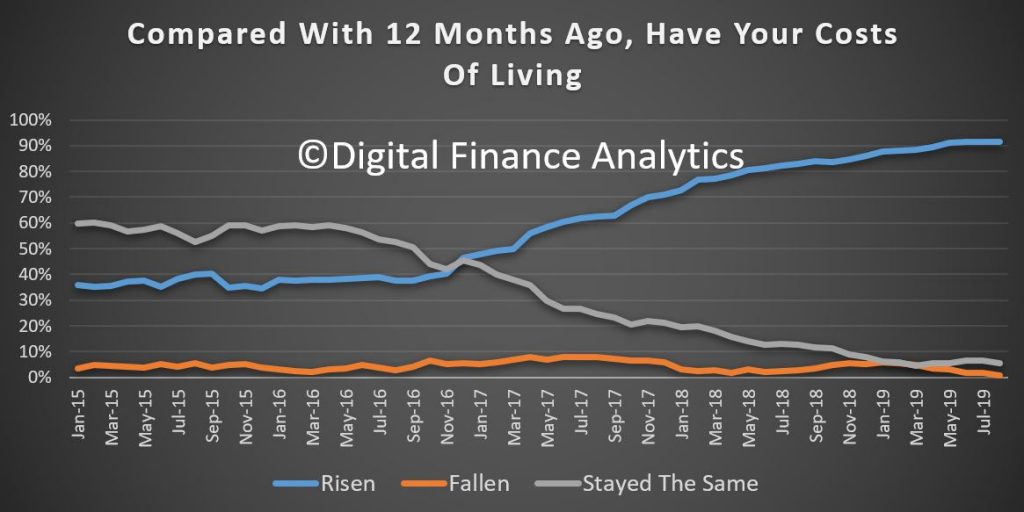
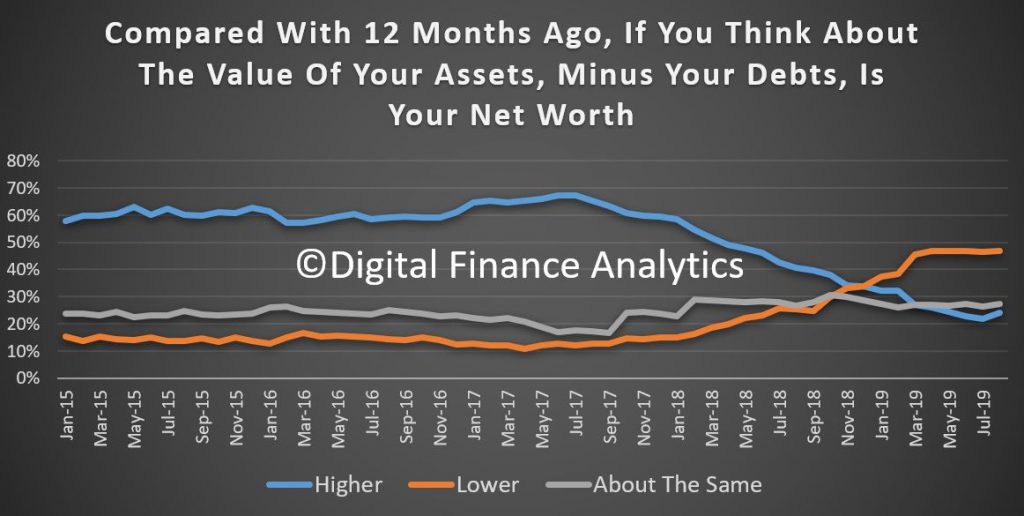
Household debt is at record highs, and while costs are still rising, incomes are not in real terms. There was a spate of refinancing which helped some households but the bulk of these were NOT in stress in the first place. The rejection rates for those in mortgage stress are and remain consistently higher.

Mortgage stress is assessed on a cash flow basis, where, based on our 52,000 household rolling annual survey we measure income and outgoings for households, including mortgage repayments. Where the cash flow is net negative, households are in stress. They are required to draw down on savings, put more on credit cards or hunker down – one reason the retail sales data yesterday at o.2% in September was so weak. Stress is based on current circumstances.

We also model the probability of default ahead over the next 12 months, which is a predictive estimate and we expect defaults to continue to rise – we are seeing worrying signs in both New South Wales and Victoria now as economic conditions in these states weaken. Job losses in retail and construction are leading the downturn. But underemployment is widespread. On the other hand, Canberra, with higher public sector wages, is more insulated from the reality elsewhere.

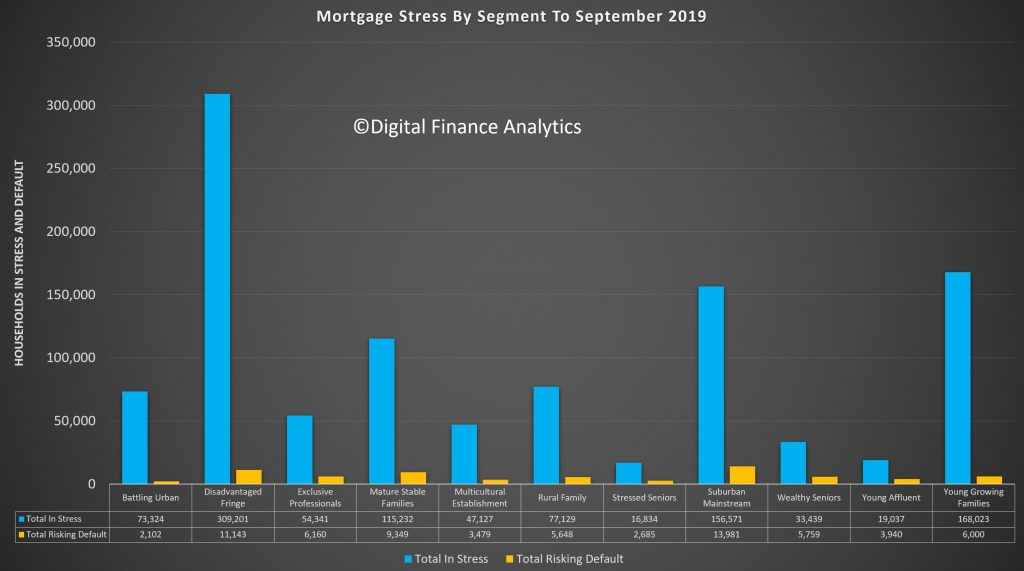
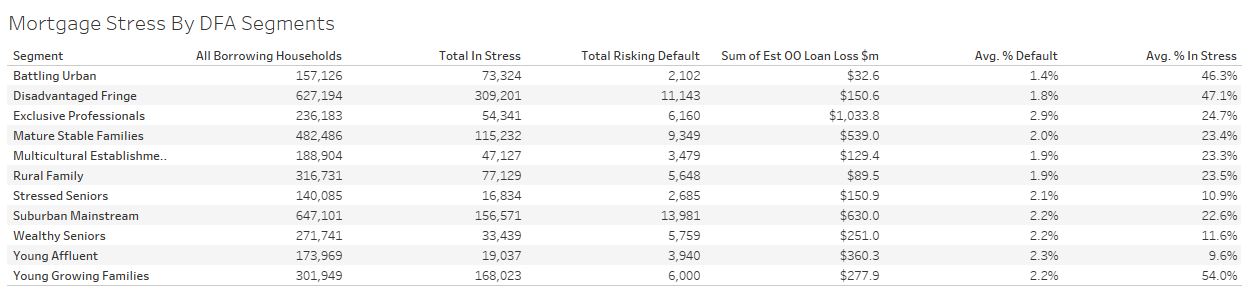
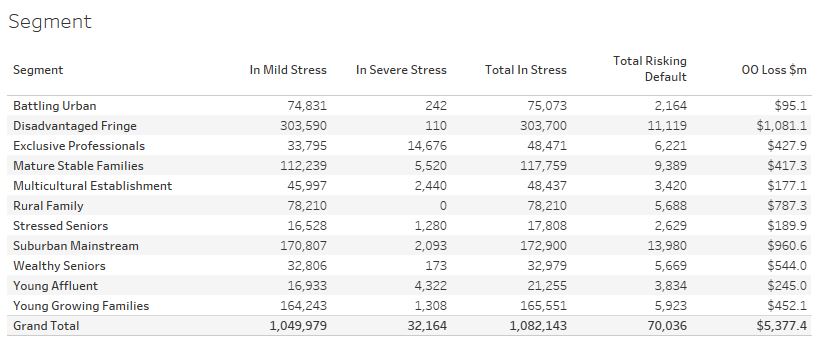
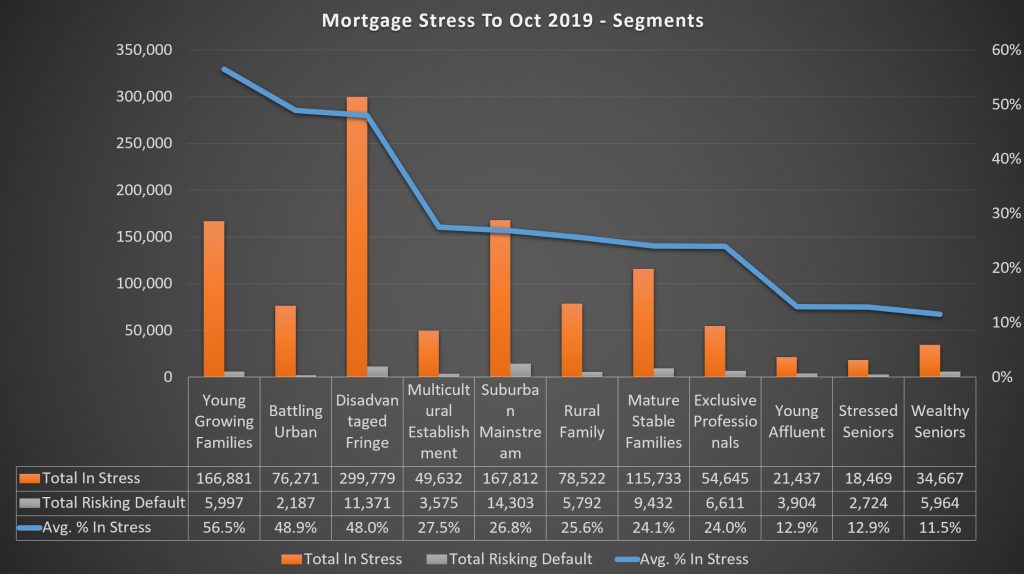
Across our household segments more than half (56.5%) of Young Growing Families are in stress, accounting for more than 166,000 households; followed by Battling Urban at 48.9% or 76,000 households and Disadvantaged Fringe at 48%, with nearly 300,000 household. Rural households are under pressure thanks also to the drought, with 25.6% in mortgage stress, or 78,500 households and even the most affluent segment – Exclusive Professionals are 24% in stress with 54,600 households. In other words mortgage stress is appearing in every sector of society.

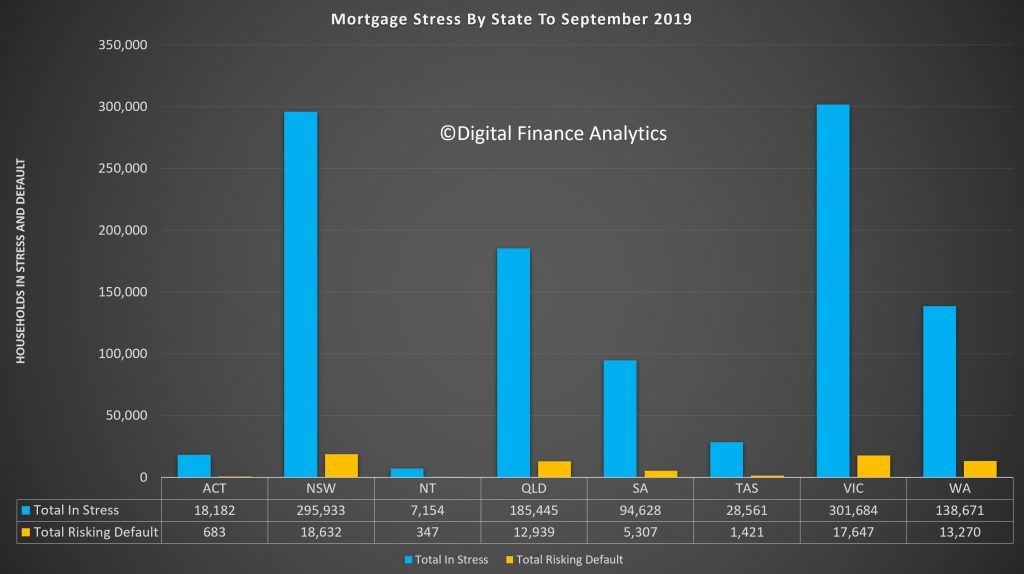
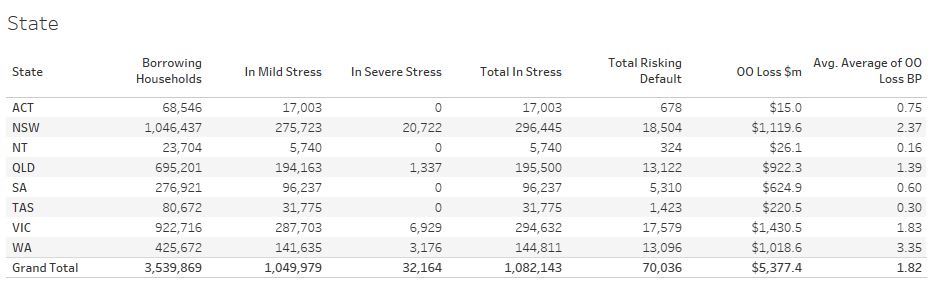
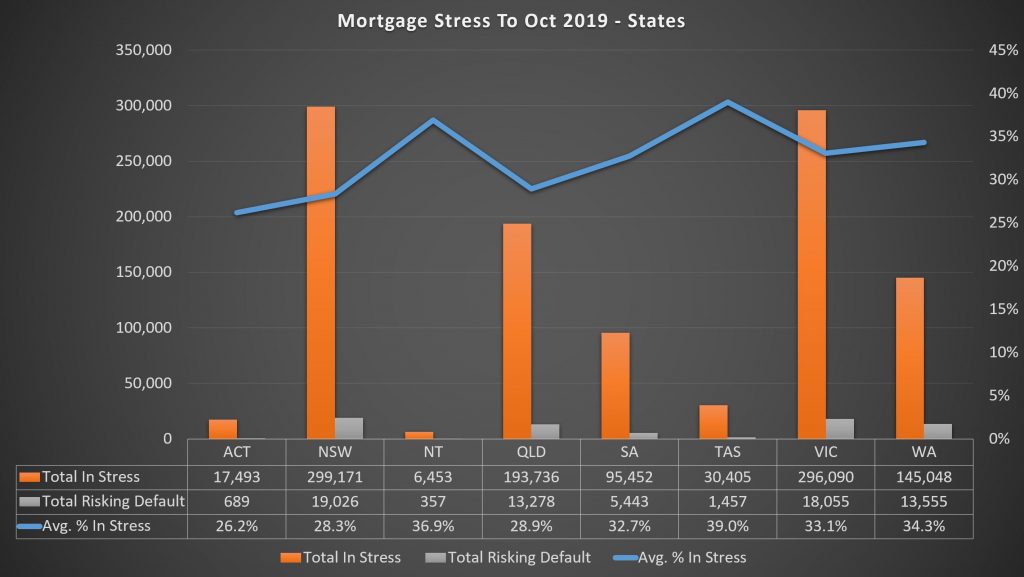
Across the states the highest proportion of households in stress are located in Tasmania (39%) and Northern Territories (36.9%), although the number of households is relatively low. New South Wales now has nearly 300,000 households in difficulty or 28.3% of households, and Victoria has 296,000 households in stress or 33.1%. We have been tracking the spike in Victoria in recent months. However, Western Australia has 34.3% of households in stress, or 145,000 households and conditions continue to deteriorate there with more foreclosures in train, as banks speed up their resolution processes.

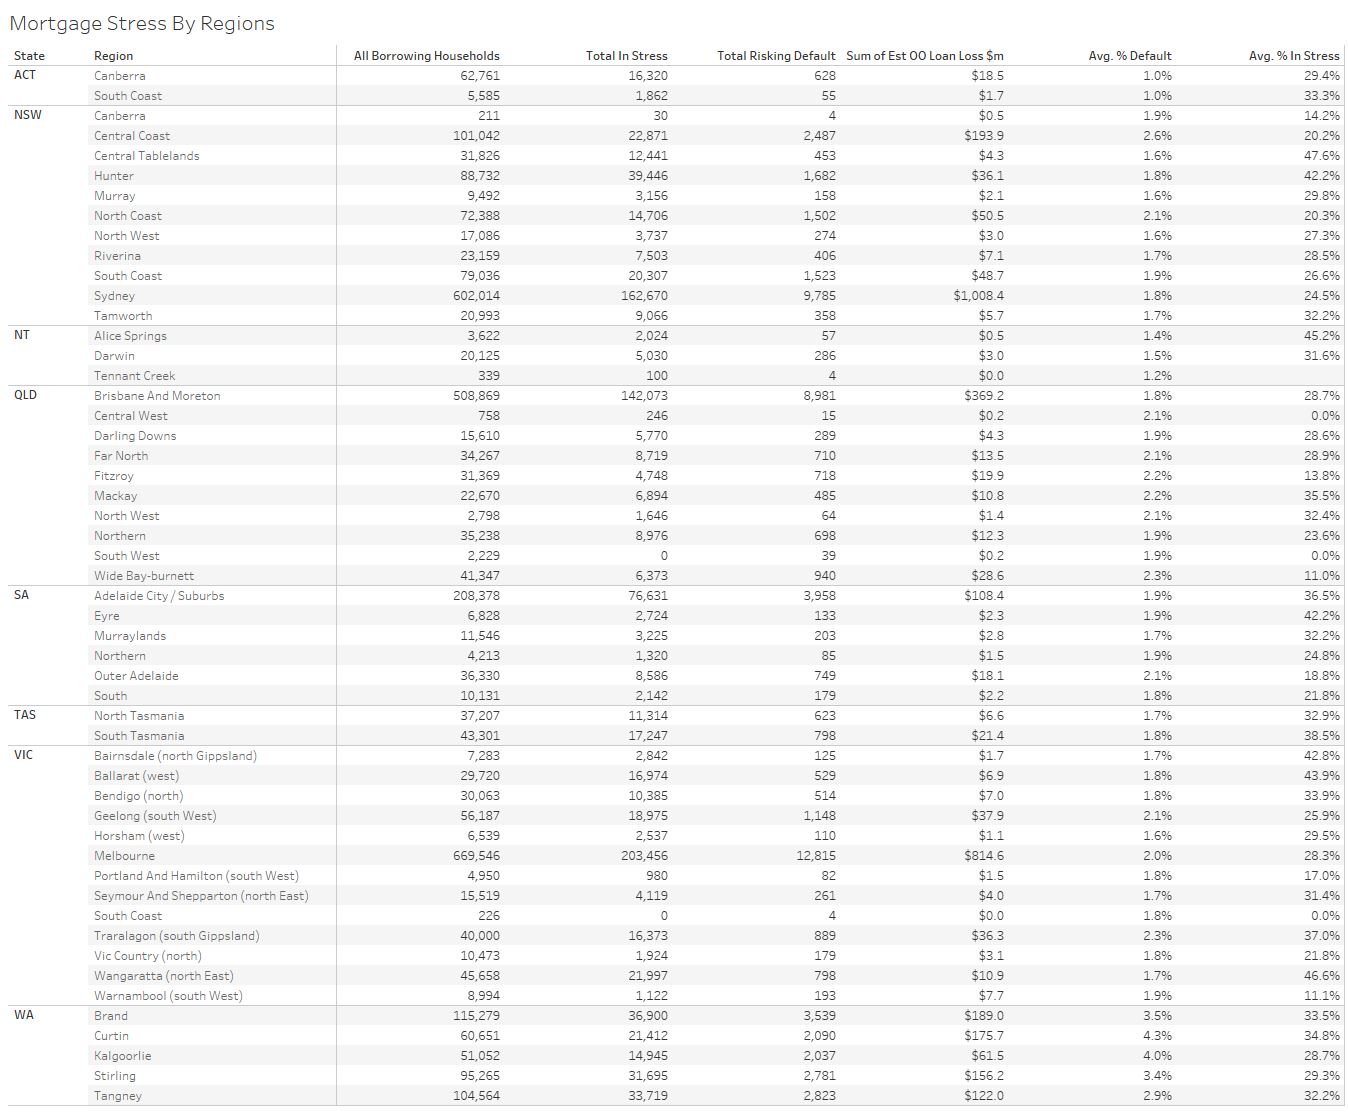
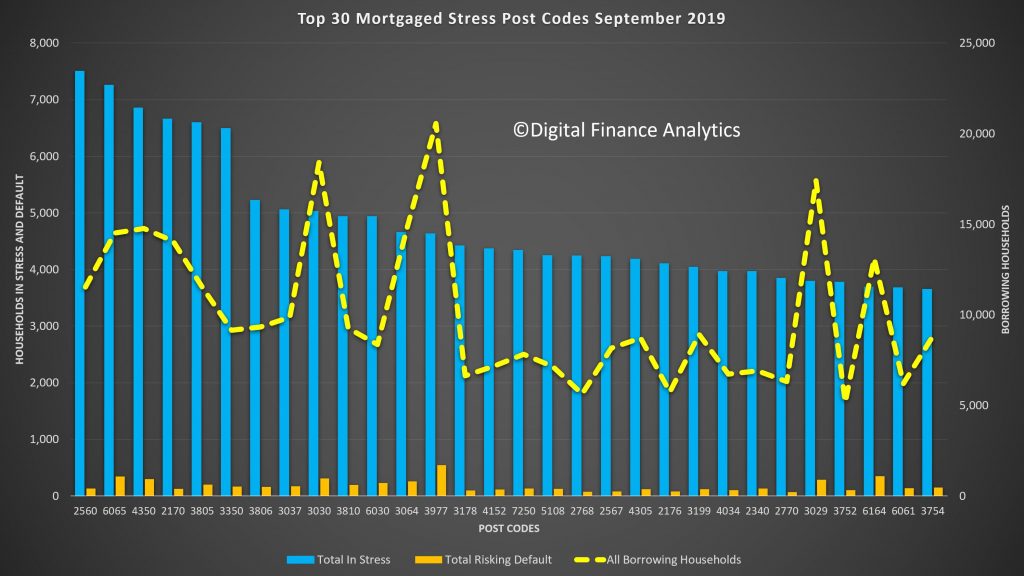
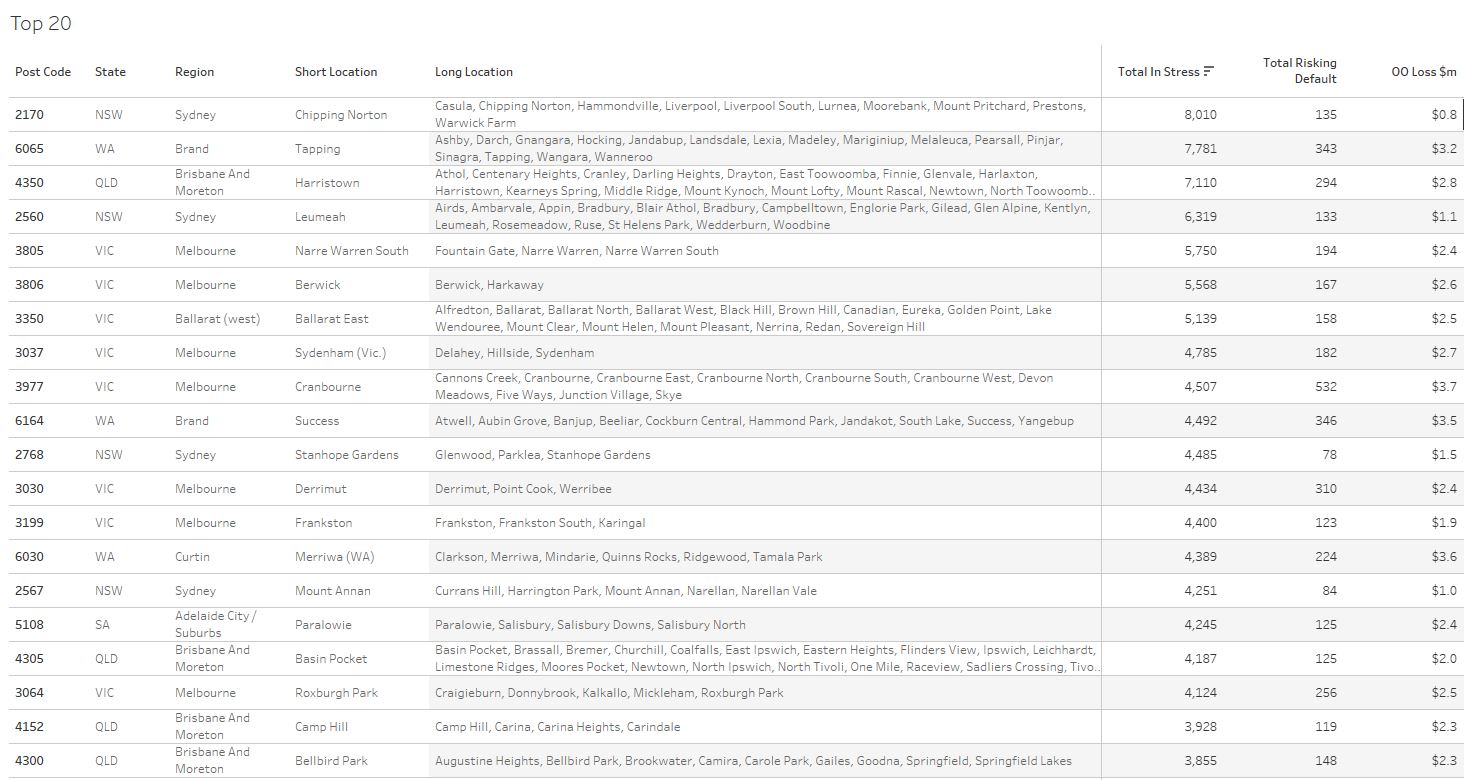
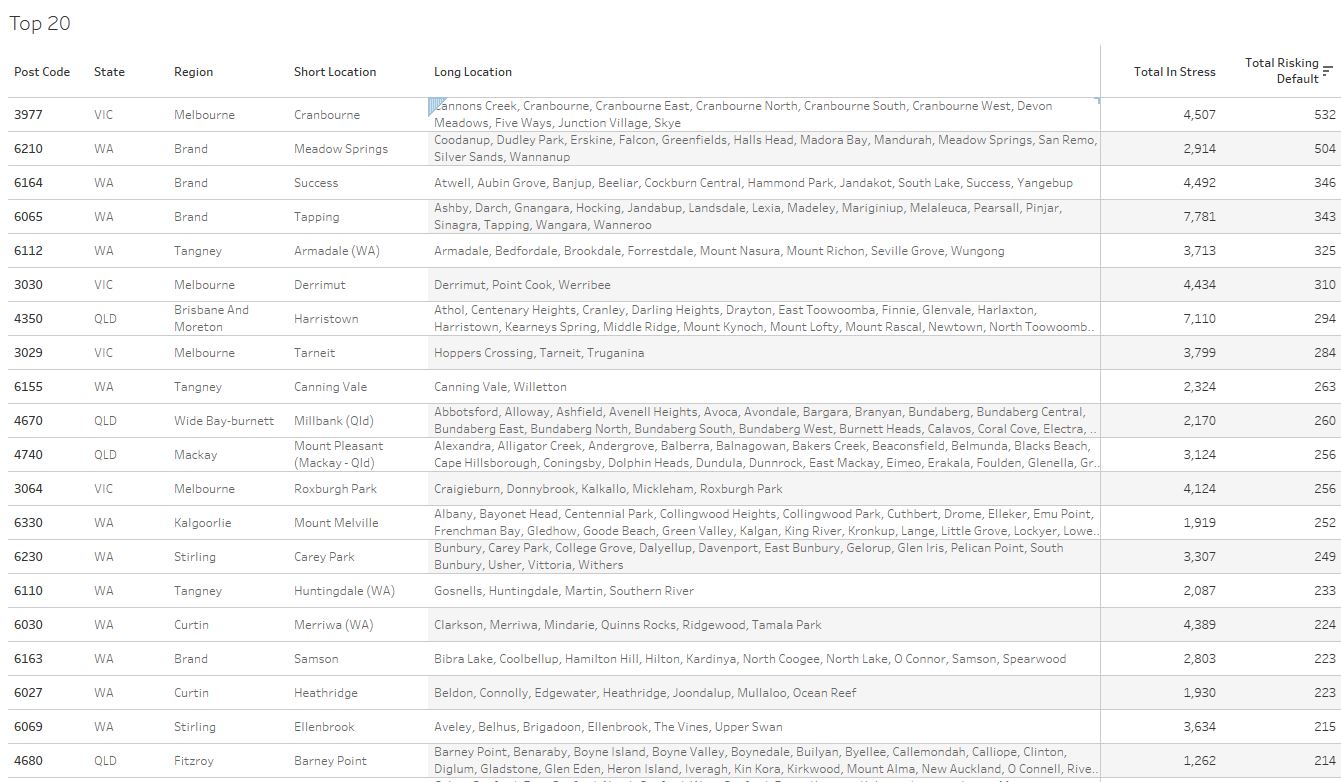
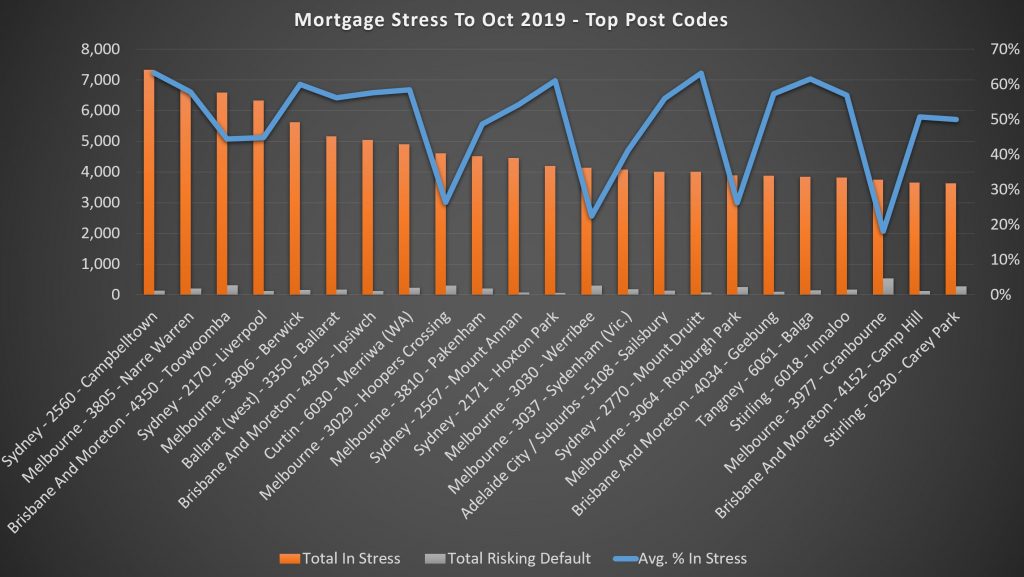
We analyse stress to post code level, and can identify those postcodes with the largest count of stressed households. Post code 2560 – the area around Campbelltown has the highest count, with 7,300 in stress or 63% of households. Next is Melbourne post code 3805, including Fountain Gate and Narre Warren with 6,600 stressed households representing 57.8% of households. Third is Toowoomba in Queensland with 6,500 households, representing 44% of households in the district, and fourth is 2170 around Liverpool in New South Wales with 6,300 in stress or 44.8% of households. A common characteristic are areas of high urban expansion on the fringe, with many new builds competing with existing property, and many recently purchased. That said, stress can take several years to emerge, and there are pockets of pain from purchases made several years ago.

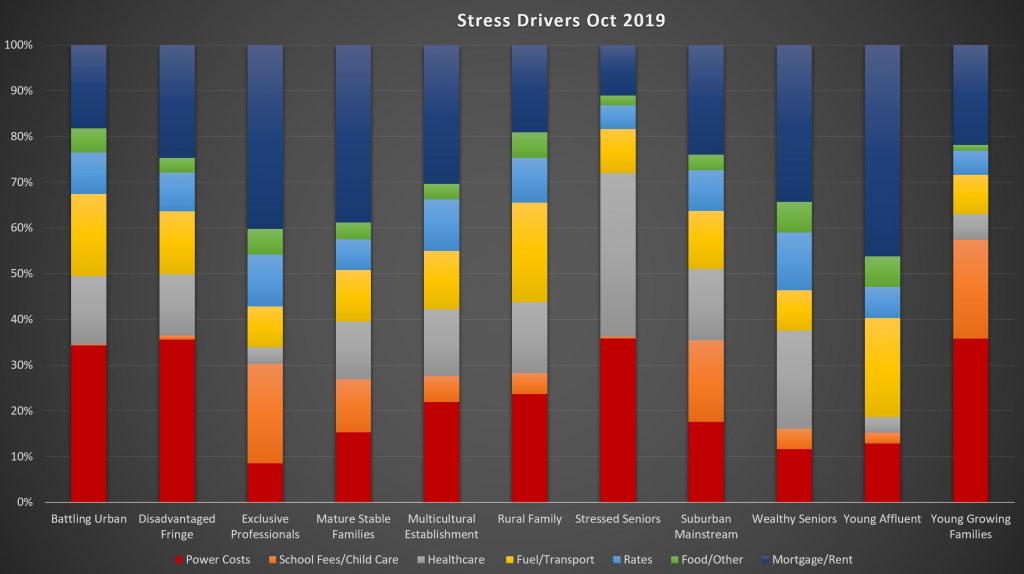
Finally, we also examined the expense drivers of stress from our surveys. These vary across the segments with power prices, school fees and child care, all significant, as well as housing costs overall.

This is likely to drive stress higher unless real wages start to improve, but given the current economic outlook that appears unlikely for now.

DFA Latest Scenarios And Live Event October 2019 (HD Edited)

We ran our live event last night. This is the edited edition in which we discussed out latest scenarios.

The original version, with live chat replay is also available. Formal show starts at 34 mins in.

Volatility Rules – The Property Imperative Weekly 5th October 2019

The latest edition of our weekly finance and property news digest with a distinctively Australian flavour.

Contents:

0:28 Introduction
1:04 Global Growth Slowing
3:38 US Markets
9:30 Euro Zone
11:15 UK and Brexit
12:38 Metro Bank

14:30 Australian Segment
14:40 Economics
15:21 Property
22:15 Bank Competition
25:15 ASIC and CBA
26:30 Australian Markets
27:30 Outlook

Rate Cuts Are Offsetting Mortgage Stress Rises

The latest data released today by DFA is our mortgage stress analysis to the end of September 2019. This is derived from our rolling 52,000 household surveys.

Mortgage stress examines the cash flows of households, relative to their mortgage repayments. If there is a deficit, households are in stress, and if there is a significant shortfall, they are in severe stress. This is current data. We also project forward expected losses and defaults in the year ahead. This is an estimation.

Overall there was little change in the past month, with 1.07 million households in stress, which equates to 32.1% of borrowing households.

The latest RBA data show the debt to income ratios of households deteriorated further to June 2019, to a new record of 191.1. This is high on a local and international basis! Yet more debt is being encouraged by the Government and Regulators.

Our surveys indicate that there has been no real rise in incomes relative to costs, and it is the rate cuts, which have filtered through to some. This has limited the growth in stress, which remains at an all time high.

Analysis by the proprietary DFA segmentation modelling brings out some important differences across cohorts.

Across our segments, (click on the table for a full view above) young growing families have the highest levels of stress, with 54% registering a financial flow shortfall. Our battling urban and disadvantaged fringe groups also registered 46.3% and 47.1% respectively. Fourth highest at 24.7% is our exclusive professional segment, a group with bigger loans, incomes and property prices, but also carrying the highest estimated loses ahead. Just over 22.6% of suburban mainstream households, our largest single segment are also in difficulty.

Some will sustain their cash flow by refinancing to a lower rate if they can, draw down on deposits – one reason why the savings ratio is falling, put more on credit cards and other loans, or simply cut back on spending, with a focus on a reduction in discretionary items. Severe stressed households eventually are forced to sell.

Our more detailed regional analysis shows some important variations, with some regional areas, and Tasmania under pressure, alongside urban centres in the West. The ongoing drought is having a significant impact now.

And finally, here are the top 30 across the country, down to a postcode level sorted by the absolute number of households in stress.

2560, which includes Campbelltown leads the way, then 6065 which includes Tapping and Wanneroo. Third is 4350, which includes Toowoomba, fourth 2170 including Liverpool, and fifth is 3805, which includes Narre Warren and Fountain Gate. These are all areas of high new development, on the urban fringe, with large properties on very small lots.

In a future post we will publish the post code mapping and we will update the modelling again next month. The question is, will ongoing rate cuts be sufficient to cap stress, or will it start to accelerate again as the economy weakens?

DFA Updates Scenarios And Answers Questions – Replay

We ran our September 2019 live event last night with strong participation from our audience. During the show we discussed our updated scenarios (based on a starting point of August 2018) and answered a range of questions on property and finance.

The edited edition of the show is available to view in replay. This excludes the pre-show and live chat, but does include some behind the scene glimpses.

Our scenarios present a range of alternative outcomes, looking 2-3 years out. “Business As Usual” is based on the RBA’s view, with some tweaks – as we do not believe unemployment will fall to their target of 4.5%! Here there is a path to higher home prices, though with falls later as the current “recovery” reverses.

Things Can Only Get Better” – is our view of the fading local economy without significant international economic disruption, with unemployment rising, as retail and construction slows, countered by additional Government intervention within their “surplus” limits. Here home prices fall once again.

Not Yet Doomsday” is our scenario where international economic conditions deteriorate (China, US, Brexit Etc…) as global growth slows. This has a significant impact on the local economy and the spillover effects drive the Australian economy into recession. As liquidity pressures emerge one bank will need assistance.

Armageddon” is where we get a GFC 2.0 type event, with global liquidity under pressure, and banks needing to be rescued by either bailing in or bailing out. The spillover impacts will be significant (as once again tax payers or households end up picking up the tab. More QE will follow.

Finally “Doomsday” would be the case where Central Banks and Governments allow banks to fail, with all the knock-on consequences.

As well as estimating the impact on unemployment and home prices we also weight the probability of each outcome. This is updated each month as new information arrives via our Core Market Model.

The original live stream recording is also available, with the show commencing at 30 mins in to allow for the live chat replay.

More Weak Consumer News And The Pressure On The Mutuals

We review the latest APRA data, consumer sentiment, and other burning issues.

https://www.westpac.com.au/content/dam/public/wbc/documents/pdf/aw/economics-research/er20190911BullConsumerSentiment.pdf

https://www.apra.gov.au/publications/quarterly-authorised-deposit-taking-institution-statistics

Household Financial Confidence Firms A Tad

Digital Finance Analytics has released the latest in our series of the Household Financial Confidence Index to end of August 2019. The reading this month was just a little higher at 85.45 (85.43 last month), but still well below the 87.69 back in 2015, which was the previous low, and significantly below the neutral setting. No wonder households are not spending!

Across our wealth segments, those owing property mortgage free remain the most confident, while those with mortgages are less confident, along with renters.

Within the property segments, owner occupied borrowers are a little more confident this month as the mortgage interest rate cuts work through. Property investors are still well below the property inactive group, as rental streams are easing back, and values of high rise apartments in particular are being questioned, thanks to the recent coverage of faulty construction and flammable cladding. In most centers those seeking to rent have more choice, and lower rental options than a couple of years back.

Across the states, the confidence factor are clustering as NSW and VIC continue to weaken, while SA and WA both move a little higher.

Looking at the moving parts within the index, job insecurity rose further in the month, up 1.38% to 38%. We continue to see higher levels of underemployment and fragmented employment, reflecting the changing work environment, gig economy jobs plus falls in the retail and construction sectors. More jobs are in the lower-paid health care and aged care segments. The drought is also causing issues now for some.

Savings are taking a battering as bank deposit rates continue to tumble, and other households continue to raid savings to maintain lifestyle. There are of course limits to how long this can go on. More than 3 million households rely on income from deposit accounts, and some are considering more risky options, while others have decided to sit tight and just spend less. Again, the myopic focus on mortgage rates misses the issues many savers are facing.

Lower mortgage interest rates have provided some relief to mortgage borrowers now, up 0.68% this month to 3.12%. However many households remain gridlocked with large outstanding debts, which often include credit cards as well as a mortgage. 47% are less comfortable than a year ago. Refinancing is available to some, but those with negative equity, of higher LVR loans are locked into more expensive loans.

Incomes remain under pressure, with 5.32% of households reporting higher real incomes than a year ago, up 0.57% compared with last month. 51.1% reported real incomes have fallen in the past year and 40.8% no change. The recent changes to weekend rates and healthcare rates in VIC are showing. Public sector employees continue to do better than the private sector.

Costs of living remains a black spot, with the official cpi just not reflecting the lived experience of many households. 91.6% said real costs were higher than a year ago. The rising price of vehicle fuel, healthcare and childcare costs, plus energy bills and rates all registered as significant issues. Everyday costs are also higher.

Net worth has risen for 24% of households over the last year, up from 21.84% the prior month. However 46.88% reported a lower net worth than a year ago, thanks to lower property values, changes in share prices and lower levels of savings.

In summary therefore the recent moves in property prices higher in some locations is having a net positive effect on households financial confidence – which illustrates the extent to which property is wired into household balance sheets (at least for those who own property). The critical question is of course whether this will turn into a Bull trap as the international environment worsens, or whether the recent moves to cut rates and reduce lending standards will have a material positive impact on household financial confidence ahead. Plus all the spruiking, of course.

That said cost pressures, incomes pressures, and lower returns for savers are still having a significant impact. The housing sector alone will not turn household financial confidence around. The journey back to a neutral level will be long and hard won.

Mortgage Stress Steady In August 2019

For the first time since 2015 the overall level of mortgage stress did not rise significantly in August, according to the latest research from Digital Finance Analytics, based on our rolling 52,000 household survey.

That said, the proportion of households whose cash flow is under pressure when servicing their mortgages remains elevated at 32.1% of borrowing households. This is still a record high. And average household debt to income ratios continue to rise – reaching 189.7 according to recent RBA data. This ratio, reported quarterly, includes all households, not just borrowing ones, and SME’s as well. For the one third of households borrowing the average ratio is at 550 according to our data. Banks are still willing to write loans above six times income in some circumstances.

The combination of lower mortgage rates and the tax refunds, plus some more significant wage increases in some sectors helped to stabalise the results.

The total number of households in stress is now 1,082,000, compared with 1,080,000 last month. We continue to see households across our segments coping with the financial pressures resulting from large mortgages, flat incomes and rising costs. There are a growing number of older households in difficulty.

Across the states, pressure is rising in NSW and VIC, as the broader economic trends deteriorate. The trajectory of unemployment and underemployment will be critical ahead. Relatively speaking losses remain higher in WA, where the economy has been in the doldrums for several years, but it is plausible we will see economic weakness spreading. The construction sector is under pressure, and job losses are to be expected ahead.

Mortgage stress is not just concentrated in the main urban centres, we continue to see signs in regional centres as well.

The current top 20 post codes by mortgage stress shows that Liverpool 2170 has the highest count, followed by post code 6065 in WA.

Another way to look at the top 20 is by defaults. Here Cranbourne in VIC, 3977 comes at the top of the list followed by 6210 in WA, which includes Mandurah.

Many on the list are in the urban fringe where there has been high rates of construction, often on small plots. The peak of distress is from the 2015 and 2016 cohorts, before the lending standards were tightened, but it is also the case that the journey many households take from stress, severe stress to default is one which can play out over years, not months.

We will update the results again next month.