Mortgage Stress And Default Probability Rise Again In April

Digital Finance Analytics has released new mortgage stress and default modelling for Australian mortgage borrowers, to end April 2017.  Across the nation, more than 767,000 households are now in mortgage stress (last month 669,000) with 32,000 of these in severe stress. This equates to 23.4% of households, up from 21.8% last month. We also estimate that nearly 52,000 households risk default in the next 12 months.

This analysis uses our core market model which combines information from our 52,000 household surveys, public data from the RBA, ABS and APRA; and private data from lenders and aggregators. The data is current to end April 2017.

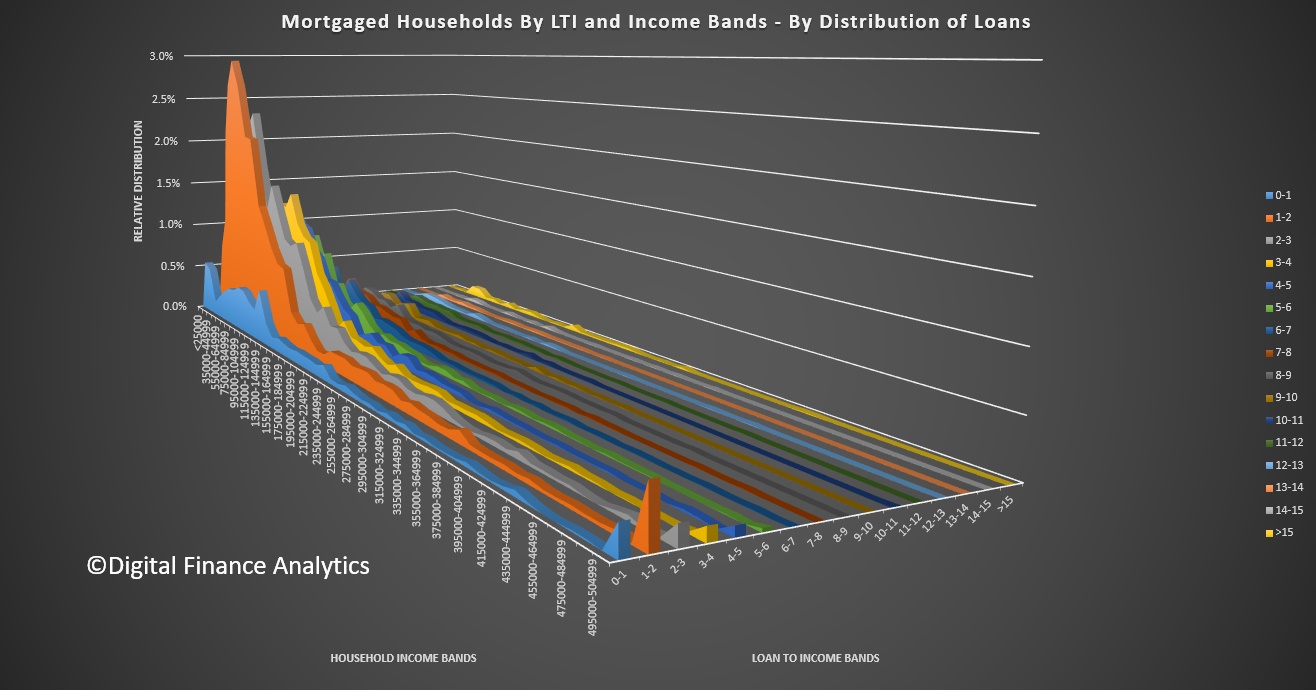
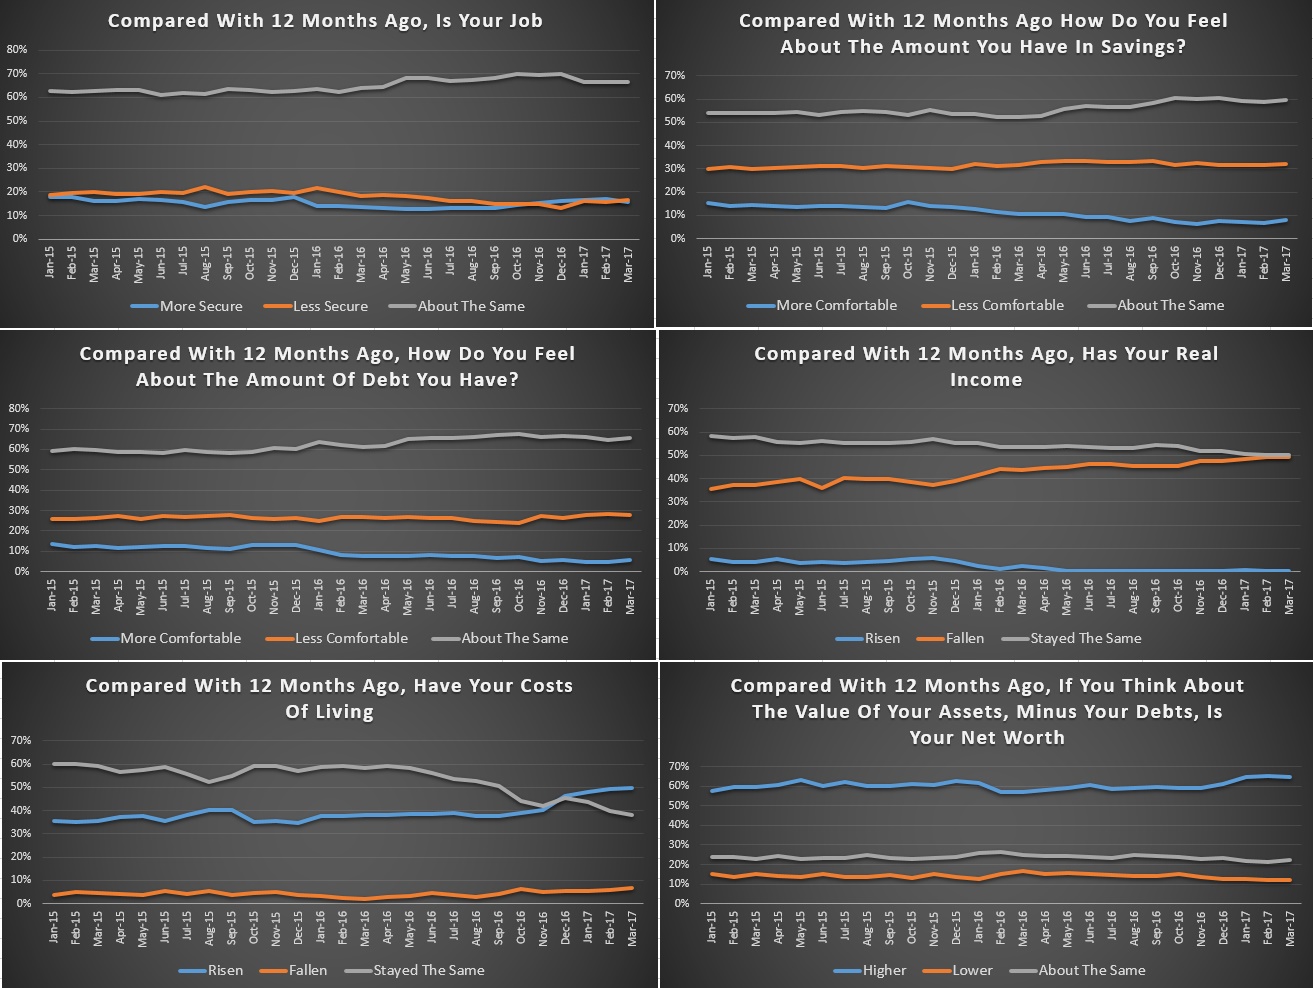
We analyse household cash flow based on real incomes, outgoings and mortgage repayments. Households are “stressed” when income does not cover ongoing costs, rather than identifying a set proportion of income, (such as 30%) going on the mortgage.

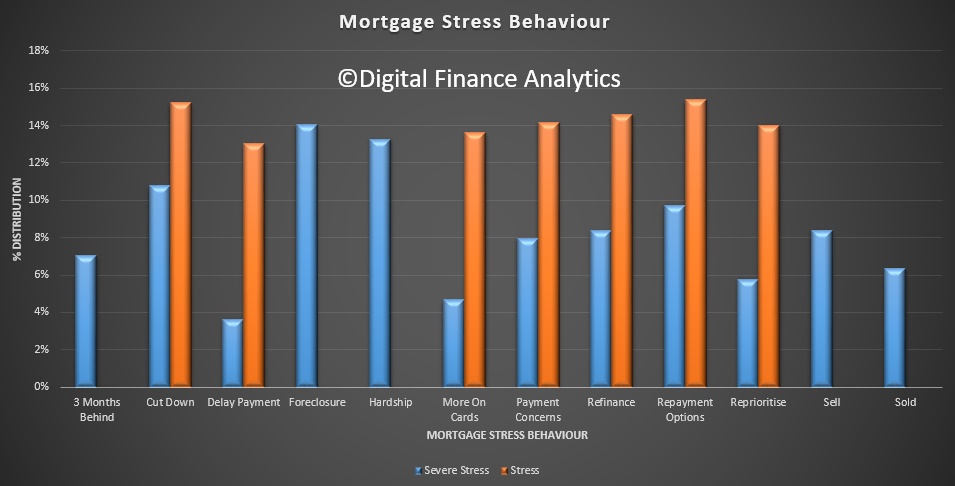
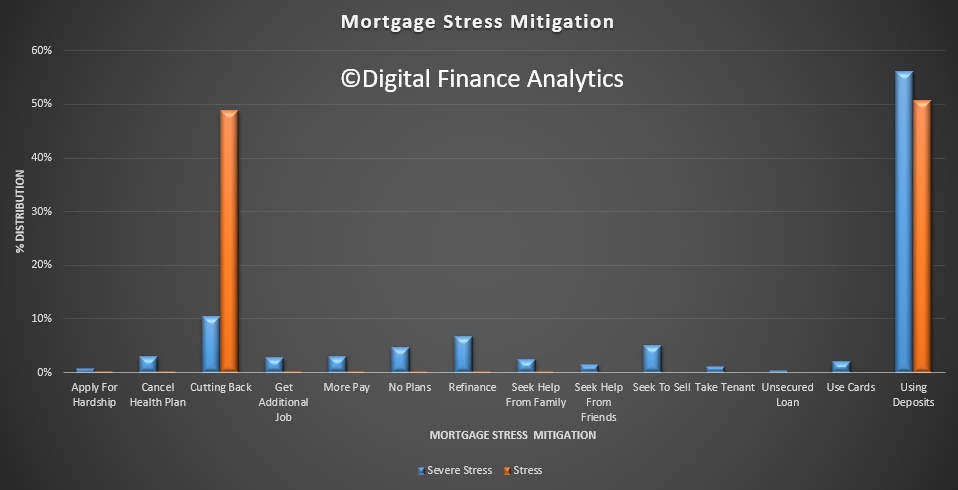
Those households in mild stress have little leeway in their cash flows, whereas those in severe stress are unable to meet repayments from current income. In both cases, households manage this deficit by cutting back on spending, putting more on credit cards and seeking to refinance, restructure or sell their home.  Those in severe stress are more likely to be seeking hardship assistance and are often forced to sell.

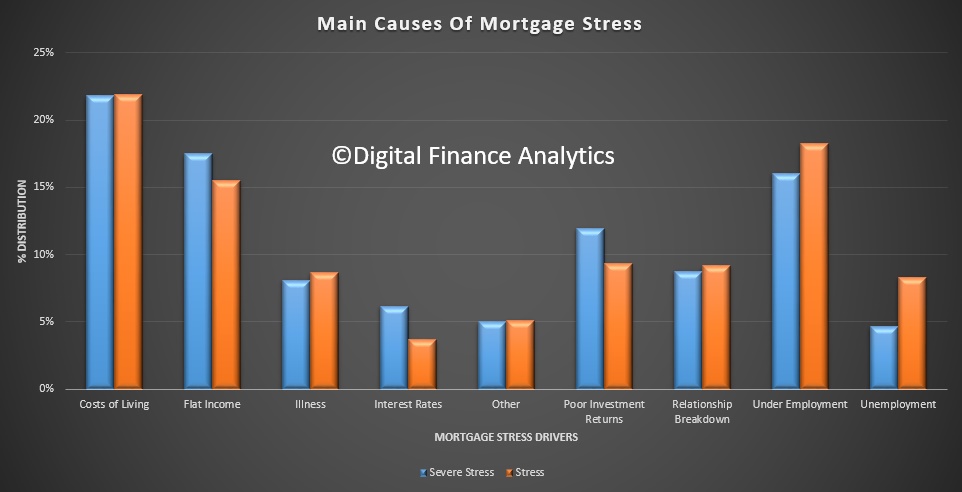
Martin North, Principal of Digital Finance Analytics said “Mortgage stress continues to rise as households experience rising living costs, higher mortgage rates and flat incomes. Risk of default is rising in areas of the country where underemployment, and unemployment are also rising. Expected future mortgage rate rises will add further pressure on households”.

“Stressed households are less likely to spend at the shops, which acts as a drag anchor on future growth. The number of households impacted are economically significant, especially as household debt continues to climb to new record levels. The latest housing debt to income ratio is at a record 188.7* so households will remain under pressure.”

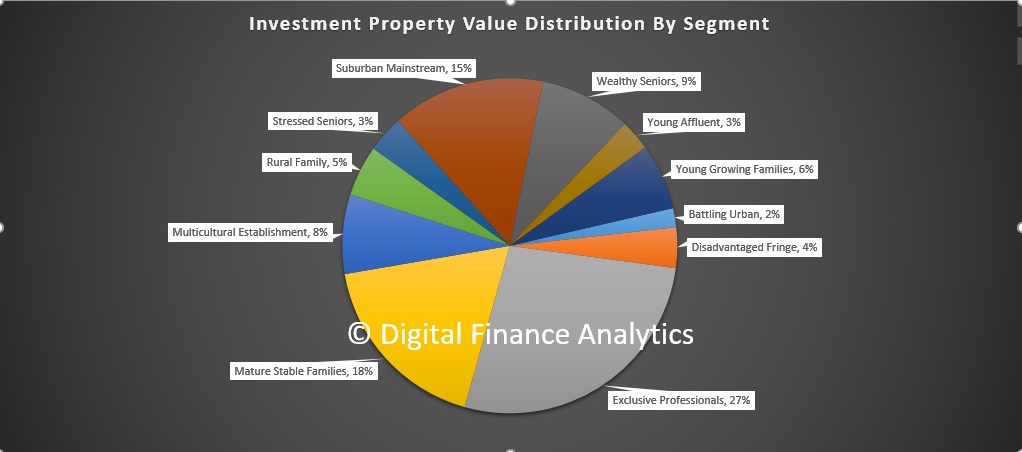
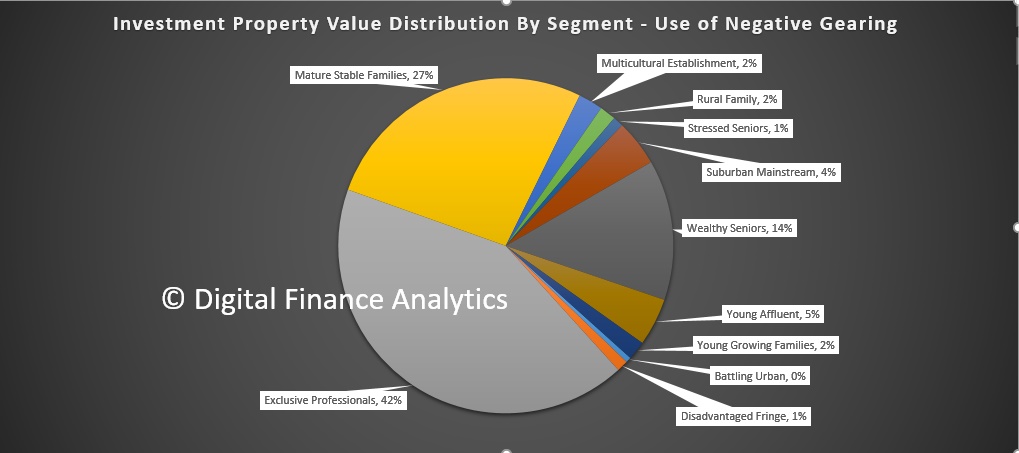
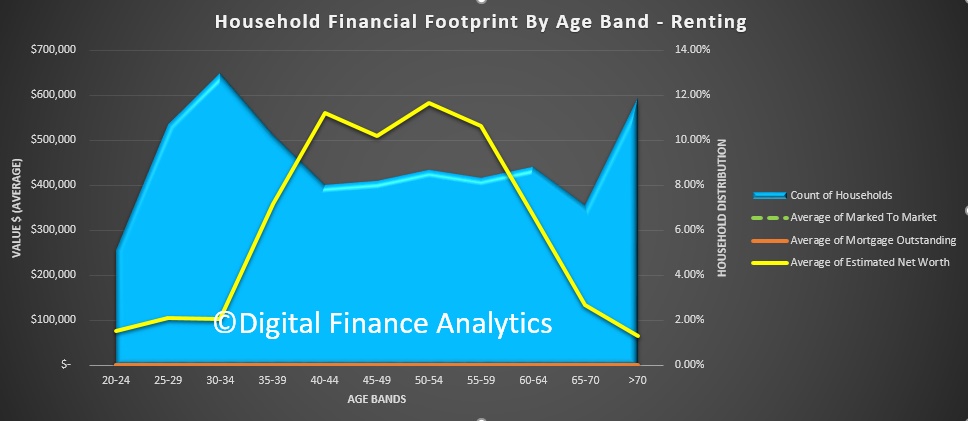
“Analysis across our household segments highlights that stress is touching more affluent groups as well as those in traditional mortgage belts”.

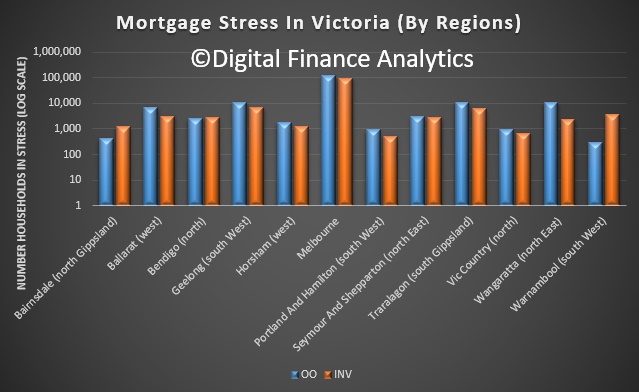
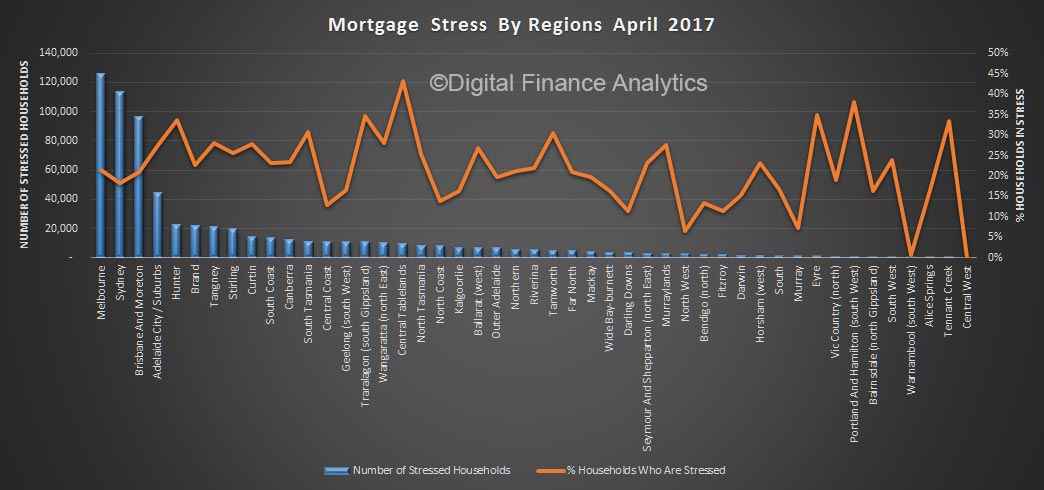
Regional analysis shows that NSW has 211,000 households in stress, VIC 209,000, QLD 139,000 and WA 109,000. The probability of default has also risen, with more than 10,000 in WA, 10,000 in QLD, 13,000 in VIC and 14,000 in NSW. Probability of default extends the mortgage stress analysis by overlaying economic indicators such as employment, future wage growth and cpi changes.

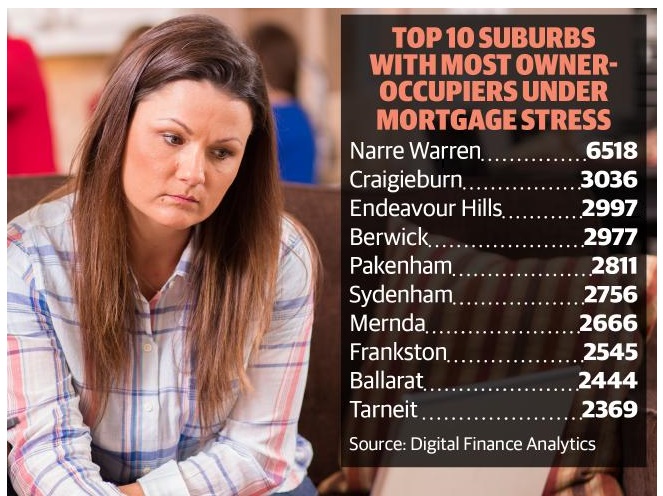
We will look at the data in more detail over the next few days and then drill down to some of the worst hit post codes.

*RBA E2 Household Finances – Selected Ratios Dec 2016.

Record numbers under mortgage stress

From The Australian Financial Review.

Record numbers of Australian households face mortgage stress as large loans and rising interest rates start to bite, according to detailed analysis of lending, repayments and household incomes.

Affluent suburban postcodes feature among an estimated 1000 households a week expected to face mortgage default over the next 12 months, the analysis reveals.

“Debt stress momentum is unprecedented,” according to Martin North, principal of research firm Digital Finance Analytics, who has been doing the survey for more than 15 years.

“This is not just about mortgage battlers. It is also hitting the households with bigger incomes and more leverage. It is worrisome,” Mr North said. Numbers of borrowers in severe distress has increased by about one-third to about 32,000 in the past 12 months, he said.

Concern that 767,000 households – or one-in-four across the nation – are facing financial distress follows last month’s warning by the Reserve Bank of Australia about increasing family “vulnerability” caused by soaring property prices, particularly in Melbourne and Sydney.

Reserve Bank assistant governor Michele Bullock said regulators may be forced to impose even heavier restraints on lenders to prevent the property market becoming the trigger for a disruptive financial crisis, said Reserve Bank assistant governor Michele Bullock.

Ms Bullock conceded that the effect of so-called macroprudential regulations imposed on the banks in 2015 to curb investor lending may be fading.

It also follows the Australian Securities and Investments Commission discovery that about 1.5 million recent loan applications matched minimum financial requirements, triggering concerns about lax lending standards.

Other prudential regulators are warning about the need to control interest-only lending because of concerns borrowers’ lack strategies for repaying principals, increasing vulnerability to financial stresses.

Digital Finance Analytics’ report is based on information from 52,000 household surveys and public data from the Reserve Bank of Australia, Australian Bureau of Statistics, Australian Prudential Regulation Authority and information from lenders and aggregators, which are companies that act as intermediaries between mortgage brokers and lenders.

Households are “stressed” when income does not cover ongoing costs, rather than identifying a percentage of income committed to mortgage repayments, such as 30 per cent of after-tax income.

Those in “severe distress” are unable to meet repayments from current income, which means they have to cut back on spending or rely on credit, refinancing, loan restructuring or selling their house.

Mortgage holders under “severe distress” are more likely to seeking hardship assistance and are often forced to sell.

“Stressed households are less likely to spend, which acts as a drag anchor on future economic growth,” said Mr North. “The number of households impacted are economically significant, especially as household debt continues to climb to new record levels.”

However lenders would be expected able to ride out a spike in arrears because they can foreclose on properties whose value has been inflated by unprecedented price growth.

State government budgets in the nation’s most populous states and territories have been boosted significantly by stamp duty charged on property transactions.

About 32,000 households are in severe distress, the analysis reveals. An additional 10,500 households in the suburban mainstream are in risk of default.

Other vulnerable community segments at risk of default include young growing families, the highly leveraged young ‘affluent’.

Most lenders are increasing rates for investors and toughening lending terms and conditions by increasing deposits and demanding more evidence that loans can be comfortably serviced by borrowers.

Commonwealth Bank of Australia, Westpac, National Australia Bank and Australian and New Zealand Banking Group have all raised investor rates in recent weeks.

Lenders are describing their strategy of slugging interest-only investors and easing pressure on principal and interest borrowers as the “new normal” because it differentiates between classes of borrowers as directed by regulators.

It’s Not Just Low Income Households In Mortgage Stress

So the banking analysts are lining up to talk about the risks in the housing market, and the potential impact on bank earnings. But the latest line being peddled is that the major risks are located among low income – small mortgage – urban fringe – households.

But this is just not true. Our household surveys, probably the most accurate and current view of households financial footprints, tell a different story. We have already explored this from a segmented perspective, and highlighted that affluent households are also exposed – they have the big incomes and life-styles, but also the mortgages to match.

Here is a different view, mapping income bands to loan to income (LTI) bands. LTI is relevant because traditionally a ratio of much above 3 times begins to look more risky, especially in a low income growth environment.

First we look at the relative distribution by count of loans. This visualisation shows that around 55% of loans are sitting in the 3 times or below LTI range, and 68% of the loans are sitting in the household income bands  below 100k. But this is deceptive.

An alternative and more concerning view is based on the value of loans outstanding. This next visualisation shows that by value the loans spread up the income bands, but also spread across the loan to income bands. In fact only 28% of loans by value sit at LTI’s below 3 times and 34% sit with household incomes of $100k or below.

So, once you take the relative size of loans into account, mortgage stress breaks the boundaries of “low income, small mortgage” households. The problem is much more deep seated, and more affluent households are some of the most leveraged, to the point where small rate rises will hurt, especially where they have both owner occupied and investment mortgages.  They are also less likely to know how to respond, whereas the battlers are use to sailing close to the wind in terms of managing a household budget.

Latest On Victorian Mortgage Stress

Today’s coverage in the Herald Sun looking at sensitivity analysis of mortgage stress in Victorian households received significant attention. Several tv news programmes tonight will continue the coverage.

Here is a summary of the current levels of mortgage stress – around 300,000 households are feeling the pain of higher mortgage rates, flat incomes and rising costs of living. Not a good formula.

As well as those in the mortgage belt, some in the more affluent areas are also in difficulty. We modelled the impact of a 2% rate rise – the number of households in pain would double.

Note also that investment property holders are also under the gun, thanks to the recent rounds of mortgage repricing, despite flat rental yields.

This could get rather nasty. The best outcome would be a period of stagnant prices, the more likely is a correction as the chickens come home to roost!

Getting To Grips With Mortgage Stress

We recently released the latest data on mortgage stress.  We said “of the 3.1 million mortgaged households, latest results from the DFA surveys of 52,000 households reveals an estimated 669,000 are now experiencing mortgage stress. This is a 1.5% rise from the previous month and maintains the trends we have observed in the past 12 months”.

Within our household data we have information on the drivers of mortgage stress, the symptoms of stress and how households are mitigating mortgage stress. Today we explore this data.

As described in our earlier post, we look for a range of leading indicators which signal mortgage stress, as well as comparing disposable income with outgoings. We do not use a “30% of gross income” measure because this is too general (there are some household not in stress with much higher proportions of income going on the mortgage, whilst others are paying lower proportions, but are in stress).

Mortgage stress is caused by a range of factors, including rising costs of living, flat incomes, underemployment, as well as unemployment, relationship breakdown and rising interest rates. There are some differences between those stressed and those in severe stress, but the portfolio of drivers are similar. Over time those stressed are more likely to turn into distressed, typically over 18-24 months.

Here is a plot of the various behavioural mortgage stress drivers, separated by those in mild stress (stress) and those in severe stress. Those in stress are actively reviewing their spending priorities, looking at alternative mortgage repayment options to reduce outgoings, seeking to refinance, are putting more on credit cards and generally cutting back on spending; all to alleviate concerns about being able to meet mortgage repayments. Meantime they may well delay making payments.

Severely stressed households are more likely to already be behind with their repayments, are seeking to sell, seeking hardship assistance, may already be involved in foreclosure, as well as the more normal activities of cutting back spending, re-prioritising, and putting more on cards.

In terms of mitigation, those in mild stress are mainly using two strategies. First drawing on existing savings (which of course are finite) and second cutting back on other spending. Most do not expect to add to their credit cards as they are often already at their limit.

However, those in serve stress, whilst they will also do the same; a wider range of activities are on the cards, including seeking to sell or refinance, putting even more are cards (often getting additional credit), cancelling health insurance, and seeking help from friends, family and even unsecured loans (like pay day loans). This is again an indication of the complexity of the situation these households are facing.

Dealing with mortgage stress is difficult, especially when incomes are static or falling in real terms and when interest rates are likely to rise further.  Yet we note that about half of those we identify as in stress do not recognise they are in difficulty. The first step to solving a problem is to recognise you have one.

Many stressed households would benefit from some objective financial advice, as dealing with this is complex. There are not many independent sources of advice available.  Whilst there is some information of ASIC’s Money Smart site, we think ASIC should put up more detailed guidance about spotting the symptoms and dealing with mortgage stress.

Many mortgage brokers and financial advisors would jump to selling more products, which is not the right solution in the majority of cases.

More On Negative Gearing Distribution – The Wealthy Benefit The Most

Last week we discussed data from our core market model on negative gearing, and using our segmentation demonstrated that some, and more wealthy segments, benefit the most.  There is room to trim the excesses, without necessarily removing gearing overall.

Today we look at another perspective, which supports this argument. We estimate that 61.7% of households with investment property are negatively geared – this has been rising significantly, as investment property penetration as risen.  Around 2.4 million households hold investment property, but not all is mortgaged or geared.

The first chart shows the value of investment property mortgages mapped to the value bands of investment property held. The orange area are households who negatively gear, the blue those who do not. This shows that the larger value portfolios have more gearing, and therefore get the greater tax benefits.  Note also the small, but important peak in portfolio values above $2m. We are seeing the rise in the “professional” investor class, or Portfolio Investors as we call them.

Another way to look at the value distribution is by the number of properties held in the investment portfolio. Again the orange area is property negatively geared, the blue, not geared.  We see a significant spike in gearing above 5 properties, as well an an expected strong distribution in one or two properties. Our modelling shows around 79% of households have one or two properties.

The overall costs of negative gearing and capital gains tax concessions are an estimated $7.7 billion annually, and three-quarters of the capital gains tax concessions are enjoyed by the top 10 per cent of income earners.

So, in our view, the Government should be looking to curtail the gearing available to multiple property holders, and limit the total amount which can be geared. Those two simple measures would take heat out of the market, reduce the tax burden and still allow “mum and dad” investors to benefit.

A categorical “NO” to negative gearing reform is a major mistake. Treasurer, please note! As it stands, as mortgage rates rise, and investment loans will bear the brunt of these rises, actually the poor tax payer pays for this, insulating geared investors from the extra costs. Treasury should be modelling the extra impost this will be on the budget.


Household Finance Confidence Wobbles

Digital Finance Analytics has released the latest edition of the Household Finance Confidence index, to end March 2017. The index fell slightly to 102.5 from 103.4, but is still slightly above a neutral setting.

Looking at the property segments, we find that whilst owner occupied households are a little more confident, property investor confidence fell, thanks to the recent noise about rising mortgage rates, possible changes to tax breaks and questions about future capital gains.

Looking across the states, confidence remains highest in NSW, but fell slightly in VIC. There were slight improvements in the other states.

Here is the scorecard which drives the index. Most striking is the fall in real incomes and small rises in concerns about job security. As interest rates rise, more households are concerned about debt. Despite this, property owning households saw their net worth rise.

By way of background, these results are derived from our household surveys, averaged across Australia. We have 52,000 households in our sample at any one time. We include detailed questions covering various aspects of a household’s financial footprint. The index measures how households are feeling about their financial health. To calculate the index we ask questions which cover a number of different dimensions. We start by asking households how confident they are feeling about their job security, whether their real income has risen or fallen in the past year, their view on their costs of living over the same period, whether they have increased their loans and other outstanding debts including credit cards and whether they are saving more than last year. Finally we ask about their overall change in net worth over the past 12 months – by net worth we mean net assets less outstanding debts.

Investor Property Footprints And Negative Gearing

The argument trotted out to defend negative gearing from reform is that the bulk of investors are “typical mum and dad” households.

Of course it depends on how you look at the data, but lets look at output from our core market model.

What we have here is the relative VALUE distribution of investment property held by our core household segments, based on marked to market values.  We see that whilst some households in most segments are represented, the relative value is massively skewed towards more wealthy segments. Exclusive Professionals, our most wealthy segment holds 27% of all investment property by value, Mature Stable families hold 18%, Suburban Mainstream 15% and Wealthy Seniors 9%.

Another way to look at the data is through the lens of our property segmentation. Here investor only segments (they have no owner occupied property) hold 33% of investment property. Within that Portfolio Investors who hold multiple properties hold 3% by value. Those holding property but with no plans to move – Holders – have 20% by value, whilst those trading down hold 19%.

When we look at households by employment type, we see that employed workers hold 62% by value, whilst 17% are help by those not working, 10% managers, 9% expert professionals, and 2% by executives.

But if we look at the use of negative gearing, we see that three segments, by value have the largest footprint. Exclusive Professionals have 42% of negatively geared property, Mature Stable Families 27%, and Wealth Seniors 14%. Other segments are much less likely to negatively gear.

Looking again by Property Segments, Investors and Portfolio Investors have 32% of all negative gearing by value, but other segments also use this technique.

From this we conclude that it is important to separate the holding of an investment property from the use of negative gearing against that property. In fact we think negative gearing is predominately used by more affluent households, and they get the biggest tax breaks as a result, which of course other tax-payers have to subsidise.

There is, in our view, overwhelming evidence that curtailing the excesses in negative gearing (for example, a $ limit) would assist in cooling the market and inject needed cash into the budget.

But as we pointed out the other day, if the political agenda wins out, this just will not happen.

Property And Household Financial Footprints

Data from the Digital Finance Analytics Core Market Model tells an interesting story when we look at households dependence on wealth from property.

To illustrate the point, here are three charts, looking at different household groups. The first is the owner occupied mortgage group.

The blue area represents the distribution of households by age bands. The yellow line shows the relative value of total net worth (assets less debt, including superannuation). The green dotted line shows the value of property, in today’s terms, and the red line the current mortgage. It is very clear that older Australians have greater net assets and smaller mortgages. It is also clear that much of that worth is from paper profits relating to property. They would take a bath if prices were to fall.

Households without a mortgage have greater worth in other savings vehicles, including shares, deposits and property. They are more insulated from property value falls, and of course would not be hit by rising mortgage rates directly.

Finally, those who rent have a lower average net worth. Younger renters have little in the way of assets, whereas older renters on average hold higher balances, partly thanks to superannuation.

The analysis reconfirms how critical property values are to overall net worth. As a nation, we are highly exposed to future price movements. Any correction, whilst it might make property accessible for first time buyers, will seriously erode the net worth of households, especially those in the older age bands. The on-flow to economic outcomes suggests the risks are real, as Phillip Lowe said last night.

Mortgage Stress Rises Again

The latest results from the Digital Finance Analytics mortgage stress modelling, released today, reveals another rise in the number of households experiencing mortgage stress.

Martin North, Principal of Digital Finance Analytics said “of the 3.1 million mortgaged households, latest results from the DFA surveys of 52,000 households reveals an estimated 669,000 are now experiencing mortgage stress. This is a 1.5% rise from the previous month and maintains the trends we have observed in the past 12 months. The rise can be traced to continued static incomes, rising costs of living, and more underemployment; whilst mortgage interest rates have risen thanks to out-of-cycle adjustments by the banks and bigger mortgages thanks to rising home prices. With the latest housing debt to income ratio at a record 188.7*, households will remain under pressure”.

Within the 669,000 households, which represents 21.8% of borrowing households, 20.8% are in mild stress, meaning they are managing to make their mortgage repayments by cutting back on other expenditure, putting more on credit cards and generally hunkering down. However, the remaining 1% of households are in severe stress, meaning they are behind with their repayments, are trying to refinance, or sell their property or seeking hardship assistance.  Households are “stressed” when income does not cover ongoing costs, rather than identifying a set proportion of income, (such as 30%) going on the mortgage.

Regional analysis showed that 193,000 households are from NSW, 175,000 from VIC, 122,000 from QLD and 85,000 from WA.  However, the largest relative proportion of households in stress are found in the smaller states of SA and TAS, where the impact of sustained low wage growth and underemployment is strongly felt.

Looking ahead, the probability of 30-day mortgage default has also risen to 1.64%, with the highest risks residing in WA where it is more than 3% in the mining belts.  “We expect mortgage stress rates to climb through 2017 as mortgage rate rise, whilst slow wage growth, and underemployment will continue to bite” concluded Martin North.

Detailed analysis shows mortgage stress continues to touch some more affluent households, who are highly leveraged, as well as the more traditional “battler” groups in the urban fringe. Younger families and recent first time buyers are under the most pressure.

*RBA E2 Household Finances – Selected Ratios Dec 2016