The latest edition of our weekly digest is published today. In the week the big banks copped it in the budget, and investor borrowing momentum is predicted to slow, we look at events over the past seven days. Watch the video, or read the transcript.
We start with the main announcements in the Budget. First there is the $6 billion liabilities levy to be imposed on the big four banks and Macquarie. Whilst many were surprised by this move, the fact is that banks around the world are getting hit with various taxes and levies and we have some of the most profitable banks in the world, not because they are really expert managers, but because of the structural issues which exist here.
Most of the tax grabs around the world are aligned to providing extra support in case a bank failures, but others are now using the income to support general government spending. In some ways the banks are easy targets, given their massive incomes, and poor public perception, but in our view the move looks more like a late tax grab to fill a hole than clear sighted policy. Of course the banks squealed, whilst smaller players suggested it might help to level the competitive playing field. Banks have so many ways to recover such an impost, that despite the mandate given to the ACCC to monitor price changes, we think consumers and small business will pay, and so it is really just another indirect tax. The Government linked the move to the earlier Financial System Inquiry as part of making Banks “Unquestionably Strong”, but this is a long bow.
We think the other developments relating to banking in the budget are perhaps more significant. APRA is to be given extra powers to supervise the growing non-bank sector, which may help to cool the supply of higher risk mortgages. Bank executives will be on a register and risk being delisted if they do the wrong thing. This is all about tightening the bank system further, and it makes good sense. It also represents a vote of no-confidence in their self-managed campaigns to improve the culture in banks, and which do not necessarily get to the heart of the issues which need to be addressed.
But it is the Productivity Commission review of the financial system, and especially the issues around vertical and horizontal integration which may have the most profound impact. Today, the large financial conglomerates control hosts of financial advisers and mortgage brokers, as well as branch networks and other channels, and play across the spectrum from retail banking, through wealth management and Insurance. But such integration means that smaller players cannot compete, and large players are able to dictate prices across the system. As a result, Australians are paying more for their financial services than they should, many sectors are making excess profits, and competition is just not working. So the big question becomes, will the Productive Commission get to the heart of the issues, and can the financial services omelette be unscrambled?
Going back to the levy for a moment, we cannot figure why Macquarie is caught along with the big four, who are classified by APRA as Domestically Significant Banks or D-SIBS. The basis of selection appears to be a quick back of the envelope assessment of the size of liabilities (less consumer deposits below $250k and Basel Capital). The fact is the major banks have an implicit government guarantee that in case of emergency they would be bailed out. As a result, they can raise funds more cheaply. This is worth way more than the 6 basis points of the levy, so you could argue they are getting off cheaply.
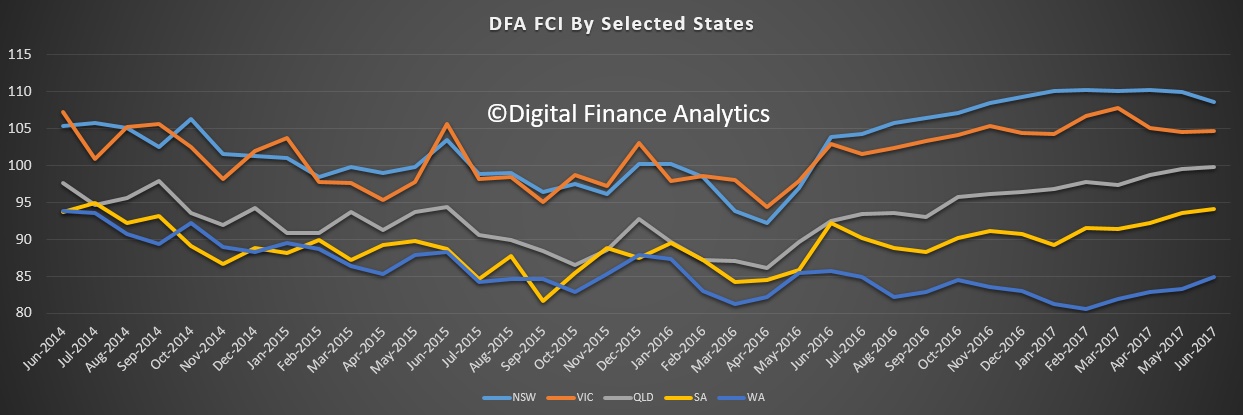
The first half results from Westpac were good in parts, but although declared profit was up, this was thanks mainly to trading income which may not be repeatable, whilst net interest income was down 4 basis points and consumer provisions were higher. Again consumer debt in Western Australia was an issue. The number of consumer properties in possession rose from 261 a year ago to 382 in Mar 17. Investment property 90+ day delinquencies rose from 38 basis points to 47 basis points. They hope the recent mortgage repricing will help to repair their net interest margin in the second half.
CBA who reported its Q3 trading update also said margin was under pressure and defaults in WA were higher.
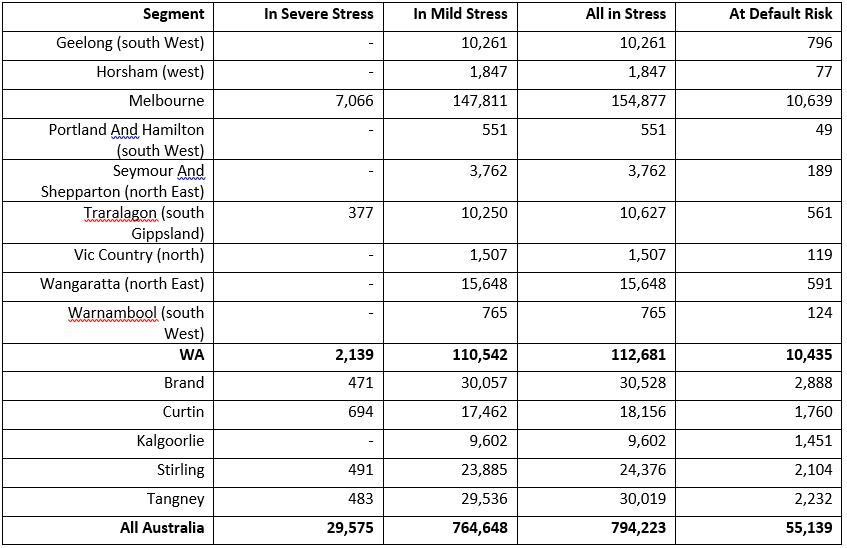
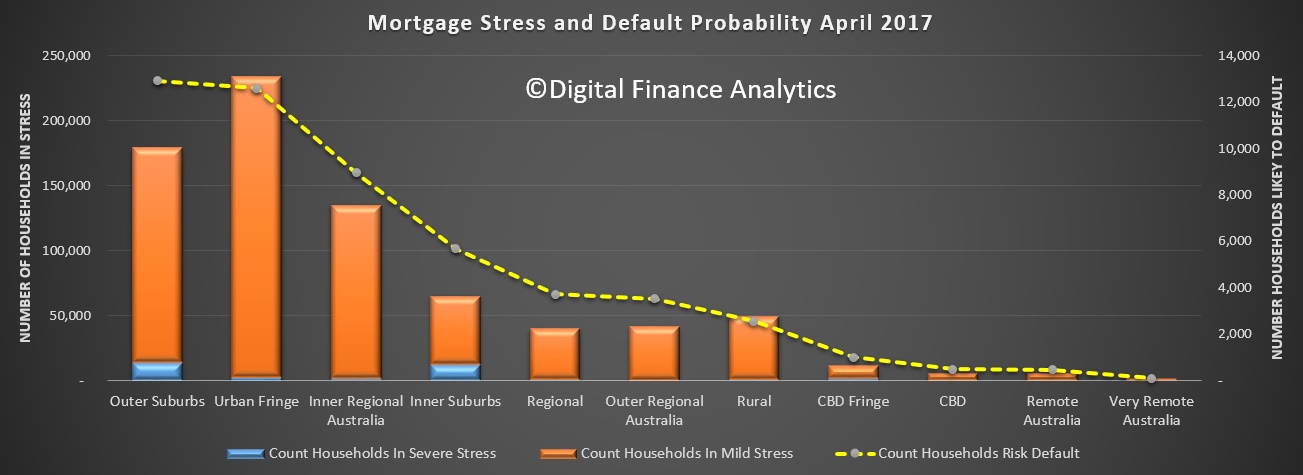
We published our top ten post codes with households at risk of mortgage default, and Western Australia came out the worst. In top spot, at number one, is 6210, Mandurah. This also includes suburbs such as Meadow Springs and Dudley Park. Mandurah is a southwest coast suburb, 65 kilometres from Perth. The average home price is around $300,000 and has fallen from $340,000 since 2014. Here there are 1,430 households in mortgage stress but we estimate 388 are at risk of default in the next few months.
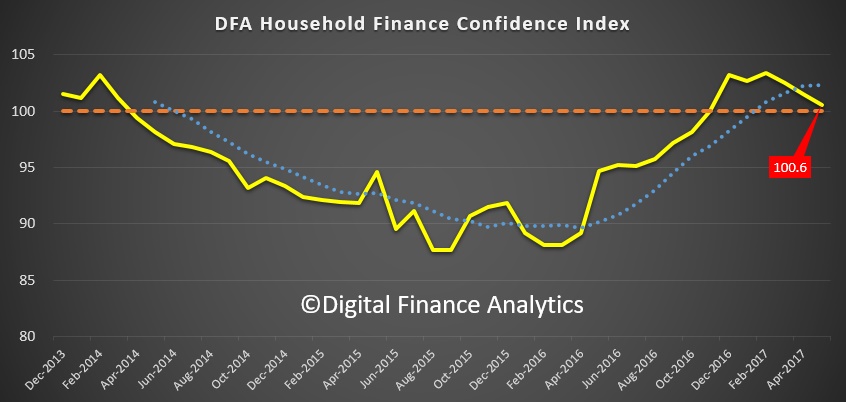
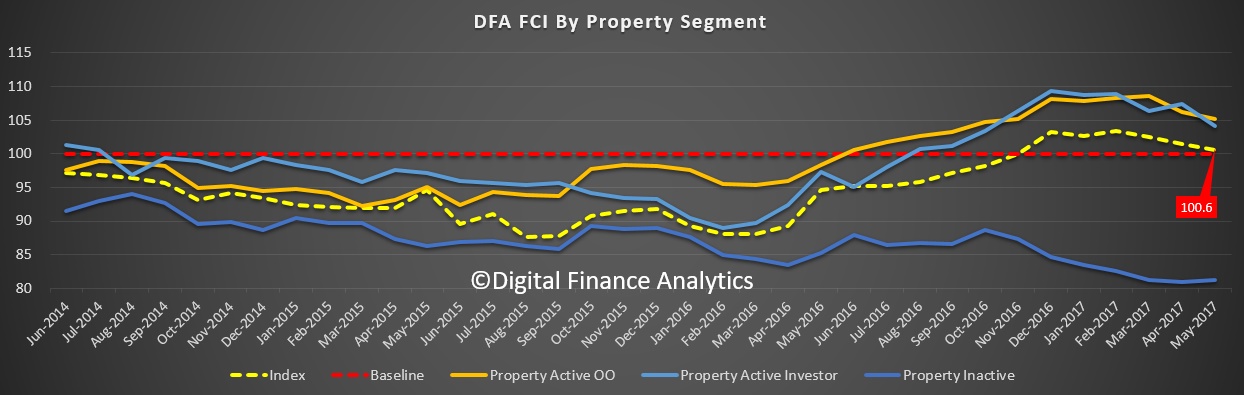
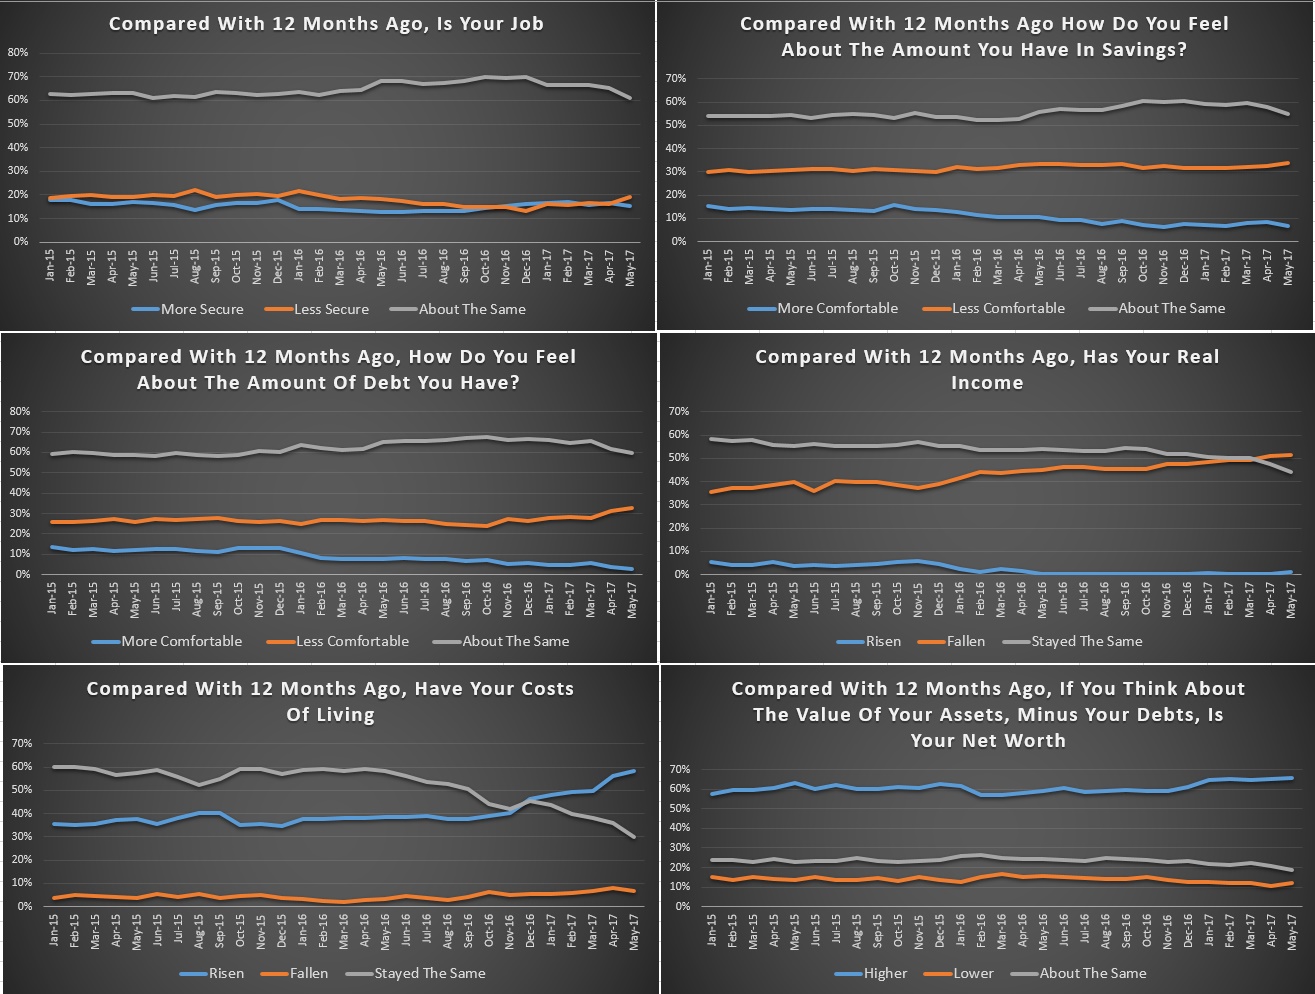
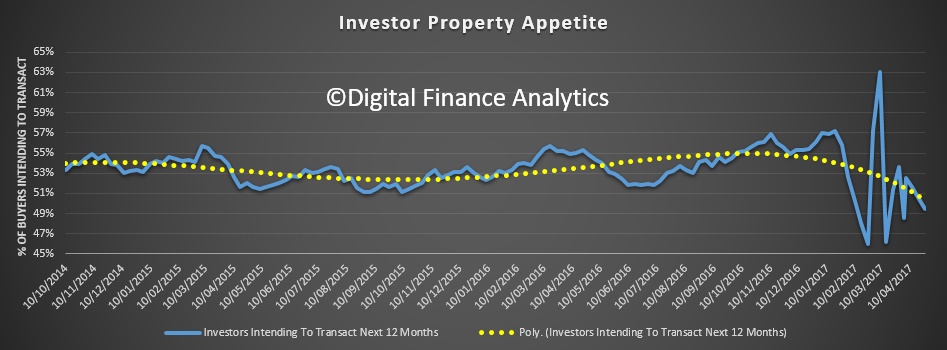
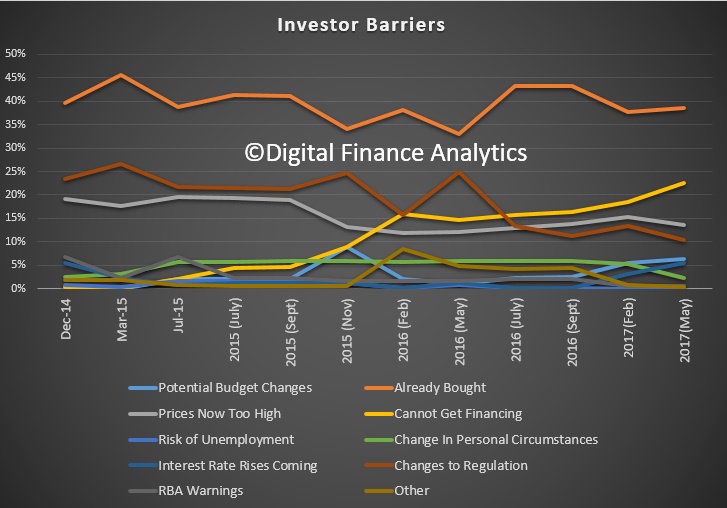
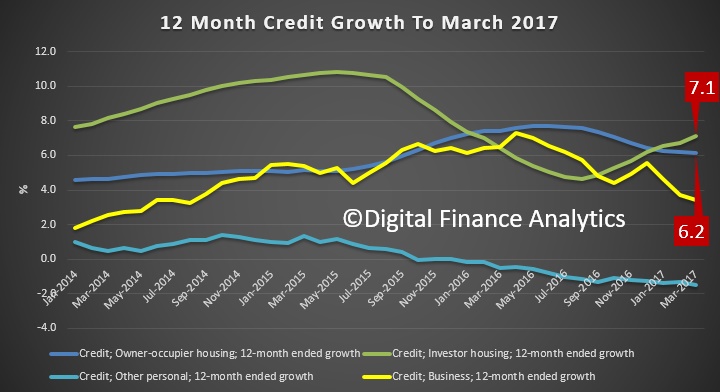
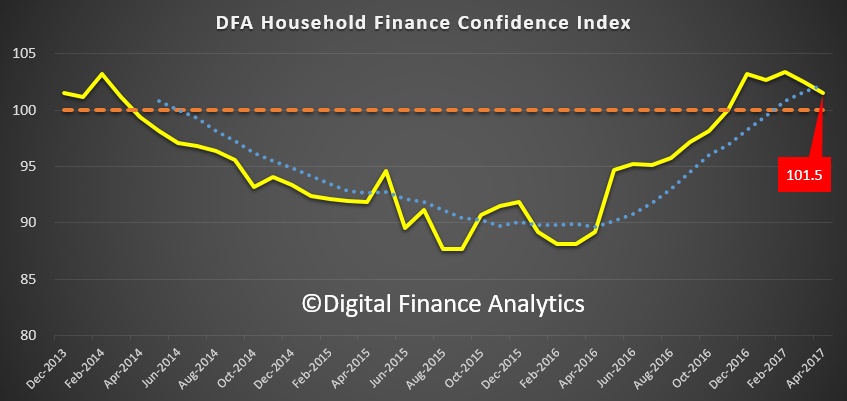
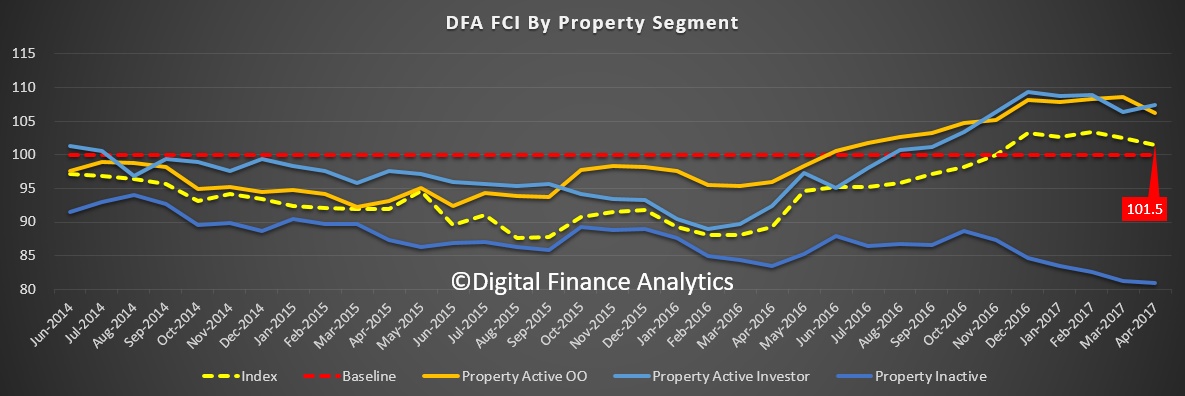
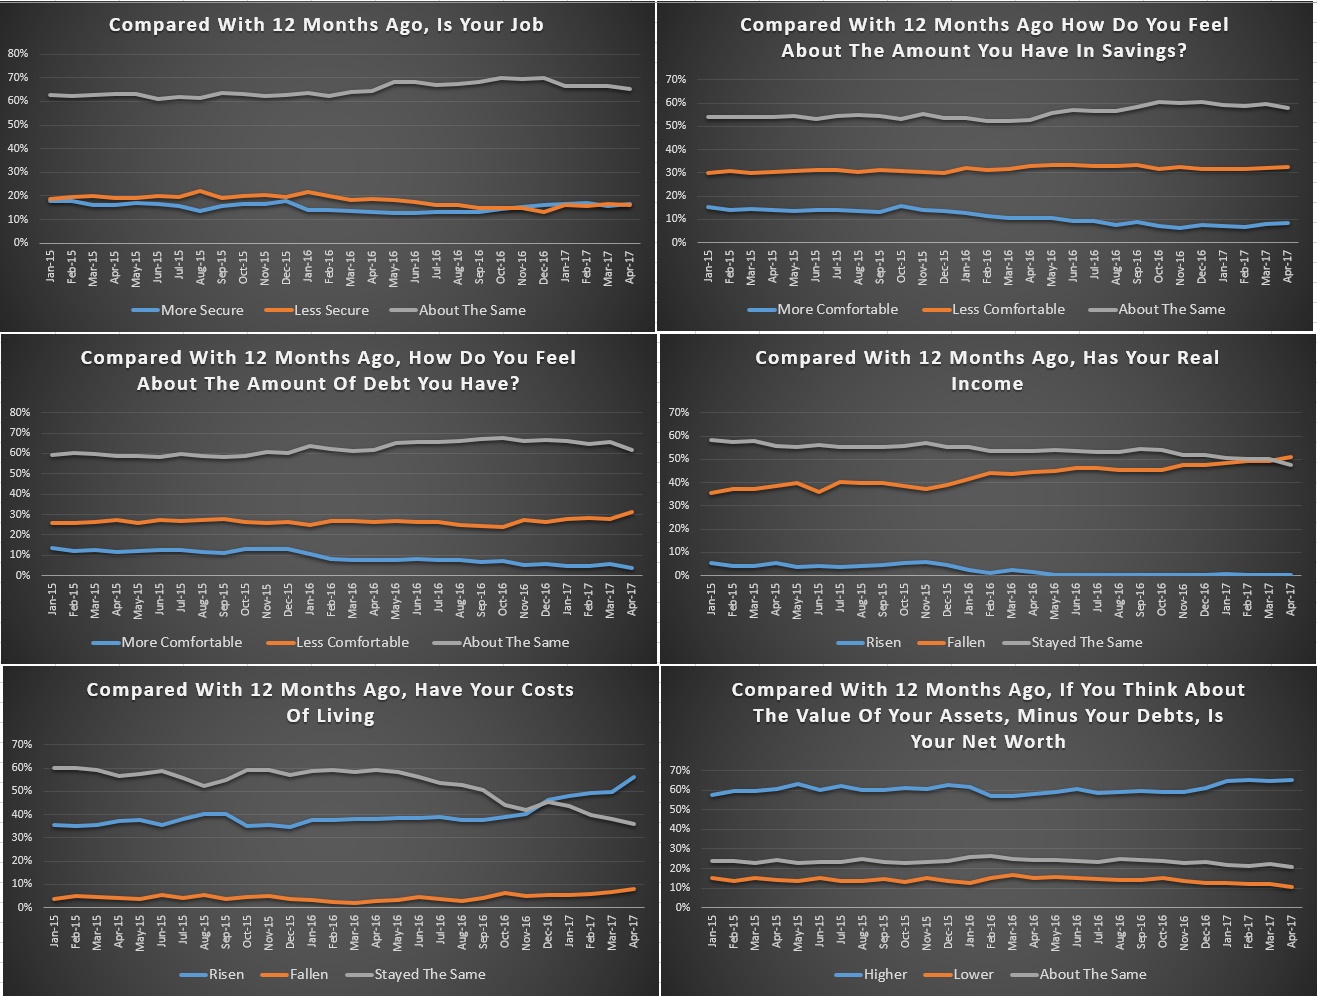
Our surveys also highlighted that financial confidence slipped in April, with investor households a little less confident, and our surveys also showed that less property investors are planning to purchase property in the next 12 months, thanks to the impact of higher mortgage rates and less availability of finance. Our core model suggest that investor loan growth is set to fall from around 7% down to 1 to 2 % in coming months. This will have a profound impact on the property market and the banks.
It may also impact the stamp duty flowing to most states. Data this week highlighted that taxation revenue from housing continued to climb. State and local governments collected about 52% of their total taxation revenue from property, a record which was worth almost $50 billion. So if property momentum does sag, there are significant economic consequences.
We also saw a sag in retail spending and in new building approvals, more evidence that the economy is on a knife edge. However, Auction clearance rates were still strong though, if on lower volumes and job adverts were stronger too, so it’s not all bad news.
And finally back to the budget and its approach to housing affordability. There was a raft of measures announced, some focussing on land release and other supply measures, as well as the option to save for a deposit in a super account tax shelter, and the ability for down-traders to put proceeds back into their super accounts (but no extra tax breaks there). One headline-grabber was the creation of a new entity, the National Housing Finance and Investment Corporation. This will source private funds for on-lending to affordable housing providers to finance rental housing development. However, the bigger issue for the sector remains federal and state funding.
There were very minor tweaks to the negative gearing tax breaks which may adversely hit investors in regional areas, but the perks remain pretty much intact. In fact, if you add up all the measures, we do not think they will fundamentally solve the housing affordability conundrum.
And that’s the Property Imperative Week. Check back next time for more news.

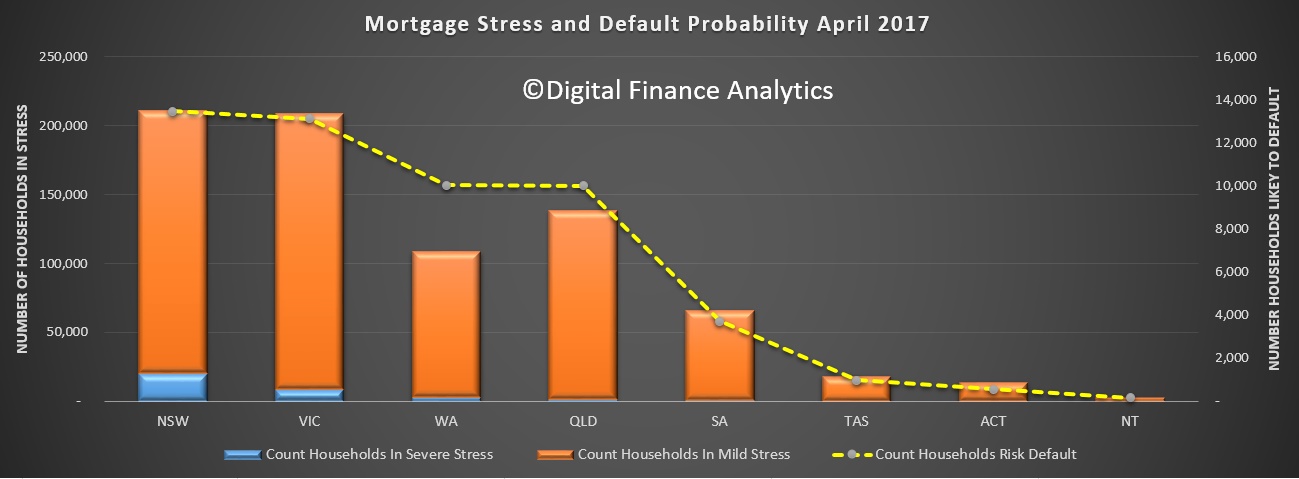
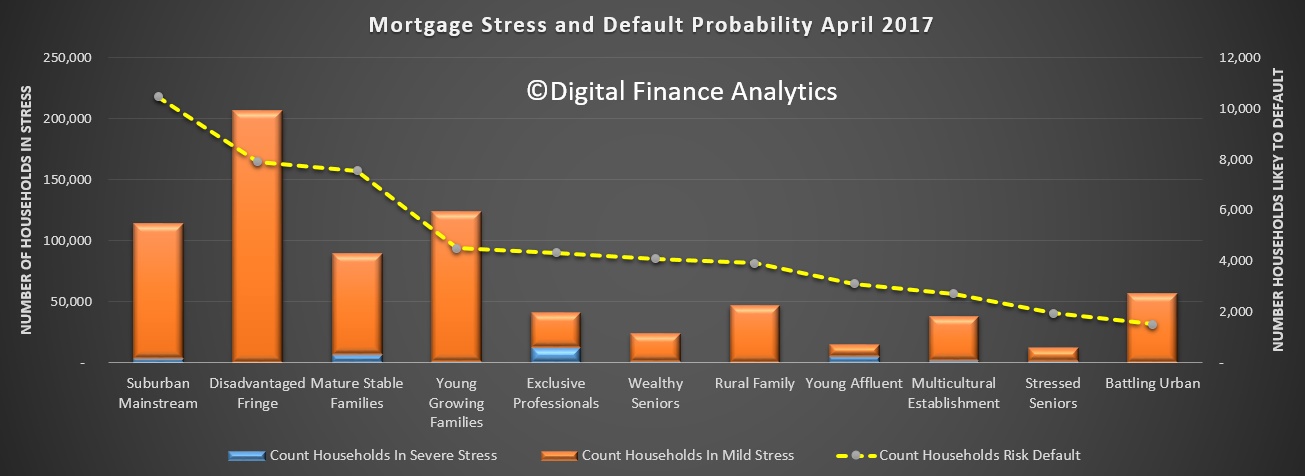
 This analysis uses our core market model which combines information from our 52,000 household surveys, public data from the RBA, ABS and APRA; and private data from lenders and aggregators. The data is current to end May 2017.
 Those households in mild stress have little leeway in their cash flows, whereas those in severe stress are unable to meet repayments from current income. In both cases, households manage this deficit by cutting back on spending, putting more on credit cards and seeking to refinance, restructure or sell their home. Those in severe stress are more likely to be seeking hardship assistance and are often forced to sell.
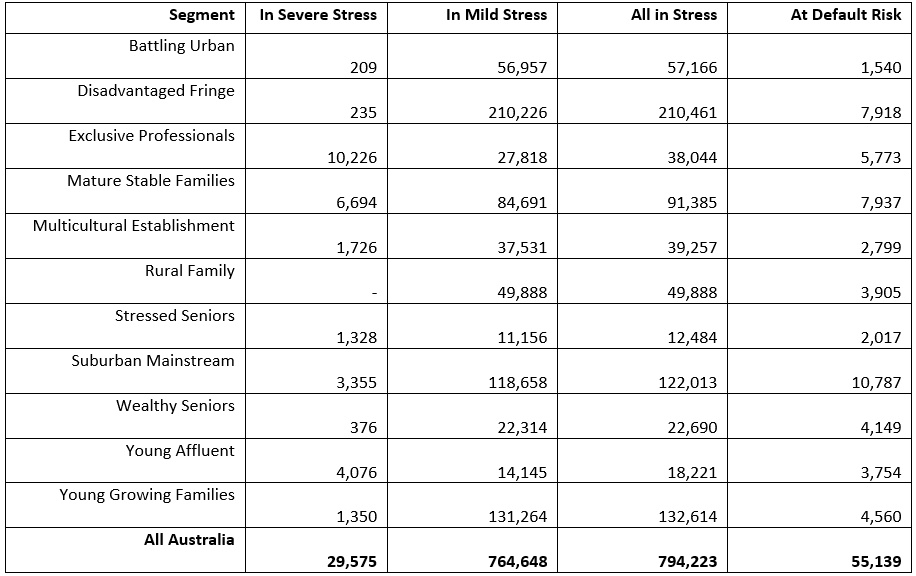 *RBA E2 Household Finances – Selected Ratios Dec 2016.