As we continue to look over the results of the latest household surveys, as captured in the recently released Property Imperative report to September 2015, we look at households who are wanted to trade up and trade down. These are important segments of the market because they have reason to transact, and access to funding if they decide to trade. In fact they tend to underpin the market, and the balance between the two tell us something about demand and supply, and also which sectors are more likely to be on the up.
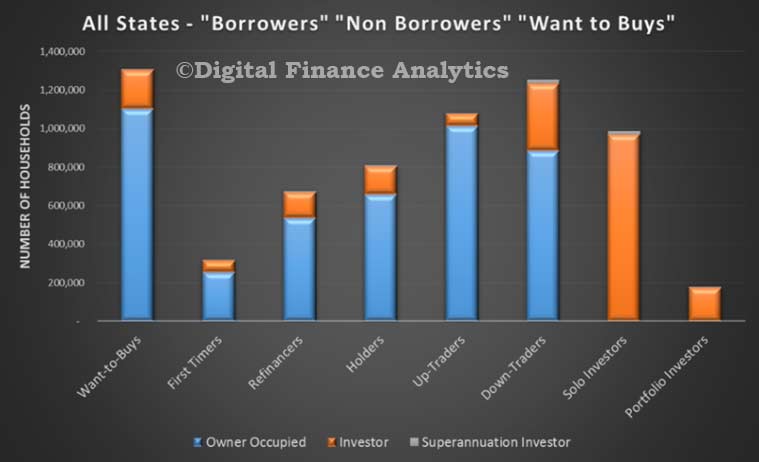
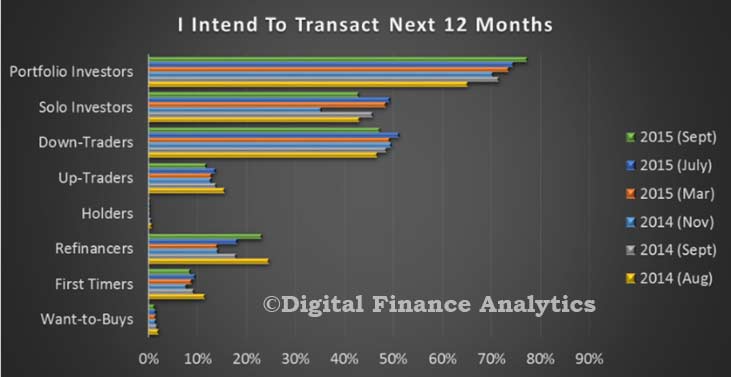
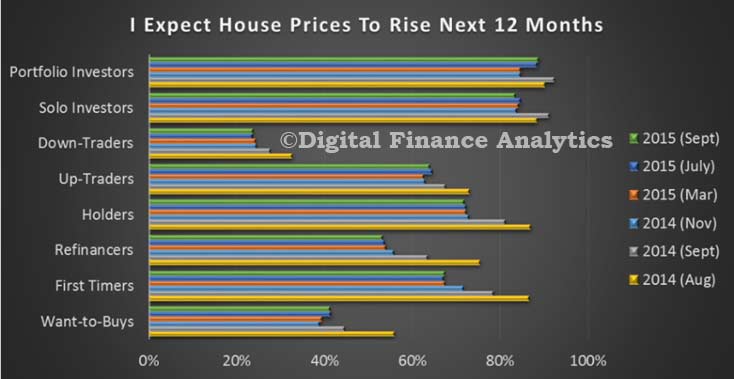
So looking first at those seeking to trade up, our survey identified about 1,077,000 households who are considering buying a larger property. Most (91%) are owner occupied. Of these households 12% are expecting to transact within the next 12 months, whilst 64% of households expect house prices to rise in this period.
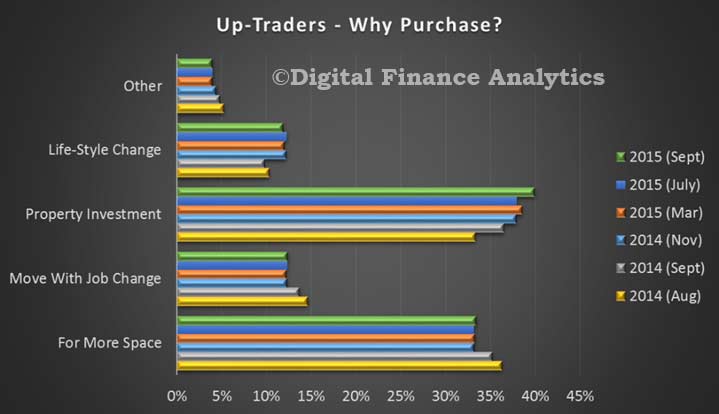
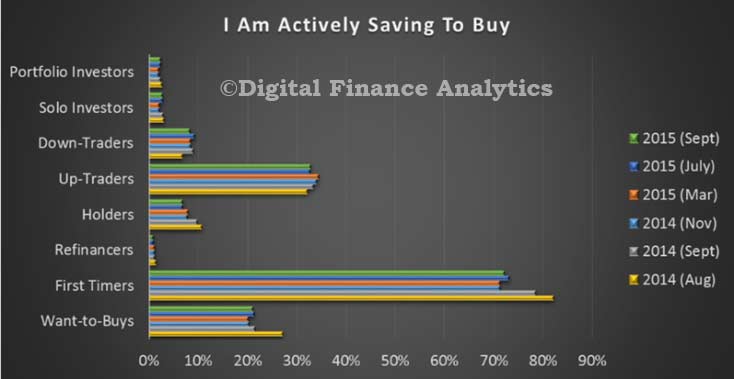
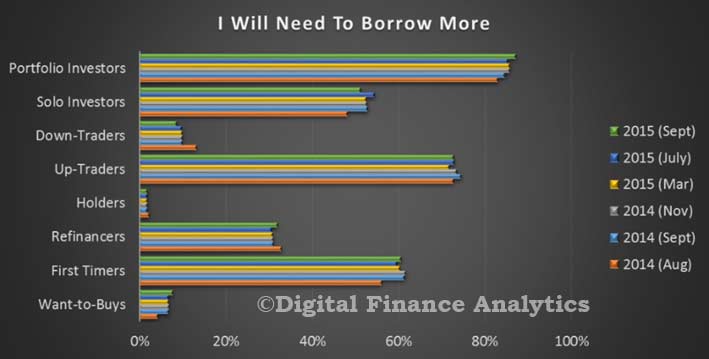
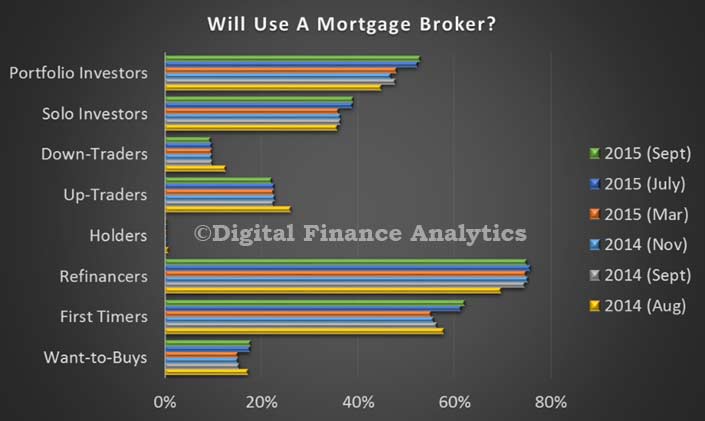
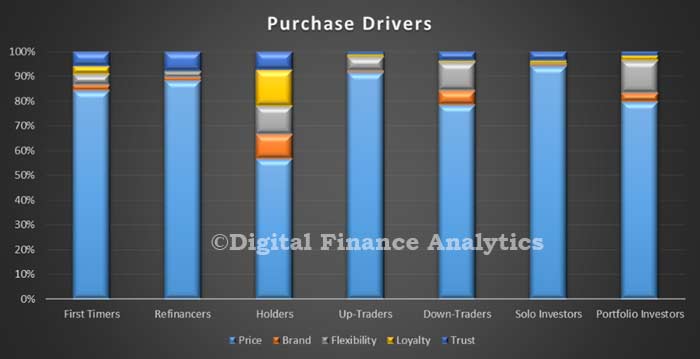
The main reasons for these households to transact are as a property investment (40%), to obtain more space (33%), because of a job move (12%) and for a life-style change (12%). Many of these households will require further finance (72%) and a quarter will consider using a mortgage broker (22%), whilst 33% of these households are actively saving to facilitate a transaction. We note that prospective future capital gains rated most strongly, the view of property as an investment continues to drive behaviour. We also note that the majority of up-traders are seeking houses rather than apartments. Given the focus on owner occupied finance now, lenders and brokers would do well to consider their strategies to assist this market segment.
Turning to down-traders, more than 1.25 million households are considering selling and buying a smaller property. These households tend to be older, and with higher net worth. Of these 71% are considering an owner occupied property, and 29% an investment property. Of these 670,000 currently have no mortgage and own the property outright. Many will not need bank finance to transact. Some however may seek investment finance.
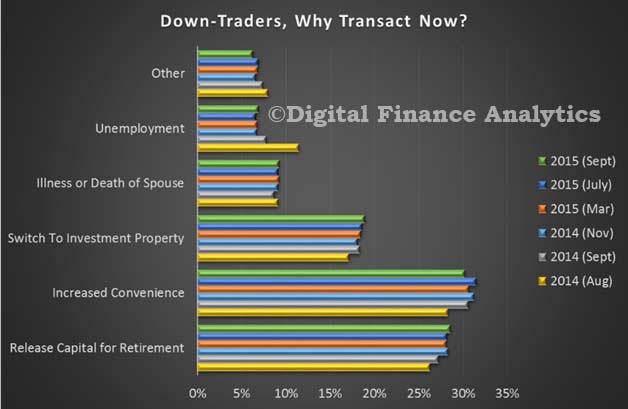
Around 24% of these households expect house prices to rise over the next year, whilst 51% expect to transact within 12 months, 9% will consider using a mortgage broker and 9% will need to borrow more. Households will transact to facilitate increased convenience (30%), to release capital for retirement (28%), because of unemployment (7%) or because of illness or death of a spouse (9%). Down traders tend to be seeking smaller more convenient property, are more likely to go for an apartment with good access to central facilities, such as shops and healthcare, and some may, as part of a wealth management strategy be seeking to release capital (as they have seen significant upside in recent times) and opt for an investment property (sometime with negative gearing).
But, if we put these two segments together, there are about 765,000 households looking to trade in the next year. Of these, nearly 80% are down traders. We think this will have an impact on the supply and demand footprint in the market, with smaller property being supported by the high number of down traders, and poor supply, whilst those with larger places, and wanting to sell may find a lack of buyers and a saturated market, so price differentials will moderate, with continue growth in the middle market, but more sluggish growth, or even a fall at the top end. This could well also distort prices in specific geographic areas. In other words, down traders may have to give a little on the price they get to sell their current place, and pay more for their next property, because of the higher level of demand. Up-traders will find good supply of property if they choose to transact, and will be able to negotiate hard on price.
Next time we look at the investment sector.