Suncorp is all but quitting over-the-counter banking in WA, closing eight of its nine Perth branches.
The Queensland financial services group says the decision reflects the declining use of branches by customers, who are increasingly going online to do their everyday banking.
“The decision to close a branch is never taken lightly, but we’re finding that fewer customers do their banking at the branch,” Suncorp said in a statement.
“Since 2010, national over-the-counter transactions have declined by 30 per cent, from 685,000 to 478,000 in August 2015, while mobile transactions have grown from 312,000 transactions to more than 5 million in July 2015,” it said.
Banks, however, are also intent on cutting expenses in what is a low-growth environment, with Suncorp chief executive Michael Cameron telling shareholders just last month that “recalibrating” the group’s costs was a priority.
WA accounts for about 7 per cent of Suncorp’s $54.3 billion loan book.
Perth customers who prefer face-to-face banking will have to rely on the one branch not slated for closure, in St Georges Terrace.
The group was unable to say how many staff were affected by the closures, adding that it was trying to redeploy them elsewhere within Suncorp.
Category: Digital Disruption
NAB Systems Are Down
According to Andrew Hagger Chief Customer Officer, Consumer Banking and Wealth, NAB has been experiencing outages to some services overnight.
“This has been affecting a number of our systems, including our customer call centres, Mobile Internet Banking and the processing of some customer payments.
“It’s important for customers to know that our ATMs are running as usual and that payment by all NAB cards is available.
“There has been a delay in processing some transactions. If customers need help accessing their money our branches and business banking centres will be open.
“We’re sorry that we’ve let our customers down and we’ll do our best today to work with you through our branches.
“We recognise the impact that this outage is causing and we can assure you we’re working hard to make things right.
“We continue to provide customers with regular updates.”
Where Has APRA Gone?
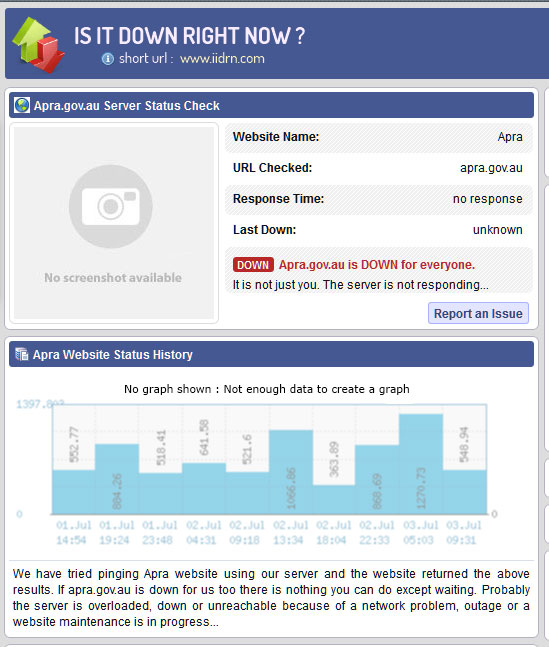
An amusing snip-it. On the day the banks are starting to appear before the economics committee, I noticed the APRA web site was down. Yes, the ADI regulator had disappeared! I wanted to grab some information for analysis I was running. Normal service was resumed just before 11:00 this morning.
Thinking it might be my end, I tried this. Nope, the site was down.
At 8:55am, local time it came back, then went again. At 9:34, we are getting an HTTP Error 503 from APRA. A quick lookup says of 503:
HTTP Error 503 – Service unavailable
Introduction
The Web server (running the Web site) is currently unable to handle the HTTP request due to a temporary overloading or maintenance of the server. The implication is that this is a temporary condition which will be alleviated after some delay. Some servers in this state may also simply refuse the socket connection, in which case a different error may be generated because the socket creation timed out.
Fixing 503 errors
The Web server is effectively ‘closed for repair’. It is still functioning minimally because it can at least respond with a 503 status code, but full service is impossible i.e. the Web site is simply unavailable. There are a myriad possible reasons for this, but generally it is because of some human intervention by the operators of the Web server machine. You can usually expect that someone is working on the problem, and normal service will resume as soon as possible.
Fintech Offers New Escape Route For Off The Plan Investors
A new off-the-plan property sale platform has been launched to cater for foreign investors who are looking to on-sell their investment via nomination before the settlement date.
Aofun.com.au has launched an online platform that will allow property buyers, who have made down payments on off-the-plan properties, the opportunity to on-sell their investment via nomination before settlement.
The platform is primarily targeted at foreign investors who have been ‘caught out’ by the major Australian banks’ decision to tighten their lending to foreign investors.
Aofun founder and chief executive Jason Zhu said many potential sellers who bought an off-the-plan property in the past few years now have “little or no” chance of securing finance.
He said some of these sellers may be willing to forgo the full 10 per cent deposit.
“There is a real opportunity for first home buyers who may not have sufficient savings for their first home to register on the website and acquire their first home with the deposit paid,” Mr Zhu said.
He added that the Aofun platform allows the original buyers to list their property, and hopeful buyers can make an offer.
“Buyers and sellers can then negotiate the final sale price on the property via the online portal. The sale will then proceed through all the normal legal processes.”
Many original buyers may be willing to sell below the original contract amount to avoid a potential lawsuit from the property developer or to avoid receiving a bad credit rating – factors that “may have negative implications for any future immigration application to Australia or investment in Australia,” according to Mr Zhu.
“The reality facing the market is that many of the overseas buyers of these properties, for various reasons, are not going to able to complete their purchases, leading to an oversupply that will inevitably place a sizable burden on the property and construction industries.”
Can We Trust Price Comparison Websites?
As digital acceptance continues to deepen, more consumers are using Price Comparison Websites (PCW) or Comparator Websites or apps, to inform their purchasing decisions. From financial services, utilities, phone plans, flights, holidays and shopping, use is on the rise. Clearly such sites have the potential to empower consumers and make choice simplier. But should we trust them? Are they giving truly independent results?
Below the waterline, there are commissions being paid, results filtered based on affiliations and other commercial incentives or targets, and the basis of recommendation is not always clear.
ASIC highlighted issues with PCW’s in 2012, and with specific Superannuation and Insurance comparison sites.
The ACCC published “The comparator website industry in Australia” report in November 2014. They said:
Comparator websites are almost universally free for consumers to use, with revenue earned through one of the three business models. The two primary means of remuneration are:
• Fee per lead or call (used by ‘lead generation’ sites)—a fee is paid by the service provider for each lead that is generated to the service provider. This model includes a fee per ‘click-through’ where a service provider pays a fee for each customer that is directed to its website from the comparator website.
• Commission on sales (used by ‘end-to-end’ sites)—commission is paid by the service provider for each successful sale. Commission is paid either upfront, on a trailing basis (commission paid over a period of 3−4 years, subject to the customer remaining with the service provider) or through a combination of both.Comparator website operators and service providers reported that the fee and commission payments received vary depending on the service provider and sector. For example, in the private health insurance sector, commission payments are generally between 20 to 40 per cent of the first year’s premium, with a trailing fee also payable in some cases. Where a trailing fee is payable, the upfront fee tends to be lower. Additional methods of achieving remuneration include charging for advertising on the comparator website or selling customer data. The use of these methods is minimal, with the majority of comparator website operators reviewed by the ACCC focusing on generating revenue via click-through or commission per sale.
Now, in the UK, the UK Regulators Network (UKRN) (a peak body covering a wide range of industry segments) has just published a report looking at UK price comparison websites. In addition, the UK Competition and Markets Authority (CMA) would commence an investigation of digital comparison tools – including PCWs – in the autumn 2016.
Here are some thought provoking comments which I think have relevance to our market too.
Why people use PCWs
Consumers’ stated reasons for using PCWs tend to relate to price, with users indicating that their principal aims are to find the best deal (85%), compare prices for specific products (83%) and save money or reduce costs (79%).
However, price is not the only factor that drives consumer use of PCWs. Studies has found that consumers use PCWs as a research tool to find companies offering relevant services (69%), a significant proportion stated they use PCWs to save time (65%) and to inform them when considering switching providers (62%).
One of the underlying views was that price comparison sites are used to get a ‘better’ deal and not necessarily the ‘best’ deal.
Consumers’ uses of PCWs can vary by sector, as the following examples, from research carried out by Mintel in 2014, illustrates:
home insurance – 33% used a PCW for research, 19% purchased or arranged via a PCW;
broadband, TV, phone – 21% used a PCW for research, 7% purchased or arranged via a PCW;
mortgages – 9% used a PCW for research, 4% purchased or arranged via a PCW.Evidence on why consumers may differ in their use of PCWs is limited. However, for some products, like insurance for example, consumers may be more likely to use PCWs to make their purchase and complete a transaction. This may be due to two factors: first, with a product like insurance, buyers make frequent choices about their service provider. Second, it may be easier for PCWs to have relationships with insurance providers to complete the transaction. Conversely, products such as mortgages may be more complex, may require professional advice and security checks that are less amenable to being completed in one portal. This may therefore explain why consumers may be less likely to purchase certain products through PCWs and why the use of PCWs in general differs across sectors.
Use of multiple PCWs
When consumers use PCWs to shop around, they often use multiple sites. This is referred to as multi-homing.
Consumers appear to use at least two sites before making a decision. A 2013 study by Consumer Futures found that 16% used one site, 57% used two to three, and 26% more, before making a decision.43 For instance, the FCA’s market study on credit cards found that, of those that took out a credit card in the last 12 months after shopping around, 39% had used one PCW and 27% had used two or more, indicating that consumers not only utilise PCWs to search for suitable credit cards, but also that some are comparing between sites.
Panellists from the Ofgem Consumer First Panel in March 2016 held the underlying view that it was necessary to use multiple PCWs as they offered different ranges and may have commercial relationships with certain suppliers.
Common problems consumers may have with PCWs searches
Whilst PCWs can bring benefits to consumers, research has found there are some common problems that reduce their effectiveness and potentially result in poor outcomes. These issues include the following:
Consumers can become frustrated when there is no ability to customise and personalise searches – users typically desire a large amount of information but want to use filters to reduce the number of results. This function increases confidence, as it reinforces the perception that the results are tailored to the specific needs of the shopper.
Consumers prefer a range of ranking options – studies undertaken by the European Commission indicate that users were less likely to select a PCW when only one default ranking option is offered, as there was a preference for sites that provided a choice of one to three settings in addition to ranking by price only.
Consumers do not always find rankings to be clear – in some studies consumers have found that the presentation of information on PCWs and the criteria used for rankings can be unclear. An FCA report observed a wide variation in how products were displayed on PCWs, with some websites providing less clarity on the criteria used for default rankings.
Fear that sharing personal data could result in unsolicited marketing communications – concern and uncertainty over how PCWs use personal details was often linked to a fear that providing such information would result in unsolicited communication.49 Consumers also expressed concerns over their data being sold onto other companies with some entering fake phone numbers as a precaution against this. This was also an underlying view of panellists from Ofgem’s March 2016 Consumer First Panel.
Some consumers find the layout of PCWs difficult to navigate – one study found some features created issues for consumers.52 This included: unclear signposting in menus, small text, links and buttons being difficult to identify, creating uncertainty on where to go next, difficulty in locating explanations and definitions of terminology, and the positioning of advertising in such a way that it seems part of the search results.
Consumers rarely understand how PCWs work or generate revenue – when prompted they tend to hypothesise that revenue is drawn from ‘advertising’, ‘commission on sales’, ‘click-through to providers’ sites’ or ‘access or listing fees’.Some concerns that results may not be impartial due to business models – the impartiality of PCWs is sometimes expressed as an issue amongst consumers. For example, during Ofgem’s Consumer First Panel discussions in March 2016, some panellists were aware that relationships between suppliers and PCWs could be in place, while others were surprised that not all PCWs were independent of suppliers. Those panellists were suspicious about these relationships, and were unsure how or why these were formed; they were cautious about any relationships that might reduce customer choice. Conversely, however, other research shows that few consumers attach any importance to information on PCWs’ business models.
Trust in PCWs
A key potential problem that may limit the use and effectiveness of PCWs is the extent to which consumers trust price comparison sites and have confidence in using them.
Levels of consumer trust in PCWs can differ across sectors. In the energy sector for example, a survey in the CMA Energy Market Investigation identified levels of consumer confidence and trust in PCWs as being a potential issue: 26% were not confident that they could use PCWs to get the best energy deal; of these, 43% said they were not confident because they did not trust or believe PCWs.
However, in another study, it was found that that a large majority (94%) of consumers recalled PCWs that they had used to be either ‘very’ or ‘fairly’ reliable’. Although the majority of consumers use multiple sites, only a small minority do so due to a lack of trust. Instead, consumers normally engage in ‘multi-homing’ to give themselves confidence they have not missed a good deal.
A 2014 study by the FCA60 found consumers to have a high level of confidence in the well-known PCWs to offer dependable insurance quotes. Furthermore, the trust that the users had in these popular comparison tools led to a “halo effect”, whereby even previously unknown providers listed were now seen as trustworthy. This was because of an expectation that these recognised sites would vet and check providers included in their directory.
Ranking
Regulators have identified that:
Rankings may be complex – for example in the credit cards sector, ranking of credit cards and their offers might not always be helpful for consumers – e.g. one PCW’s table ranked in a formula that included the likelihood of acceptance, Balance Transfer Period, Balance Transfer Fee and Representative APR.
Rankings may not be suitable for all customers – PCWs’ rankings are sometimes ordered by ‘popularity’. This may not be helpful for consumers and it could lead to an unfavourable outcome if previous users have made poor choices or if it is not the most relevant factor for them (e.g. if they are looking to save money).PCWs may give prominence to suppliers they have a commercial relationship with – some PCWs give prominence to certain products because of a sponsorship agreement, instead of displaying options that might be better for consumers based on their search criteria. To ensure results are accurate and unbiased, Ofcom’s Accreditation Scheme requires default ranking to be by price and by a measure of total amount payable for the service. Price ranking means that consumers may avoid the potential risk of using a PCW that ranks deals based on commissions received by Communication Providers (CPs), rather than based on the cheapest total price. The requirement to display a total amount payable can help consumers identify the complete price of their contract. Joint research by the Advertising Standard Authority and Ofcom found that consumers can struggle to identify the total costs of broadband contracts when prices are advertised separately and/or less prominently.
Not all products are presented to consumers because of a lack of commercial relationship – whilst regulators have encountered examples where commercial relationships have given prominence to some results over others, the opposite can also be true. Where a PCW does not have a direct relationship with the supplier, the search results from that supplier can be ‘hidden’ or difficult to find.
The method of ranking may affect which deals consumers use – the method by which the deals are sorted (e.g. price, contract type, customer ratings) can have an impact on the number of consumers that are likely to select the best product for their needs. The strength of this effect depends on precisely how the products are sorted. For example it has been found that the sorting method that resulted in the most customers identifying the best deal displayed the offers sorted by price (with the cheapest deal being ranked on top). A study undertaken as part of the FCA’s work on high-cost short-term credit also highlighted the importance of positioning when consumers used PCWs. When the cheapest deals were listed on top, users selected these deals 63% of the time, compared to 27% of the time when deals were sorted at random.
Accuracy and impartiality
A lack of accuracy on pricing can mean that consumers are not making fully informed decisions. In addition, PCWs do not always provide clarity regarding their role in the distribution of a product or the nature of the services they offer. In a review of annuity comparison sites, the FCA found that PCWs do not always satisfy the key FCA requirement to be ‘fair, clear, and not misleading’. For example, PCWs may describe a service as ‘free’ when commission is actually received by the firm if the user selects that particular product.
Other competition issues
Agreements or commercial relationships between PCWs and product suppliers have the potential to weaken competition between PCWs themselves, between competitors in the upstream markets, or both.
Most Favoured Nation clauses
These are agreements that commit a supplier not to sell the same product more cheaply elsewhere. Such agreements have the potential to distort competition through raising barriers to entry and limiting the commercial freedom of suppliers.
Time To Turn Up The Cyber-security Wick
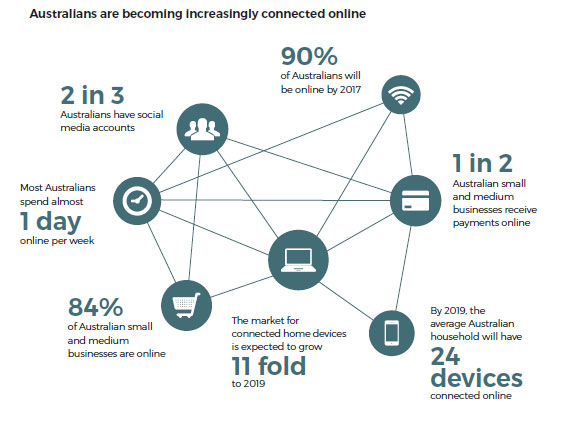
Given the massive shift to the digital world, cyber-security is something which should be front of the minds of financial institutions. But awareness needs to penetrate throughout these institutions, as well as on to their customers, and up to the executive suite. This is not just something for the IT security “experts”. It is about awareness and cultural change.
As the recent Government Cyber Strategy highlighted Australians have quickly embraced economic opportunities in cyberspace.
In 2014 alone, the Internet based economy contributed $79 billion to the Australian economy (or 5.1 per cent of GDP). This amount could grow to $139 billion annually (7.3 per cent of GDP) by 2020 as more devices, services and people are connected online.
Figures vary, but cybercrime is estimated to cost Australians over $1 billion each year. Worldwide, losses from cyber security attacks are estimated to cost economies around one per cent of GDP per year. On this basis, the real impact of cybercrime to Australia could be around $17 billion annually. These costs are expected to rise. Government, telecommunications, resources, energy, defence, banking and finance sectors are likely to remain key targets for cyber criminals and malicious state actors alike.
It is estimated that by 2020 there will be at least 50 billion devices connected to the Internet globally. This explosion of connectivity will accelerate innovation in products and services, providing new business opportunities and new jobs.
However, the more connected ‘things’ are, the more targets there are for malicious actors. Part of the problem is that online security has not been considered in the design of many of the devices connected to the Internet. This has made it easier for malicious actors to disrupt and damage networks.
As an example of how vulnerable Internet connected devices can be, in 2015 the popular technology website Wired.com reported that security researchers had hacked into the electronics of a US car through its online entertainment system, changing its speed and braking capability before shutting the car engine down remotely. This demonstration led to the manufacturer having to provide software updates for 1.4 million US cars and trucks fitted with the same entertainment system.
Increased connectivity is also changing the relationship between consumers and businesses; it is fragmenting supply chains and business models. In turn, this will affect how people live and work, and how industries and economies perform.
Australia is the third most targeted country for banking botnets.
The need to get serious was reinforced when recently The New York State Department of Financial Services announced that a new first-in-the-nation regulation has been proposed to protect New York State from the ever-growing threat of cyber-attacks. This could become a template for other jurisdictions. It imposes significant mandatory obligations on financial sector firms.
The regulation requires banks, insurance companies, and other financial services institutions regulated by the State Department of Financial Services to establish and maintain a cyber-security program designed to protect consumers and ensure the safety and soundness of New York State’s financial services industry.
The proposed regulation is subject to a 45-day notice and public comment period following the September 28, 2016 publication in the New York State register before its final issuance. It requires regulated financial institutions to establish a cyber-security program; adopt a written cyber-security policy; designate a Chief Information Security Officer responsible for implementing, overseeing and enforcing its new program and policy; and have policies and procedures designed to ensure the security of information systems and nonpublic information accessible to, or held by, third-parties, along with a variety of other requirements to protect the confidentiality, integrity and availability of information systems.
The proposed regulation by the Department of Financial Services includes certain regulatory minimum standards while maintaining flexibility so that the final rule does not limit industry innovation and instead encourages firms to keep pace with technological advances.
New York State Department of Financial Services Superintendent Maria T. Vullo said, “Consumers must be confident that their sensitive nonpublic information is being protected and handled appropriately by the financial institutions that they are doing business with. DFS designed this groundbreaking proposed regulation on current principles and has built in the flexibility necessary to ensure that institutions can efficiently adapt to continued innovations and work to reduce vulnerabilities in their existing cybersecurity programs. Regulated entities will be held accountable and must annually certify compliance with this regulation by assessing their specific risk profiles and designing programs that vigorously address those risks.”
The recent Security Innovation Network’s SINET 61 conference in Sydney highlighted the risks to banks and underscored that this was more a cultural issue, not a technical one. Banking staff need to be sensitised to potential risks around “phishing” emails. Some are being tested with cyber security “cyber security fire drills”. Many speakers suggested that the issue was just not being taken seriously enough.
This despite the 2015 CYBER SECURITY SURVEY:MAJOR AUSTRALIAN BUSINESSES” published by Australian Cyber Security Centre (CSC) with CERT (one of their partner agencies). Industry data was collected from major Australian businesses that partner with CERT Australia, and that underpin the social and economic welfare of Australia and deliver essential services including banking and finance, defence industry providers, communications, energy, resources,transport and water. This component of the survey was hosted online through an online survey platform. Most of the respondents (67%) were from large organisations (200+ employees), 23% were from medium size organisations (21-199 employees) and 10% were from small organisations (less than 20 employees).
The results highlight that cyber security incidents are still common and recurrent for Australian businesses. Half of the respondents reported experiencing at least one cyber incident that compromised the confidentiality, integrity or availability of a network’s data or systems in the last year.
They say that IT security awareness and practices of general staff appear to have improved since 2013. However, many cyber threats now feature well-crafted socially-engineered emails that make it difficult for the user to determine legitimacy, regardless of training. The rise of these threats could be behind the shift in investment moving away from awareness training toward more technical controls in an effort to prevent the user from having to make a judgement call.
The findings also demonstrate that industry organisations are yet to be convinced of the benefits of reporting incidents. Many industry organisations chose not to report incidents as there was no perceived benefit to them.
77% of respondents have cyber security incident response plans in place with 37% of these regularly reviewing it. Industry organisations were asked what other types of IT security policies, plans or procedures they were using.Basic security policies, plans and procedures are being applied by the majority of organisations. For example, 93% have an information security policy, 89% have business continuity/disaster recovery plans, 87% undertake network monitoring and 78% have a backup or archiving policy. While the majority of organisations are using some security policies there are areas for improvement. For example, less than half of respondents have a system security plan in place (44%), and only 51% of organisations have a removable media policy.
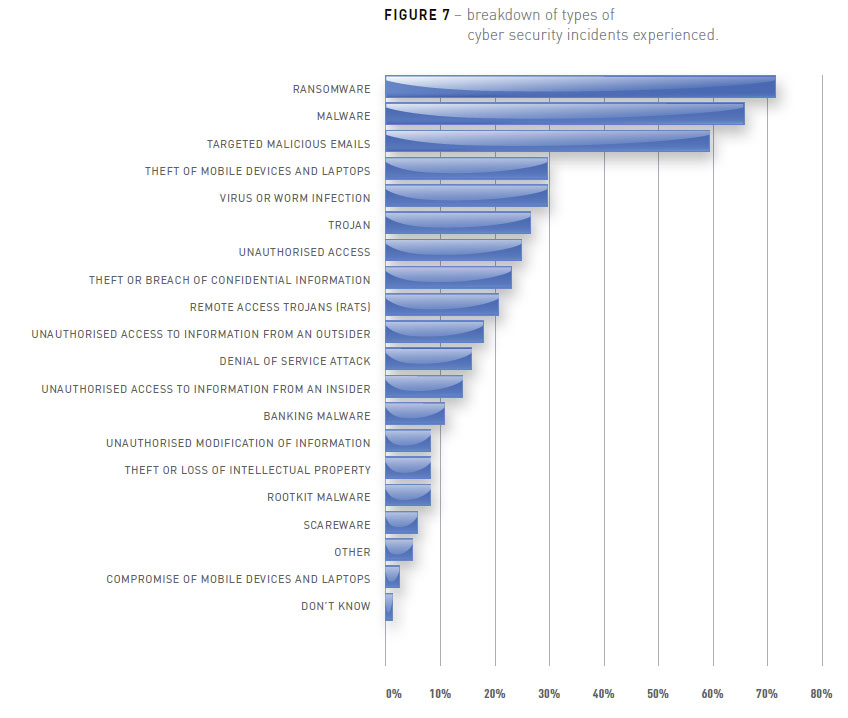
Ransonware and malware were the most frequent incidents, but more than 15% were from external unauthorised access, and 10% banking malware.
Australia’s AU$240 million cybersecurity strategy, will focus on closer collaboration with business.
The Australian government will spend hundreds of millions of dollars defending Australia from foreign cyber attacks, and has stated it employs offensive cyber capabilities to deter possible attacks — which could mean employing hackers to disrupt activities overseas.
Technical solutions are important but cultural change will be most effective in mitigating this form of cyber attack.
As businesses and governments we must better educate and empower our employees to use sound practices online. This Strategy seeks to promote an improved institutional cyber culture and raise awareness of cyber practice across government and business to enable all Australians to be secure online.
The Mobile Payment Business To Consumer Gulf
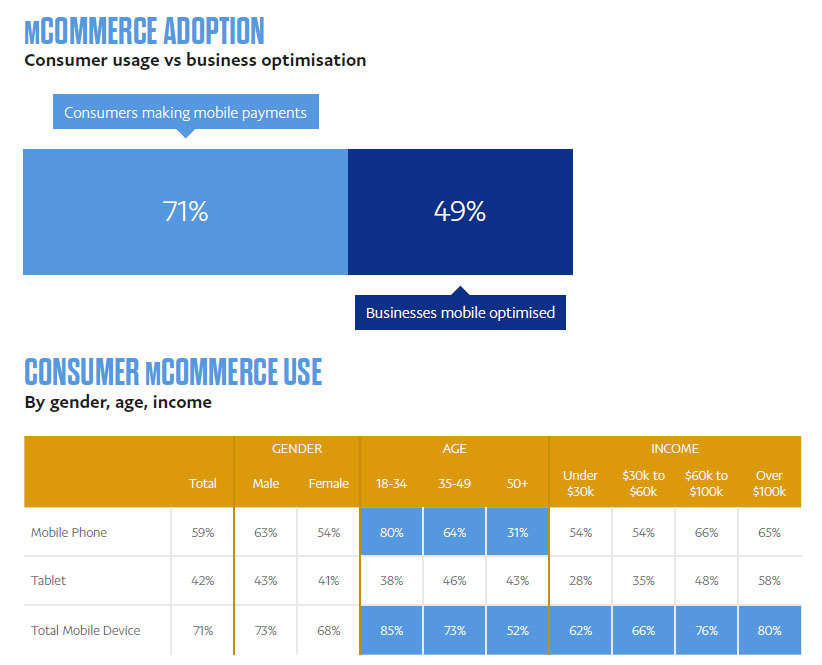
PayPal Australia have just released their first report on mobile payments in Australia, and highlight there is a significant gap between consumer willingness to use mobile payments, compared with business capability to receive them. Once again, in the digital disruption stakes, consumers are ahead of the curve!
Almost three-quarters (71%) of respondents are using their mobiles to make payments, however only 49% of businesses are optimised to accept them.
The number of consumers transacting on mobile is perhaps not surprising, considering that Australia is a country with one of the highest levels of mobile penetration globally with 80% of the Australian 18+ population having a smartphone. Among consumers aged 18-34 the use of mobile devices for payments at 85% is significantly higher than the 71% average.
Despite these impressive consumer mCommerce levels, 51% of businesses state that they are not optimised for mobile sales. Furthermore, almost one-third (31%) of businesses state they have no plans to change this. This gap is reflected in the proportion (26%) of businesses which have zero sales via mobile device.
When it comes to the devices that Australians prefer for making online purchases, desk and laptop computers are almost equally the favoured choice with 69% of respondents preferring to make payments on them. The remaining 31% of consumers prefer to make payments on their mobile phones (18%) or tablets (14%).Of those who prefer to use a mobile phone, those aged 18-34 dominate at 30% preference, compared to 15% preference for those aged 35-49 and 7% for the 50+ demographic.
The PayPal mCommerce Index finds that those with an income of over $100k show the highest preference for mobile payments, at 37%. Nonetheless, those with incomes under $30k make up almost one-quarter (24%) of those preferring to use their mobiles for payments.
More than a third (36%) of respondents are making mobile payments at least once a week, while one in five (22%) make mobile payments more than once a week. Millennial consumers (18-34) are the most prolific mobile shoppers with nearly half of this group (47%) making a mobile payment at least once per week. High frequency mobile payments are not limited to the young, one quarter (24%) of 50+ respondents are making mobile purchases and payments at least once a week.
The average mCommerce spend is $330 per month and 22% of respondents are spending more than $500 per month. These figures establish a benchmark against which we will continue to track in ongoing PayPal mCommerce Index reports.
When reflecting on levels of consumer mCommerce spending, age is not a strong contributing factor to high spend. In fact, across the age groups surveyed, consumers who are spending more than $500 per month, were notably similar at 23%, 26% and 19% across the 18-34, 35-49 and 50+ age groups, respectively.
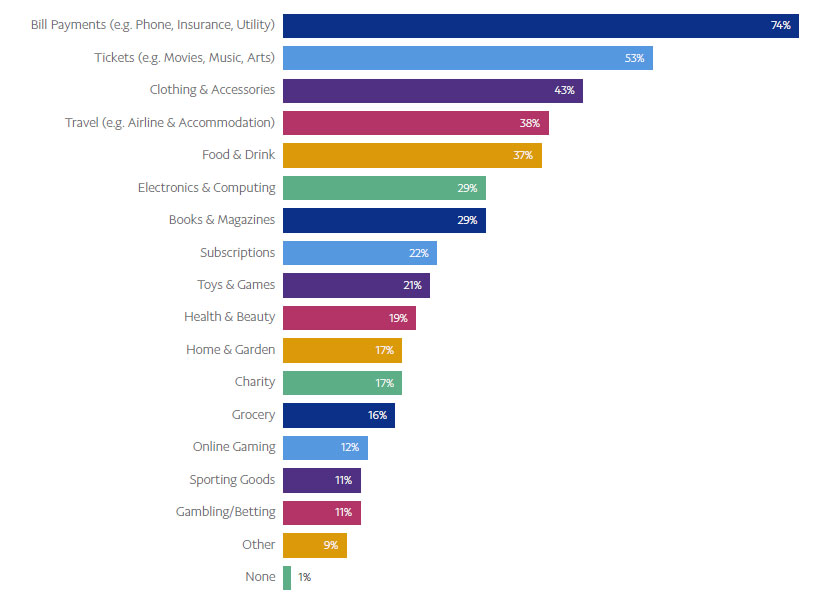
Bill payments is the category dominating mobile transactions. Almost three-quarters (74%) of respondents made phone, utility, insurance and other bill payments via a mobile device over the last six months. Other categories strongly supported by mCommerce are Tickets (53%), Clothing & Accessories (43%) and Travel (38%).
These top performing categories represent consumer transactions with major, mainstream businesses with well-established online commerce platforms. Regular and familiar use, plus lessened concerns for security by consumers, are believed to be factors in promoting mCommerce within these categories.
When Australian consumers get time to themselves, they are more inclined to make an online purchase or payment by mobile device – with ‘dual-screening’ being commonplace. Eighty-two percent of respondents said they engaged in mCommerce when relaxing at home or watching TV; almost half (45%) noted that they were engaged in mCommerce when taking a break at work or school; and just over one-quarter (26%) used the time when commuting on public transport for mobile purchasing or payments.
The data shows that although the majority of consumers do not indicate that a mobile is their preferred device for online purchases, they are using their mobile devices to shop when they are at home, presumably when they also have access to a laptop or desktop computer. Understanding the prevalence of dualscreening can help to inform future mCommerce positioning, marketing and consumer targeting.
Social commerce is rapidly emerging as the new frontier for online commerce. Already, 11% of respondents have made a purchase via a social platform. As channels including Facebook, Twitter and Pinterest, where consumers are highly engaged, emerge as commercial avenues, Australian businesses need to adapt if they want to maximise their online commerce opportunities.
Currently, 7% of surveyed businesses accept payments via social media sites or apps.
Despite consumer appetite, the PayPal mCommerce Index finds that 89% of businesses have no intention of accepting payments via social media within the next 6 months.
The survey was executed through Roy Morgan Research Ltd based on the survey responses of 996 consumers and 106 businesses using an online self-completion survey.
Latest Fintech Disruption Index Higher
The latest edition of the Financial Services Disruption index is released today. It measured 39.26, up 8.51% from last quarter.
The Disruption Index tracks change in the small business lending sector, and more generally, across financial services. The Financial Services Disruption Index, which has been jointly developed by Moula, the lender to the small business sector; and research and consulting firm Digital Finance Analytics (DFA).
Combing data from both organisations, we are able to track the waves of disruption, initially in the small business lending sector, and more widely across financial services later.
Highlights this time include:
- Surveyed small businesses are becoming increasingly aware of funding alternatives away from the traditional banks, with a rise of 14% quarter on quarter.
- We have now reached the point where SMEs using smart phones, tablets and laptops within their businesses are in the majority for the first time, with nearly 52% of businesses indicating these important tools in a small business. This trend is only likely to accelerate.
- Coupled with the increasing adoption of smart devices in SMEs, we are also seeing increasing use of cloud accounting data, not only in running a SME but also to obtain a loan (through data permissioning). In the latest results, over half of all businesses permissioned Moula into cloud accounting data.
In light of the vacuum of information in respect of the size of SME borrowing, DFA have used their survey to provide an estimate of this market segment.
DFA looked at SME’s borrowing less than $500,000. The total stock of debt is in the order of $107 billion of loans (including unsecured overdrafts, structured loans, personal loans for business purposes) and $36 billion of credit cards debt, or $143 billion in total.
Of surveyed respondents, approximately 13% of businesses are just aware of fintech offerings, whilst 2% considered applying for funding but did not follow though. In addition, a further 5% have visited a fintech lender web site and 10% may apply within the next 12 months.
So, the opportunity for fintech lending is significant…
Read more on the Disruption Index Site.
The Future Of Fintech – Episode 3
In the last episode of the three-part series on the future of fintech, Baker & McKenzie looks ahead and examines both where some of the opportunities lay and where some of the challenges will be.
ASIC reports on review of marketing practices in IPOs
ASIC has warned firms and issuers involved in initial public offerings (IPOs) in Australia to ensure their marketing campaigns comply with the letter and spirit of the law, particularly when using emerging social-media strategies.
An ASIC review of marketing practices in IPOs has found that so-called ‘traditional’ means of communication – telephone calls, emails and websites – remain more important for the marketing of an offer to retail investors. The review found that the use of social media is not yet pervasive; it is only used occasionally by small to medium-sized firms to market IPOs.
REP 494 Marketing practices in initial public offerings of securities details the review’s findings, highlights areas of concern and provides for consideration ASIC’s recommendations to improve marketing practices for IPOs in the future.
Between October 2015 and March 2016 ASIC reviewed the online and social media marketing of 23 IPOs where a prospectus was lodged. ASIC then conducted a more extensive review of the marketing practices and materials of 17 firms that were involved in 7 of the original IPOs. ASIC also monitored the marketing of other IPOs as part of its usual prospectus review work.
Key findings of the report included:
- There were some oversight weaknesses in relation to marketing done via telephone calls and social media, and in ensuring that marketing material is kept up to date.
- The use of forecasts in communications or the targeting of investors from a particular background means special care may need to be taken to avoid misleading investors.
- Firms and issuers did not always properly control access to information about the offer to ensure retail investors base their decision on the prospectus; and
- Some good practices were adopted by firms to ensure that communication was consistent with the prospectus information.
ASIC Commissioner John Price said the purpose of the review was to understand current market practices and identify areas of particular concern.
‘The way that an IPO is marketed may unduly influence the decision to invest in an IPO,’ he said.
‘We are living in more innovative times where we are seeing new interactive methods of communication and marketing used in many corporate and commercial arenas, including taking a company public. While we embrace such innovation, we also want to remind firms and issuers to ensure that their marketing practices comply with the advertising and publicity restrictions in the Corporations Act,’ he said.