Whats Up With The Credit Flow Stats?

Something is late, very late this month. After the stock loans data from the RBA and APRA, both of which arrived for October on the last day of November, we would have expected to see the credit flow data from the ABS, about a week or so later.

Yet, digging into the upcoming releases, it looks like something will land on the 17th December. In addition, we are expecting significant revisions and changes as they continue to tweak the new reports.

They said:

From December 2019, this publication will be based on a new, improved data collection, called the Economic and Financial Statistics (EFS) collection. To better reflect the new content, the publication will be renamed Lending Indicators, Australia (cat. no. 5601.0). The first issue of the new publication will contain October 2019 data and will be released on 17 December 2019.

We know the October loan stock growth slowed to the lowest in many years, so the current theory doing the rounds is that households are repaying existing loans, and significant volumes of new loans are being written. Industry sources suggest to me that the refinance sector is buoyant thanks to the lower rates, but that is a net sum game. It is the new loans which we need to watch (after all if home prices are really taking off, per some of the indices, we would expect to see this trend), something which was pretty anemic last month.

And they also warn:

The changes to the concepts and classifications are significant. There is a high likelihood of revisions in future reporting periods as APRA, the ABS and the RBA continue to work with ADIs and other reporting institutions to ensure consistent reporting that aligns with instructions and definitions, and the impacts on seasonality can be measured. It is expected data quality will continue to improve over time.

Some New Data On Incomes

We look at the latest data from the ABS.

The median weekly earnings of employees rose by 2.3 per cent from August 2018 to August 2019, according to figures released today by the Australian Bureau of Statistics (ABS).

This increase, based on data collected with the Labour Force Survey, is consistent with increases observed in the Wage Price Index and Average Weekly Earnings.

Over the year to August 2019, the median weekly earnings of female employees rose by 4.3 per cent, while male employee earnings rose 1.3 per cent.

Head of Labour Statistics at the ABS, Bjorn Jarvis, said: “Median weekly earnings for male employees rose by less than that of female employees, partly because of the growing number of males working part-time hours, and the industries and occupations that men and women are working in.”

The figures also show gradual changes in working arrangements over time. There was an increase in the proportion of employed people with access to flexible working hours (34 per cent in August 2019, up from 32 per cent in August 2015) and who regularly worked at home (32 per cent, up from 30 per cent).

There was a decrease in the proportion of employed people who usually worked overtime (34 per cent in August 2019, down from 36 per cent in August 2015), or were on call or standby (22 per cent, down from 24 per cent).

The Characteristics of Employment Survey is run each August, in conjunction with the monthly Labour Force Survey. It collects information on earnings, working arrangements and forms of employment (including independent contracting), as well as trade union membership and labour hire every second year.

Volatility Rules! – The Property Imperative Weekly 07 December 2019

The latest edition of our weekly finance and property news digest with a distinctively Australian flavour.

Contents 00:20 Introduction 00:48 US Markets 01:50 Labor Stats 05:20 Oil 06:00 Gold 06:45 Euro 07:00 China 08:00 UK 08:12 New Zealand 08:40 Bitcoin 11:55 Australian Section 11:55 Economic Data 13:00 Property – Opal Tower 14:00 Timber-PVC Cladding 15:40 PCI Index 16:20 Auctions 17:10 Prices 17:45 Council of Financial Regulators 20:00 Local Markets

Australian economic view – December 2019

Frank Uhlenbruch, Investment Strategist in the Australian Fixed Interest team, Janus Henderson provides his Australian economic analysis and market outlook.

Market review

Australian government bond yields initially followed offshore yields higher on optimism that a trade deal was imminent. However, sluggish domestic economic data and Reserve Bank of Australia (RBA) commentary on unconventional monetary policy saw government bond yields end the month lower. Improving sentiment supported equity and credit markets. Overall, the Australian bond market, as measured by the Bloomberg AusBond Composite 0+ Yr Index, rose by 0.82%, with price appreciation from modestly lower yields boosting the income return.

Three and 10 year government bond yields rose to their highs of 0.88% and 1.30% following reports of a ‘Phase 1’ trade deal between the US and China and stronger US services sector data. Yields then rallied as it appeared a trade deal may be delayed and RBA commentary on unconventional monetary policy was seen as dovish. Australian three and 10 year government bond yields ended the month 16 basis points (bps) and 11bps lower at 0.65% and 1.03%.

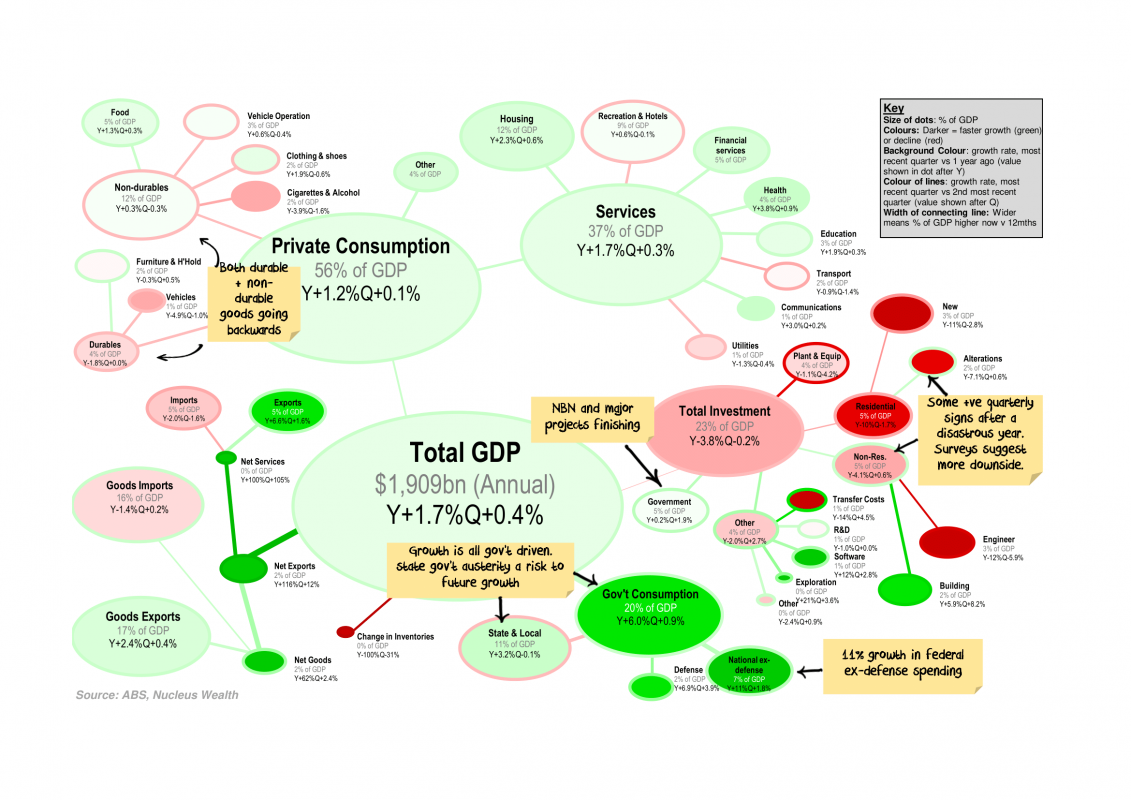
Australian data releases remained consistent with growth running at a sub-trend rate, with limited signs of recent fiscal and monetary easing boosting domestic demand. Retail sales for September were sluggish, gaining 0.2% over the month but falling by 0.1% in volumes terms over the quarter. While there was an improvement in consumer sentiment in November, confidence levels remain subdued with indications that uncertain consumers are saving rather than spending recent gains from tax rebates and lower mortgage rates.

Despite a small improvement in business conditions in the October NAB Business Survey, both confidence and activity measures remain below longer-run measures and have yet to show signs of a meaningful response to earlier policy stimulus. Consistent with sluggish survey readings, construction work done fell 0.4% in the September quarter, while private capital expenditure fell by 0.2%. This data, along with weak retail sales, point to another quarter of subdued growth in the upcoming release of the September quarter national accounts.

Labour market conditions softened, with employment falling by 19,000 in October, the first fall in 16 months. The unemployment rate lifted from 5.2% to 5.3% and the participation rate fell from 66.1% to a still historically high level of 66%. Wages growth remained modest, with the Wage Price Index lifting by 0.5% over the September quarter for a yearly growth rate of 2.2%. RBA commentary suggests that they expect to see wages growth around these levels persist for some time before lifting as labour market slack is eventually absorbed.

Against the backdrop of sluggish activity and perceived dovish central bank commentary, markets moved to factor in further easing over 2020 after largely ruling out a December move. Markets are assigning a 60% chance of a February 2020 easing and have a 0.50% cash rate fully priced by May 2020. By the end of 2020, markets are assigning a 40% chance of the cash rate falling to 0.25%, the effective lower bound.

Credit markets benefitted from the improvement in trade-related risk sentiment and investors’ ongoing search for yield, with the Australian iTraxx Index rallying 3bps to end the month at 56bps. Primary markets were active as companies looked to finalise debt funding ahead of the end of the year. Notable deals included residential mortgage-backed securities (RMBS) issued by Bendigo and Adelaide Bank, ING, and CBA, with the latter being the first RMBS deal to replace the historically used Bank Bill Swap Rate (BBSW) with AONIA (Australian Interbank Overnight Cash Rate) as a reference rate for the payment of coupons to investors.

Market outlook

Our base case remains for an extended period of accommodative monetary policy that will only be unwound once the RBA has confidence that inflation will settle in the middle of its target band. The latest set of forecasts from the RBA saw them downgrade their near-term economic growth forecasts by 0.25%, although they left their 2020 and 2021 GDP forecasts unchanged at 2.75% and 3%. With spare capacity being absorbed at a slower rate, the RBA pushed back the timing of when core inflation reaches 2% from mid-2021, to the end of 2021.

While the RBA considered easing monetary policy at its November meeting, it chose instead to join the US Federal Reserve and other central banks in pausing to wait and see how policy easing to date flows through into the broader economy, how trade developments unfold and the extent of any fiscal easing.

The RBA maintains an easing bias and is of the view that further cuts would provide additional net stimulus. In a landmark speech, the RBA Governor signalled that a 0.25% cash rate reflected the effective lower bound for the cash rate. The Governor saw negative interest rates in Australia as extraordinarily unlikely.

If further support for the economy was required when the cash rate was at the lower bound, then the RBA would consider unconventional policy measures, with the main focus on purchasing government bonds, including state government bonds, from the secondary market to drive down the risk-free rate that affects all asset prices and interest rates in the economy. If such policy support was required, the Governor noted that a combination of policy responses, including fiscal, would deliver the best results.

With little signs of recent policy stimulus and a turnaround in house prices showing up in activity, labour market and confidence indicators, we look for a further rate cut in February 2020 which would take the cash rate down to 0.50%. The prospect of the Government bringing forward ‘Phase 2’ tax cuts worth around $13.5bn in the May 2020 Budget, which would come into effect on 1 July 2020 , would significantly reduce the burden on monetary policy and rule out the need for a further cash rate cut and unconventional measures. This is our central case view and we see the stimulus from these measures raising the prospect of the cash rate lifting over the latter part of 2022.

We see nearer term risks tilted towards our low case scenario, where the cash rate falls to 0.25% and a lack of fiscal easing forces the RBA to initially extend its forward guidance. A lack of a coordinated policy response would see the RBA embark on a government debt purchase programme that flattens the domestic yield curve. Overall, we see three and 10 year government bond yields of 0.66% and 1.05% (at the time of writing) as offering little opportunity to express strong views on duration.

We continue to remain attracted to maintaining a core exposure to inflation-protected securities in an environment where policy is being firmly directed to boosting growth and lifting inflation back towards central bank targets. Despite a modest and ongoing lift in breakeven inflation rates from the record low levels experienced in late August, current pricing suggests markets still have little confidence that recent policy moves will gain much traction. However, with the cost of buying inflation protection now so low, we feel it makes sense to position for the prospect of a cyclical lift in inflation over the next few years, especially if one contemplates even more extreme policy measures to reflate economies.

GDP Hotspots

Courtesy of Nucleus Wealth’s Damien Klassen. Damien runs the investment side of Nucleus, selecting stocks suggested by analysts and implementing the asset allocation

Every quarter I like to look at the changes in Australian GDP and which categories are responsible for the growth / decline. Each bubble represents a category of GDP proportionate to its size, colours represent the growth rate.

Click the charts for a large version and commentary: 

Graphical representation of Australian GDP or Gross Domestic Product
Click for large version

This quarter the key takeaways include:

  • Federal Government spending (+11% for non-defence, 7% for defence over the year) the only thing keeping GDP above zero.
  • Investment growth was not good, but I was expecting worse. Possibly there are green shoots, but capex surveys and investment forward indicators suggest there is still more downside.
  • State & Local government spending has turned negative – with a low number of property transactions this is likely to remain a feature
Graphical representation of Australian GDP or Gross Domestic Product
Click for large version

Retail Turnover Nowhere

Australian retail turnover was relatively unchanged (0.0 per cent) in October 2019, seasonally adjusted, according to the latest Australian Bureau of Statistics (ABS) Retail Trade figures. The retail recession continues, and now the question becomes, will the summer holidays and Christmas change anything ahead?

This follows a rise of 0.2 per cent in September 2019.

“There were falls for clothing, footwear and personal accessory retailing (-0.8 per cent), department stores (-0.8 per cent) and household goods (-0.2 per cent),” said Ben James, Director of Quarterly Economy Wide Surveys.

“These falls were offset by rises in cafes, restaurants and takeaway food services (0.4 per cent) and food retailing (0.1 per cent). Other retailing was relatively unchanged (0.0 per cent).”

In seasonally adjusted terms, there were mixed results across the states. Victoria (-0.4 per cent), New South Wales (-0.2 per cent), and South Australia (-0.5 per cent) fell, while Queensland (0.4 per cent), Tasmania (1.4 per cent), the Northern Territory (2.3 per cent), Western Australia (0.2 per cent), and the Australian Capital Territory (0.3 per cent) rose in seasonally adjusted terms in October 2019.

The trend estimate for Australian retail turnover rose 0.2 per cent in October 2019, following a 0.2 per cent rise in September 2019. Compared to October 2018, the trend estimate rose 2.3 per cent.

QE could drive populism rather than the economy

The Reserve Bank will consider quantitative easing once rates fall to 25 basis points. It’s a tool that has been used by other countries, often with devastating consequences for society. Via InvestorDaily.

Australia is in uncharted territory, economically speaking. We’re latecomers to the low-rate party and we’re still getting used to it. Home owners are loving it but retailers are not. Unemployment is low but a record number of Aussies want to work more. It’s a strange time. 

The Reserve Bank of Australia only has a few options left if it fails to hit its inflation target and lift economic growth. It can continue to reduce the cash rate and even go into negative rates, as the European Central Bank (ECB) had done. The ECB benchmark deposit rate was cut by 10 basis points in September to negative 0.5 per cent. The ECB also reintroduced its quantitative easing program of buying 20 billion euros ($32 billion) worth of government and corporate bonds every month in an effort to prevent the European economy from sliding off a cliff. 

The ECB has been using QE on and off since 2009 in an effort to lift inflation. In 2015 the central bank began purchasing 60 billion euros worth of bonds each month. This increased to 80 billion euros in April 2016 before coming back down to 60 billion a year later. 

In the UK, the Bank of England bought gilts (British government bonds) and corporate bonds during its QE program during the global financial crisis in 2009. QE programs also took place in 2011 and 2016.

Meanwhile, the US Federal Reserve has undertaken three separate rounds of QE, the last of which it began tapering in June 2013. The US halted its program in October 2014 after acquiring a total US$4.5 trillion of assets. 

When a QE program takes place, a central bank begins buying securities with money that didn’t exist before the QE process began. They are essentially printing money and giving it to large corporates and the government through the purchase of these bonds, the logic being that the proceeds will be used to buy new assets (like mortgages) and invest, which in turn will drive the economy. 

The money doesn’t directly hit the wallets of consumers. Unlike “helicopter money”, which the Rudd government dished out during the financial crisis, QE has a much more indirect impact on consumers. Financially speaking. 

But the broader political and social impacts have had a lasting psychological effect on the populations of Europe and the US.

“If we look at the experience offshore, QE has been great at raising the level of assets in conjunction with a permanently lower interest rate,” Fidelity International’s Anthony Doyle said this week. 

“QE has stimulated asset price growth. The ‘haves’ have benefited compared to the ‘have nots’; income inequality has grown across the economies that have implemented quantitative easing and socially we have seen big shifts to the Right or to the Left in terms of the political spectrum. 

“If you think about Donald Trump, Elizabeth Warren, Bernie Sanders, Jeremy Corbyn, Brexit, Boris Johnson. The next decade could be characterised by moves to the Right or Left here as well if we follow a path that other economies have pursued.”

AMP Capital chief economist Shane Oliver told Investor Daily that QE “probably helps people who have shares and property more than it does people who have bank deposits.”

Prior to the election of Mr Trump in 2016, Luis Zingales of the University of Chicago Booth School of Business told Bloomberg that central bank policies are largely to blame for the rise of populism. 

Here in Australia, the Reserve Bank will have to consider the impact that QE could have on a society that has witnessed a banking royal commission that exposed widespread misconduct within the financial services industry.

If the impact on Europe and the US of QE on the people is anything to go by, Australia is well placed to split down the middle and begin gathering on the far edges of the political spectrum.

We were late to the low rate party. We might just be late to the populism party too.