
We review the RBA’s latest chart pack and discuss the key themes in the economy, including household debt, home prices, credit growth and international debt exposure.
Category: Economics and Banking
The Difference A Day Makes – The Property Imperative Weekly 05 Jan 2019
The latest edition of our weekly finance and property news digest with a distinctively Australian flavour.
Please consider supporting our work via Patreon
Or make a one off contribution to help cover our costs via PayPal
Please share this post to help to spread the word about the state of things….
Caveat Emptor!
Note: this is NOT financial or property advice!!
All Time High Global Debt Looms Large Says IMF
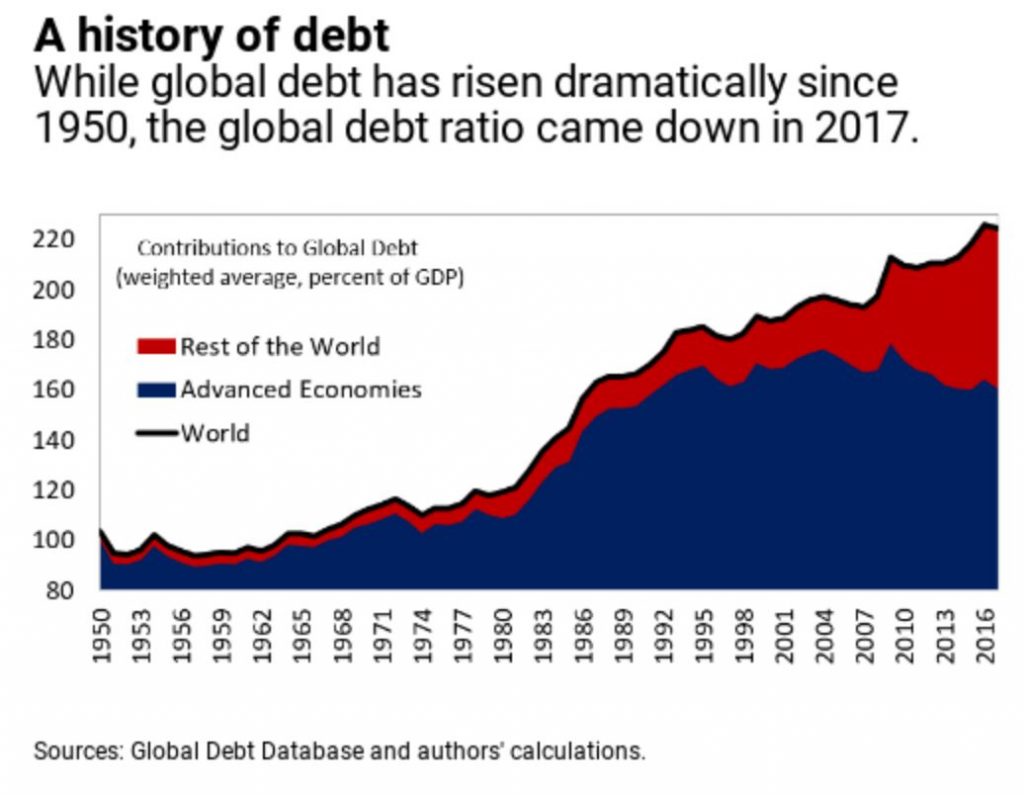
The IMF has updated their Global Debt Database, and by including both the government and private sides of borrowing for the entire world, it offers an unprecedented picture of global debt in the post-World War II era.

The long view
- Global debt has reached an all-time high of $184 trillion in nominal terms, the equivalent of 225 percent of GDP in 2017. On average, the world’s debt now exceeds $86,000 in per capita terms, which is more than 2½ times the average income per-capita.
- The most indebted economies in the world are also the richer ones. The top three borrowers in the world—the United States, China, and Japan—account for more than half of global debt, exceeding their share of global output.
- The private sector’s debt has tripled since 1950. This makes it the driving force behind global debt. Another change since the global financial crisis has been the rise in private debt in emerging markets, led by China, overtaking advanced economies. At the other end of the spectrum, private debt has remained very low in low-income developing countries.
- Global public debt, on the other hand, has experienced a reversal of sorts. After a steady decline up to the mid-1970s, public debt has gone up since, with advanced economies at the helm and, of late, followed by emerging and low-income developing countries.
Was 2017 different?
For 2017, the signals are mixed. Compared to the previous peak in 2009, the world is now more than 11 percentage points of GDP deeper in debt. Nonetheless, in 2017 the global debt ratio fell by close to 1½ percent of GDP compared to a year earlier. The last time the world witnessed a similar decline was in 2010, although it proved short-lived. However, it is not yet clear whether this is a hiatus in an otherwise uninterrupted ascending trend or if countries have begun a longer process to shed more debt. New country data available later in 2019 will tell us more about the global debt picture. For 2017, we divided up countries into three groups based on their debt profile and here’s what we found:
- Advanced economies: There has been a retrenchment in debt build-up among advanced economies. Private debt, although marginally on the rise, is well below its peak. Also, public debt in advanced economies experienced a healthy decline of close to 2½ percent of GDP in 2017. To find a similar reduction in public debt we need to go back a decade, when global growth was some 1¾ percentage points higher than today.
- Emerging market economies: These countries continued to borrow in 2017, although at a much slower rate. A major shift occurred in China where the pace of private debt accumulation, although still high, decelerated significantly.
- Low-income developing countries: Public debt continued to grow in 2017 and, in some cases, reached levels close to those seen when countries sought debt relief.
Overall, the picture of global debt has changed as the world has changed. The data shows that a big part of the decline in the global debt ratio is the result of the waning importance of heavily-indebted advanced economies in the world economy.
With financial conditions tightening in many countries, which includes rising interest rates, prospects for bringing debt down remain uncertain. The high levels of corporate and government debt built up over years of easy global financial conditions, which the Fiscal Monitor documents, constitute a potential fault line.
So, as we close the first decade after the global financial crisis, the legacy of excessive debt still looms large.
Sovereigns, Corporates in Focus as Credit Cycle Turns
Credit risks across many sectors are rising with a looming cyclical deterioration in credit conditions and global debt at near-record levels, says Fitch Ratings. However, the macroeconomic conditions and the sector breakdown of leverage in developed markets differ significantly from the last downturn in 2008. We expect governments and non-financial corporates to be at the center of any coming storm for credit conditions.

Since 2007, aggregate financial sector and household debt as a percentage of GDP globally has remained roughly steady according to data from the IIF. In contrast, governments and non-financial corporates have seen their debt rise significantly, up 27 percentage points (pp) and 16 pp, respectively. These sectors’ capacity to manage a macroeconomic slowdown accompanied by tightened financial conditions will thus be challenged.
Government debt/GDP ratios have increased substantially across most large and developed economies since 2007, leaving some sovereigns heavily exposed in the event of a future economic downturn with potential negative rating implications. A turn in the global credit cycle characterized by tighter financial conditions is more likely to be felt by emerging markets in the short term, which will face heightened volatility and capital flow disruption.
Non-financial corporates were not a primary source of risk during the last financial crisis. However, corporate leverage has risen markedly since then, enabled by low rates, rising equity valuations and the expansion of non-bank lenders. In addition, corporate borrowers have largely used this funding to expand shareholder returns and M&A, which have far outstripped capex. This has already driven negative rating trends for U.S. corporates over the past two years, despite relatively strong economic growth during that time. Ratings distribution in the U.S. corporates portfolios has changed significantly since the pre-crisis period, with ‘BBB’ category rated issuers rising relative to higher investment-grade categories.
Compared to sovereigns and non-financial corporates, banks in developed markets are in a more robust and resilient position compared to the last financial crisis. Capital levels and liquidity are significantly stronger, owing to a wave of regulatory reform, while reduced risk appetite and smaller loan portfolios have led to a significant reduction in banking assets as a proportion of GDP. While banks have retrenched, higher risk lending activity has moved into less visible areas of the non-banking financial system. This could increase uncertainty for the financial market heading into a downturn while adding to risks from the interconnectedness between non-bank financial institutions and the rest of the financial market.
Should The Banks Loosen Their Lending Standards?
I discussed the Treasurer’s comments today, that the banks should be lending more, on ABC News 24. It came directly after a package on his announcement.
Non Banks Out-Lending The Banks In Terms Of Mortgage Book Growth
APRA belatedly released their monthly banking statistics to the end of November today. Only a couple of days after the month end, but then who’s counting… (I am!!)
These statistics give us the monthly stock of assets and liabilities by the banks, and as normal we will focus in on the residential mortgage section of the data. We can of course compare this data with that from the RBA, which did come out on the last working day of December, and which we already discussed. See The Debt Machine Is Alive And Well
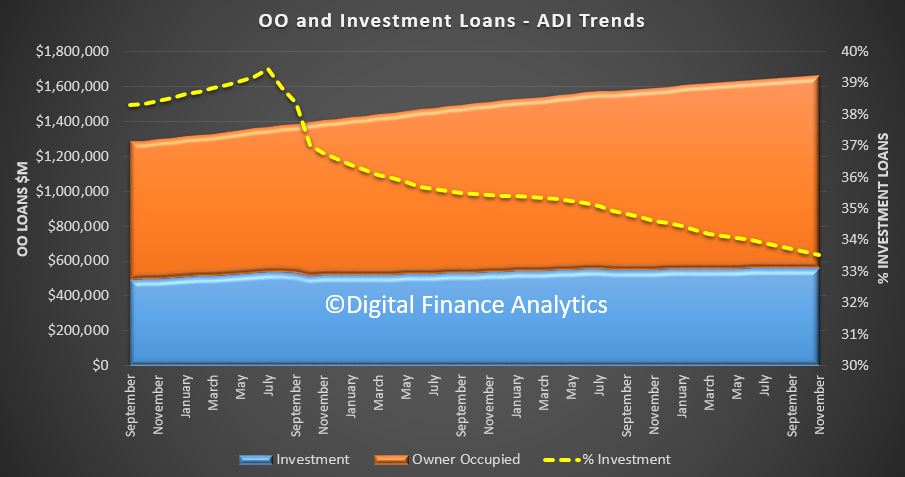
According to APRA, the original mortgage loan portfolios for the banks rose by 0.344%, or $5.69 billion over the month to a new record of $1.664 trillion dollars. Within that, owner occupied loans rose by 0.5% or $5.5 billion dollars to $1.1 trillion dollars, while loans for property investment rose 0.034%, or $188 million to $557.6 billion. 33.52% of all loans are for investment purposes, and this continues to slide, given the new market conditions.
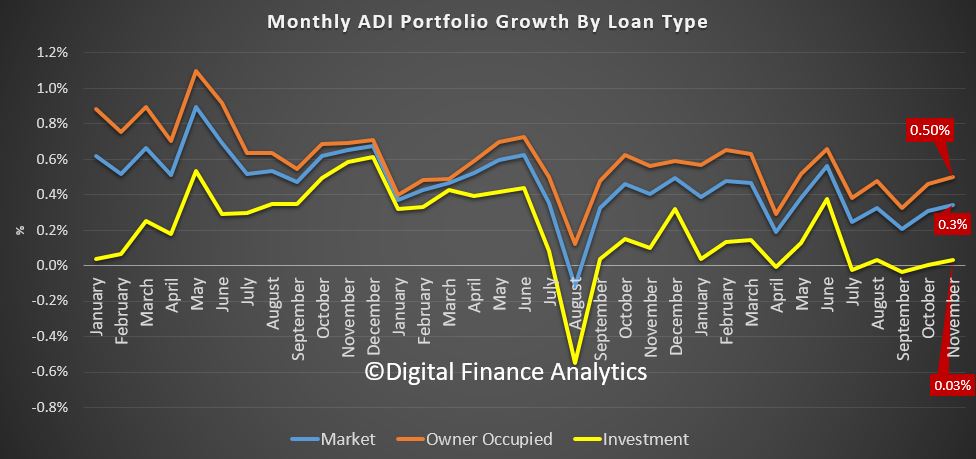
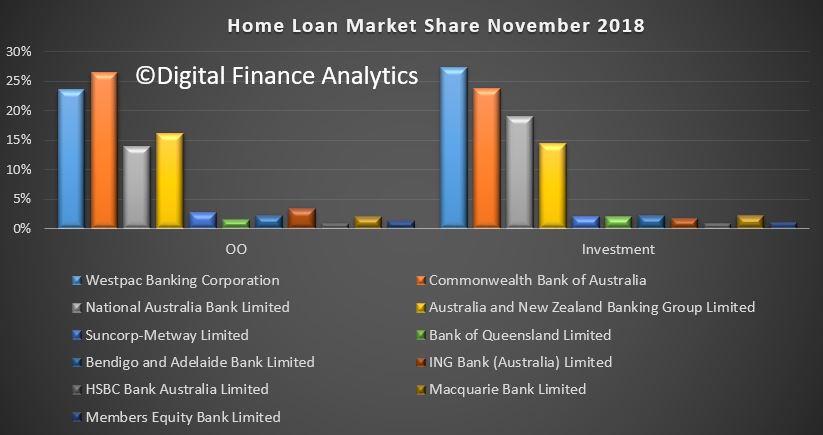
The monthly trend tracker highlights that owner occupied loans are growing significantly faster than investment loans.
Looking at the monthly portfolio movements among the banks, we see that among the big four, Westpac and ANZ saw a significant fall in the value of their investment loan portfolio, while CBA and NAB grew theirs. Macquarie continues to stand out as a lender writing a significant share of investment loans. CBA wrote the largest share of owner occupied loans, and we also see ING also focussing on owner occupied loans.
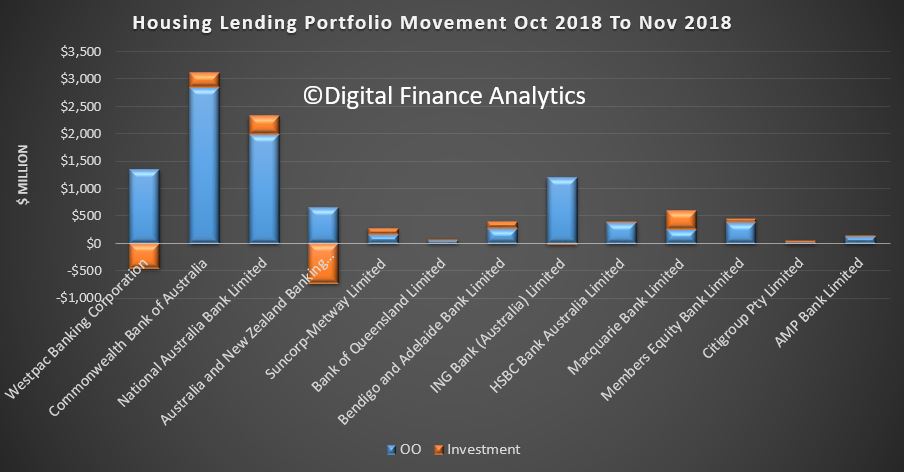
Overall, the banks portfolios are only moving at the margin, with CBA maintaining its position as the largest owner occupied lender, and Westpac the largest investor lender.
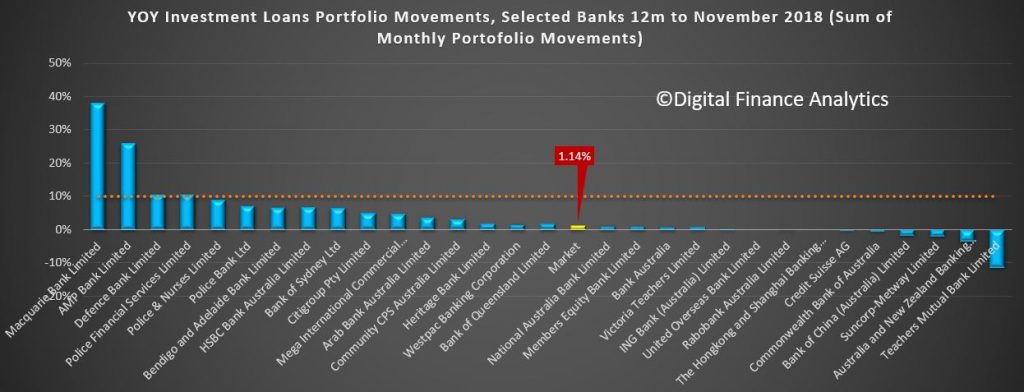
One other interesting (if obsolete) view is the relative growth in investor lending over the past 12 months. This was a focus of APRA but of course is now not being actively used as a control tool. Nevertheless, the data shows that AMP and Macquarie stand out with the largest portfolio growth, to November, while some of the majors are now in negative territory, including ANZ and CBA. Bendigo and Adelaide Bank are writing a greater relative share than the majors now. The market average across the year (sum of the monthly movements now stands at 1.14%. What a difference from a couple of years ago, APRA’s macroprudential intervention has certainly had an effect, despite being several years too late!).
One final data point, we can estimate the relative share of non-bank lending by comparing the RBA data and the APRA data. As discussed before this is tricky, given the delays in the non-bank data, and the fact that not all the non-banks are included in the dataset. That said, we can use the DFA tracker to show the relative movement between the banks and non-banks.
This makes interesting reading, and underscores that fact that the non-banks have been growing faster than the ADI’s in recent times. Non-Bank owner occupied annual lending is running at around 15.6% compared with a year ago, while investor lending grew around 1.9%. This compares with the market average from the RBA of 0.9% for investor lending and 6.4% for owner occupied lending. Its fair to conclude therefore than non-banks are lending like fury, compared with the ADI’s, a symptom of easy non-bank funding, different capital requirements, and a greater willingness to lead.
This is a sure sign of more trouble ahead, as we know that some borrowers rejected by the banks, because of their not meeting the tighter lending standards now in force are being swept up by the non-banks, where they often will pay a higher mortgage rate! This is something I discussed with Tony Locantro in our recent video – from first hand experience!.
Looking Back And Looking Forward
A quick retrospect of 2018, and my thoughts on 2019.
All the major indices are recording a fall year on year, so what might be ahead? And what of the wealth effect?
Plus news about the DFA channel. Yes, we still plan to make daily shows and more live events!
The Debt Machine Is Alive And Well
As we approach the end of the year, we got some stats from the RBA on credit to the end of November. Whilst the debt is growing the value of the housing assets are falling, this is a nasty pincer movement!
Their credit aggregates reveals that in seasonally adjusted terms total credit rose by 0.34% or $9.9 billion dollars, to a new record of $2.9 trillion dollars.
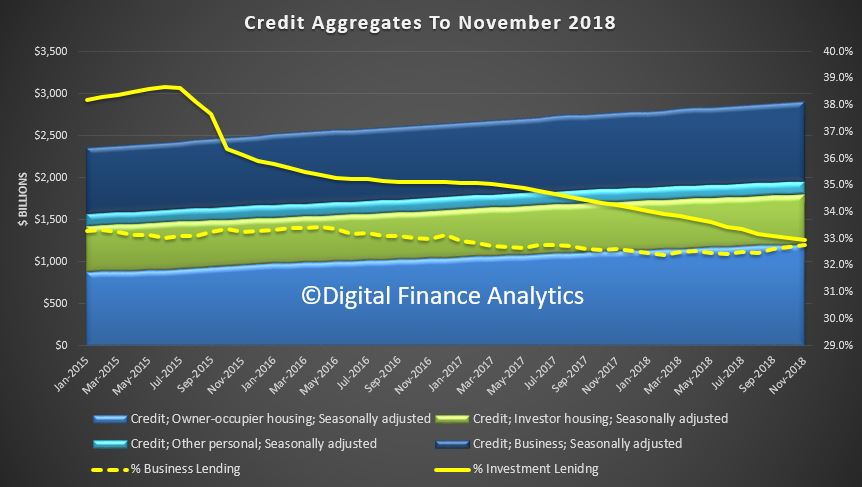
Within that credit for owner occupied housing rose 0.38%, or $4.63 billion to a new record $1.21 trillion dollars, lending for property investment was flat, standing at $0.59 trillion dollars and lending for business rose 0.56%, or $5.32 billion to $0.95 trillion dollars, another record. The proportion of business lending to all lending rose to 32.8%, while the share of residential property lending for investment property fell to 32.9%, the lowest in years (but still too high in my book!). Credit growth is too fast.
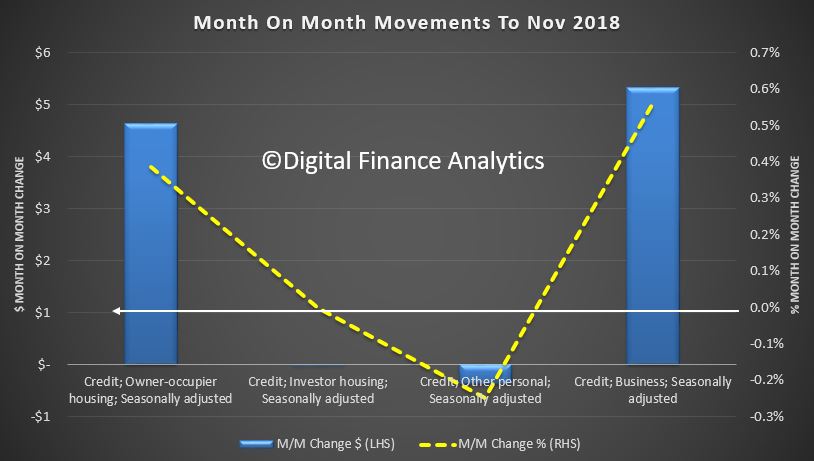
The trend charts show that on a 12 month basis, investment lending has now only growth 1.1%, while owner occupied lending is still running at 6.8%, still faster than business lending. Personal credit continues to fall.
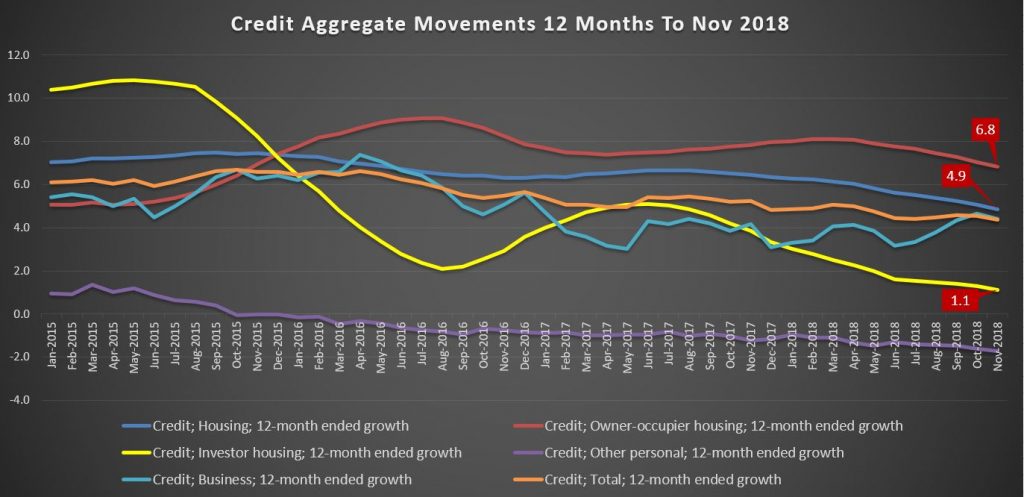
This indicates that despite all the hype about tight lending, loans are still being written, at a growth rate which is well above inflation and income. As a result the total debt burden is still rising. RBA please note.
We can see the consequences working out by looking at the latest Household Finance Ratios from the RBA, using ABS data
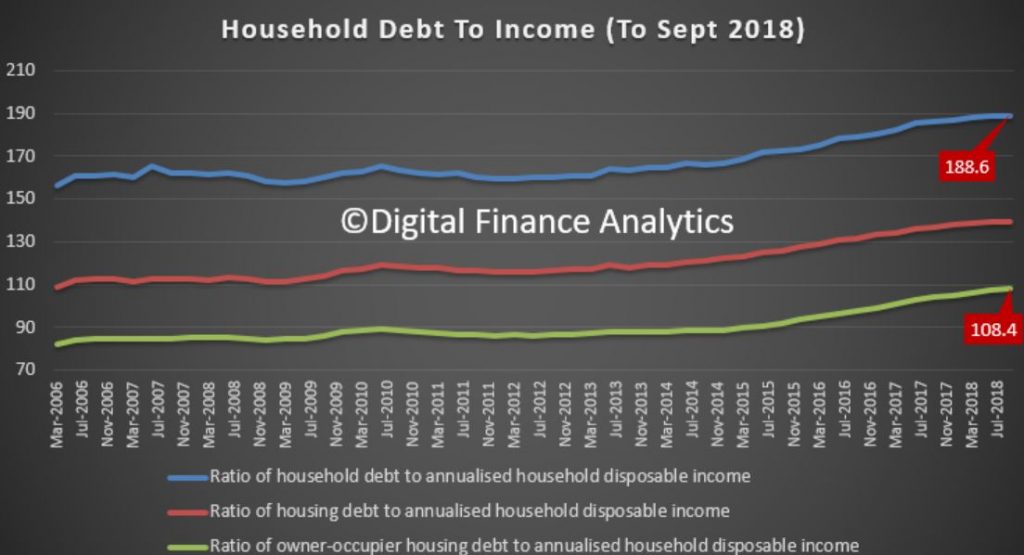
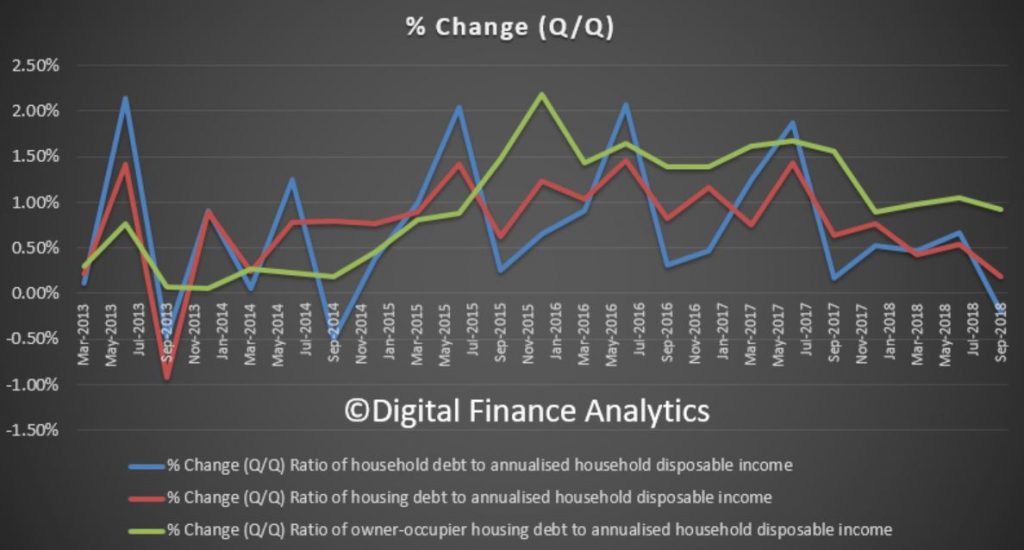
This shows that total household debt to income to September 2018 fell from 189 to 188.6, whilst the housing debt to income rose from 139.4 to 139.6 and the owner occupied ratio rose from 107.4 to 108.4. Now this ratio includes households and unincorporated businesses – small businesses essentially. So we see the continued consolidation of debt around housing, while other forms of debt, such as credit cards, diminished. In fact, the change quarter on quarter for owner occupied housing debt is close to 1%, so have no doubt, debt relative to income for housing is still rising.
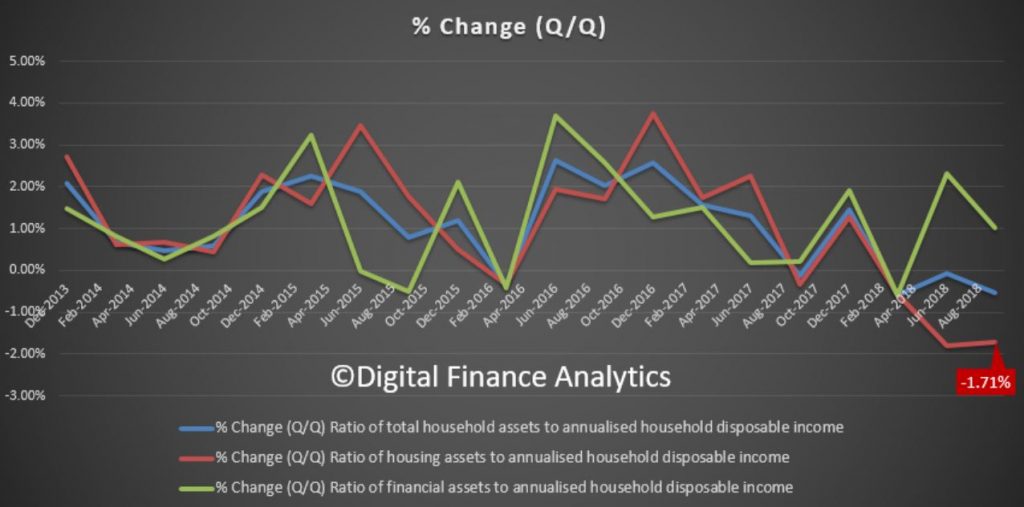
The assets to income data in the same series fell, thanks to the fall in value of housing.
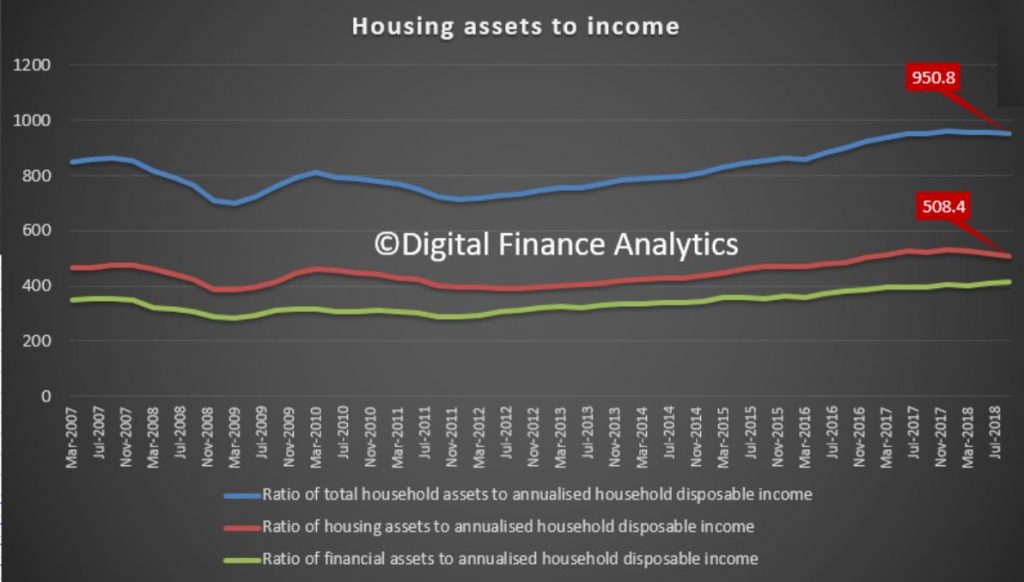
The ratio of household assets to income fell from 956.0 to 950.8, the ratio of housing assets to income fell from 517.3 to 508.4, down 1.7% in the quarter and 2.7% for the year to date, while the ratio of financial assets (stocks etc.) lifted from 410.3 to 414.5 (though will be lower now thanks to the recent market falls). In other words, whilst the debt is growing the value of the housing assets are falling – a double whammy.
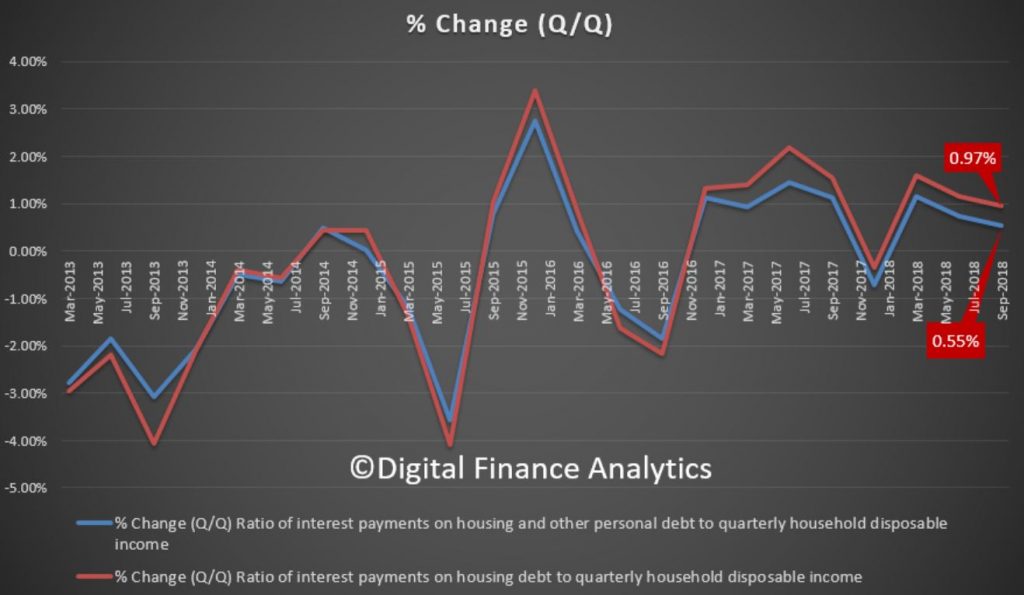
The final dimension is interest payments to debt, both of which are higher (thanks to bigger loans and only small changes in mortgage rates).
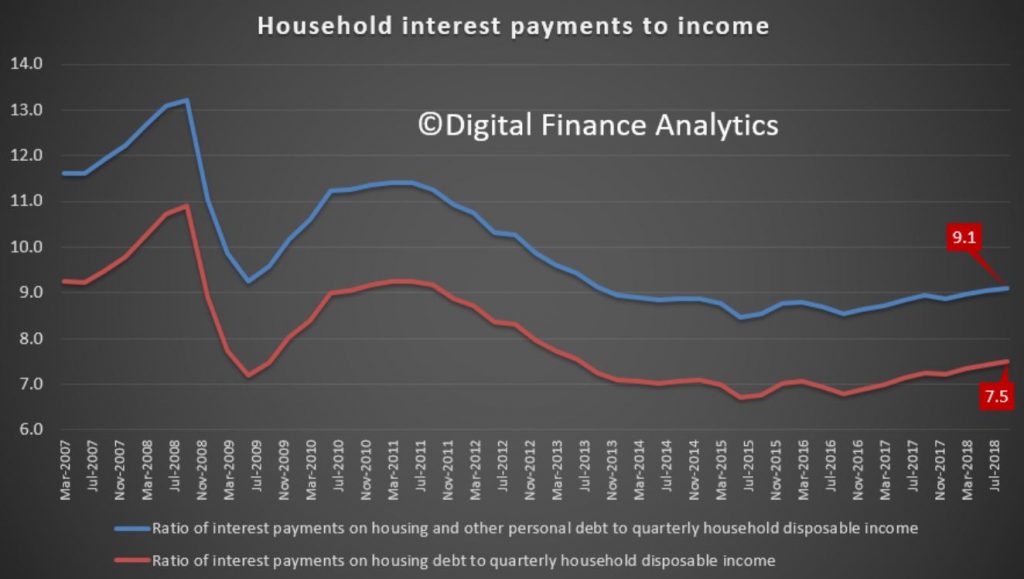
The ratio of housing debt interest repayments to income rose from 7.4 to 7.5 per cent and interest payments on all debt rose from 9.0 to 9.1 percent. This is confirming the growth trend since 2016, where the out of cycle interest repayments hit.
The point to note here is that the one third of households with mortgage debt are seeing a rise in the share of income going to support the interest repayments – at these extremely low, emergency interest rates. And that is the point, the averages mask the marginal borrower who remains under extreme pressure, which is why mortgage stress continues to rise. We will report on the December data in a week or so.
So the key take away as we move into 2019 is the debt machine is still working, more households are being encouraged to get deeper into debt, despite the clear evidence of massive over borrowing. A strategy applauded by the RBA, the Treasury and the Banks!
We really need a change in strategy because debt fueled household consumption and property speculation will be one of the nails in the economies coffin down the track. Interest rates will rise. The other is sporty corporate borrowing, but that is a story for another day!
Finally, seasons greetings to all our followers, and our best wishes for (a debt free) 2019!
My Brief Thoughts On 2019 For The ABC
Here is my contribution to ABC News 24 today where we discussed the local and international economic trends and the prospects for 2019.
Buckle up 2019 will be a bumpy ride!
Note the ABC got my location wrong, I delivered the content from the normal DFA studio, as followers will be able to recognise.
More From The Property Market Front Line
Drawing from his direct experience in the market, mortgage broker and financial adviser Chris Bates and I discuss the latest issues and look forward to what 2019 may bring.
Chris can be found at www.wealthful.com.au & www.theelephantintheroom.com.au plus via LinkedIn: https://www.linkedin.com/in/christopherbates
See his earlier posts:
Please consider supporting our work via Patreon
Or make a one off contribution to help cover our costs via PayPal
Please share this post to help to spread the word about the state of things….
Caveat Emptor! Note: this is NOT financial or property advice!!