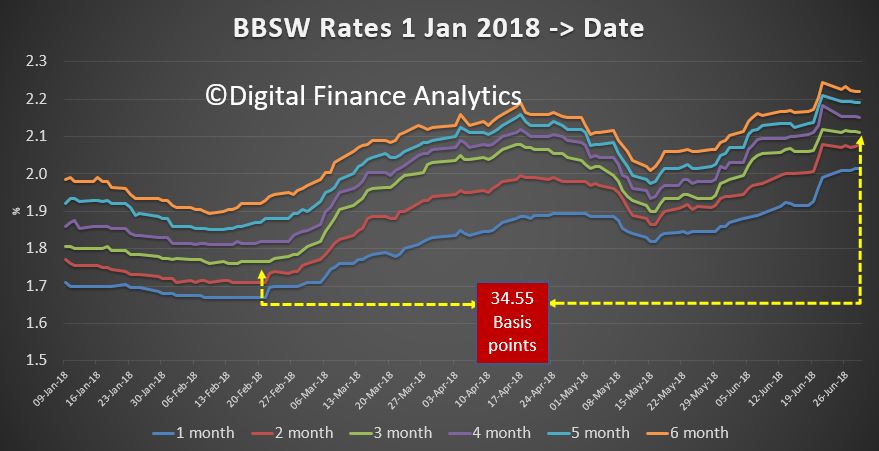
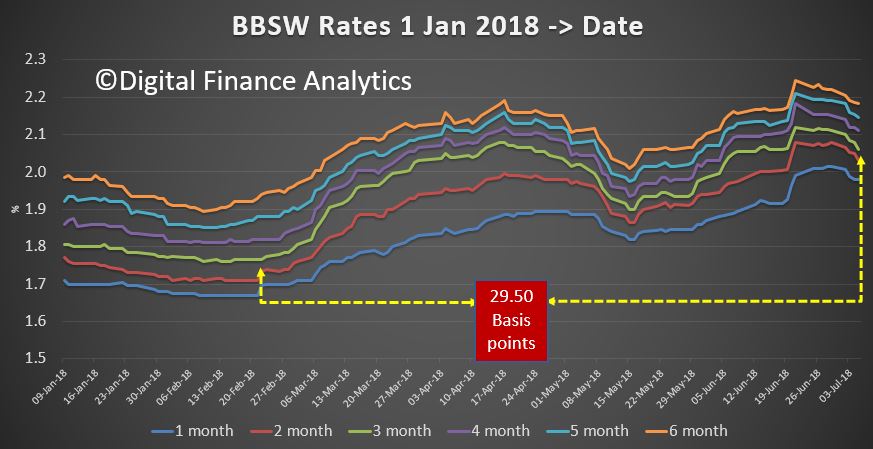
The latest BBSW data shows that in the past few days the gap between the 3 month rate in February and now has fallen from 35 basis points to around 29 basis points.
This mirrors recent short term movements in the US.
But as the Fed is likely to lift again, this slight relief may be just short term.
Welcome to the Property Imperative weekly to 7th July 2018, our digest of the latest finance and property news with a distinctively Australian flavour. By the way if you value the content we produce please do consider joining our Patreon programme, where you can support our ability to continue to make great content. Here is the link.
Watch the video, listen to the podcast, or read the transcript.
This week the RBA left the cash rate on hold once again at 1.5% and continued the trend of doing nothing. In fact, reading the release from Tuesday, it is worth noting two things. First they are being very gentle in referring to home price falls, saying “Nationwide measures of housing prices are little changed over the past six months. Conditions in the Sydney and Melbourne housing markets have eased, with prices declining in both markets. Housing credit growth has declined, with investor demand having slowed noticeably. Lending standards are tighter than they were a few years ago”. Second, we think they would like to lift rates to more normal levels, but cannot thanks to high debt, and downside risks. They are stuck. I believe the next move will be down as the economy weakens (dragged down by the fading property market, rising interest rates internationally, and concerns about China’ economic dynamo). But not yet.
Now compare this with a BIS report also out this week. The BIS is worried by the current low interest rate environment, and in a new report by a committee chaired by Philip Lowe, warn of the impact on financial stability across the financial services sector, with pressures on banks via net interest margins, and on insurers and super funds. They warn that especially in competitive markets, risks rise in this scenario. Low interest rates may trigger a search for yield by banks, partly in response to declining profits, exacerbating financial vulnerabilities. In addition, keeping rates low for longer may create the need to lift rates sharper later with the risks of rising debt costs and the broader economic shock which follows. A salutatory warning! We discussed this in more detail in our post “To “Bail-In” Or To “Bail-Out”, That Is Indeed The Question”.
The contrast between the theoretical macro policy position, and the local situation here in Australia, must at very least be giving Mr Lowe a bit of a headache!
The trajectory of global rates is upwards as we will discuss later. The latest from the FED is that further rate rises are required, and expected. So the FED is doing what the BIS report suggested. But the net result is pressure on Bank funding here, remember that around 30% of bank funding comes from overseas and the BBSW is higher still.
Two points to make here. First as credit availability is the strongest influence of home prices, the easy access to international capital markets the banks have had in recent years meant they could lend more, up to 30% more, hence disastrously higher home prices. Second the weight of evidence is that more banks will lift rates. Citigroup for example, forecasts that the rising cost of funding will prompt Australia’s four major banks to increase their mortgage interest rates independently of the RBA, with the banks tipped to begin lifting their mortgage rates by an average of eight basis points by September. Citigroup adds that the rise in banks’ short-term funding costs since early 2018 is likely to be sustained. And in effect the tenor of the RBA minutes signals to the banks they can go ahead and lift rates.
As rates have fallen, households have leveraged up, supported by lose lending policy and driving home prices to massive multiples of household income as data from IFM Investors showed this week.
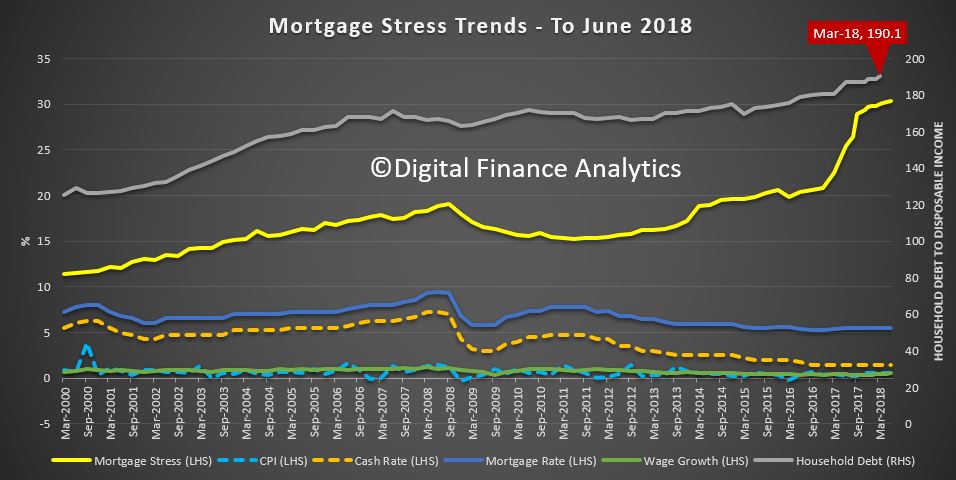
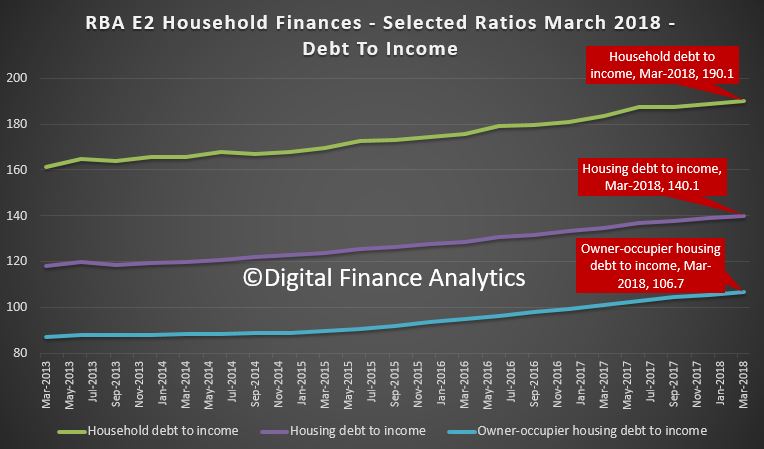
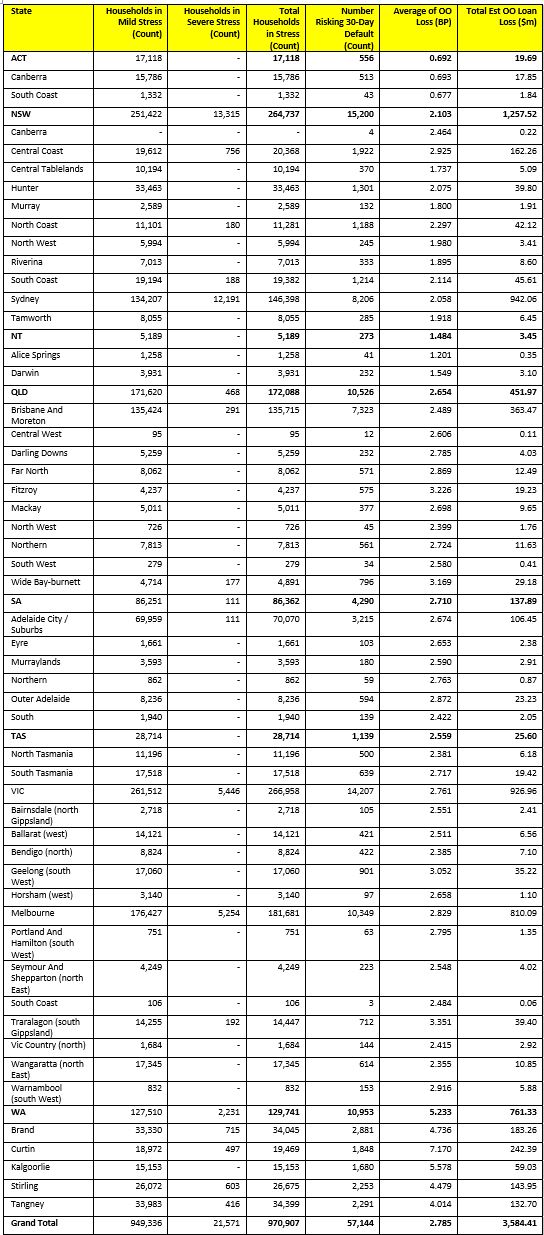
And even small rate rises will hurt, as we showed in our latest Mortgage Stress release for June, which was out this week. Mortgage stress continues to rise. Across Australia, more than 970,000 households are estimated to be now in mortgage stress (last month 966,000). This equates to 30.3% of owner occupied borrowing households. In addition, more than 22,000 of these are in severe stress. We estimate that more than 57,100 households risk 30-day default in the next 12 months. We expect bank portfolio losses to be around 2.8 basis points, though losses in WA are higher at 5.2 basis points. We continue to see the impact of flat wages growth, rising living costs and higher real mortgage rates. We discussed this in our post “The Debt Pips Are Squeaking”, in which we also discussed the latest anaemic retail sales figures, and the latest household debt to income ratio from the RBA which are now at a record 190.1. We are literally drowning in debt. And its structural.
The Australian Institute of Health & Welfare released a new report showing that home ownership is out of reach to growing numbers of Australians, thanks to high prices and poor affordability. They say that over the last 20 or so years Australia has seen a shift from outright ownership to owning with a mortgage, and a shift from overall home ownership to private rental Between 1995 and 2015, the proportion of outright owner-occupied households fell from 41.8% to 30.4%. Comparatively, the proportion of households owning with a mortgage has increased, from 29.6% to 37.1%, over the same period. Overall, the proportion of households in home ownership fell from 71.4% to 67.5%. There has also been an increase in the proportion of households renting privately (from 18.4% to 25.3%), and a decline in the proportion of households renting through state and territory housing programs (from 5.5% to 3.5%). Equally telling is home ownership rates between 1971 and 2016, by selected 5-year age groups. The home ownership rate of 30–34 year olds was 64%, and 50% for 25–29 year olds, in 1971. Forty-five years later these rates have decreased notably, with the home ownership rate of 30–34 year olds falling 14 percentage points to 50%. Similarly, that of 25–29 year olds fell 13 percentage points (to 37%). While declines are evident for other age groups they are much less marked. So fewer Australians are tending to own their home at retirement. For Australians nearing retirement, for example, age groups 50–54, 55–59, and 60–64, home ownership rates peaked in 1996 at 80%, 82% and 83%, respectively Since 1996 however, there has been a gradual decline in home ownership rates, most notably in the 50–54 age group which has seen a 6.6 percentage point fall over these 20 years (from 80.3% to 73.7%). This is one reason why we are watching closely our “Down Trader” segment – people seeking to sell and release capital. There are 1.2 million in this state, compared with around 600,000 up Traders, and 150,000 first time buyers. So on simple supply demand logic, more people selling than buying means prices will fall further.
And on that note, CoreLogic said that the weighted average clearance rate has tracked below 60 per cent for 8 consecutive weeks now, while over the same 8-week period last year clearance rates were tracking within the low 70 to high 60 per cent range. Last week Melbourne’s final auction clearance rate fell to 57.2 per cent across a lower volume of auctions week-on-week with 791 held, down on the 941 auctions over the week prior when a higher 59.9 per cent cleared. In Sydney, less than half of the homes taken to auction sold last week. The city returned a final auction clearance rate of 49.7 per cent, down slightly on the 50.1 per cent the previous week, with volumes across the city remaining relatively steady over the week with a total of 634 held. All of the remaining auction markets saw a lower volume of auctions last week, with the final clearance rate across each market also falling week-on-week. There were also a large number of passed in auctions.
Gerard Minack from Minack Advisors said this week that the housing market looks ‘thin’, hinting that prices may be unusually sensitive to a change in demand. Historically housing market turnover tracked price growth. However, turnover has been soft relative to price gains over the past 3-4 years, and in the March 2018 quarter turnover fell to the lowest level since the 1990 recession.
There are still many economists talking of just a small slide in prices over the next few months, but we suspect they are underestimating the impact of tighter credit. For example, Macquarie suggested from their annual mystery shopping survey mortgage power – the amount people could get when applying for a mortgage had not dropped that much at all. But in fact, it seems the non-banks, those not under so much scrutiny from APRA is where the bigger loans reside.
Whereas UBS, the arch property bears, suggest that credit tightening will continue, as lending flows ease, saying one of the key recommendations of the Royal Commission is likely to be a stricter interpretation of Responsible Lending. In particular “reasonable steps” required to verify customers’ financial positions. This is likely to require credit licensees (banks and non banks) to verify living expenses from customers’ transaction banking and credit card data over a period of around 12 months. They go to say that as ANZ stated in its submission to the Royal Commission, verifying living expenses from transaction accounts and credit cards is operationally complex and will likely require substantial investment in technology to automate this process. So UBS believes that while the major banks will be able to absorb these costs, such technological investments may be prohibitive for many of the smaller players. Therefore, they believe that any potential regulatory mismatch benefiting the smaller banks and non-banks is unlikely to be sustainable. In other words, credit will be tighter soon, driving prices lower.
The Corelogic’s Housing Index showed that prices slipped again last week in Sydney, down 0.13%, Melbourne down 0.11%, Adelaide down 0.01% and Perth down 0.07%. Brisbane rose 0.02%. On a 12 month basis, Sydney on average has dropped 4.69%, while Perth has fallen 2.08%. The other centres have risen just a little. But it is worth remembering that Sydney prices are still 66% from the last trough, Melbourne 56%, Brisbane 21% and Adelaide 19%. Perth is only 0.4% higher, thanks to the prevailing weak economic conditions in the West. This weakness also has translated into rental rates, with Perth seeing just a 3% rise over the past 10 years for houses, and a small fall for units. Compare this with a national rise in rentals over the same period of 25.7%. At the other end of spectrum rentals rose 53.8% for Hobart houses, and 44.7% for units, highlighting the housing cost pressure there.
Despite the falls in property values, and the expected future further falls, the AFR said Labor has shrugged off suggestions from the property industry that its planned changes to negative gearing rules should be scrapped because of market conditions. They reported that Shadow treasurer Chris Bowen told a Property Council of Australia forum in June the changes were about making long-term structural adjustments, rather than addressing the short-term cycle. The policy was a once in a generation reform. We think he is right.
The Royal Commission in Darwin this week heard about the thousands of Aboriginal people who are sold unsuitable financial products and vulnerable consumers are targeted by instant cash loan machines because the financial landscape supports predatory practices. Insurance agents were able to exploit and target Aboriginal people because the industry isn’t fully regulated. An excellent The Conversation Article made the point that the cultural, economic and political arrangements that allow this to happen are called “practice architectures”. They include the complex language used to deceive consumers into buying unsuitable products, incentivised high pressures sales tactics, and a lack of care and concern for vulnerable consumers. All of these aspects are within the scope of financial regulators. The funeral insurance industry can push dodgy products because no one is watching. Predatory financial practices will continue until governments and/or regulators do something about it.
More evidence of regulators not doing their job, and the financial sector simply exploiting their customers to make a quick buck.
We heard this week that ASIC has accepted court enforceable undertakings from the Commonwealth Bank of Australia and Australia and New Zealand Banking Group under which the banks have agreed to change the way they distribute superannuation products to their customers. ASIC investigated CBA’s distribution of its Essential Super product and ANZ’s distribution of its Smart Choice Super and Pension product through bank branches. ASIC found a common practice of offering those products to customers at the conclusion of a fact-finding process about customers’ overall banking arrangements. ASIC was concerned that customers may have thought, due to the proximity of the fact-finding process to the offer of Essential Super or Smart Choice Super, that the CBA branch staff or the ANZ branch staff were considering risks specific to the customer when this was not the case. These court enforceable undertakings prevent CBA from distributing Essential Super in conjunction with a Financial Health Check and ANZ from distributing Smart Choice Super in conjunction with an A-Z Review. They also require CBA and ANZ to each make a $1.25 million community benefit payment. If there is a breach of the undertaking ASIC can, under the ASIC Act, apply for orders from the court to enforce compliance. But whilst individuals risk being sent to prison as one Perth finance broker, did this week, or permanently banned from the finance industry for loan fraud, the asymmetric penalties between the small guys and the big firms is – well shameful. It seems to me regulators are going for the easy targets who cannot fight back, whilst imposing mild penalties on the big guys, for fear of court proceedings. The balance is just wrong.
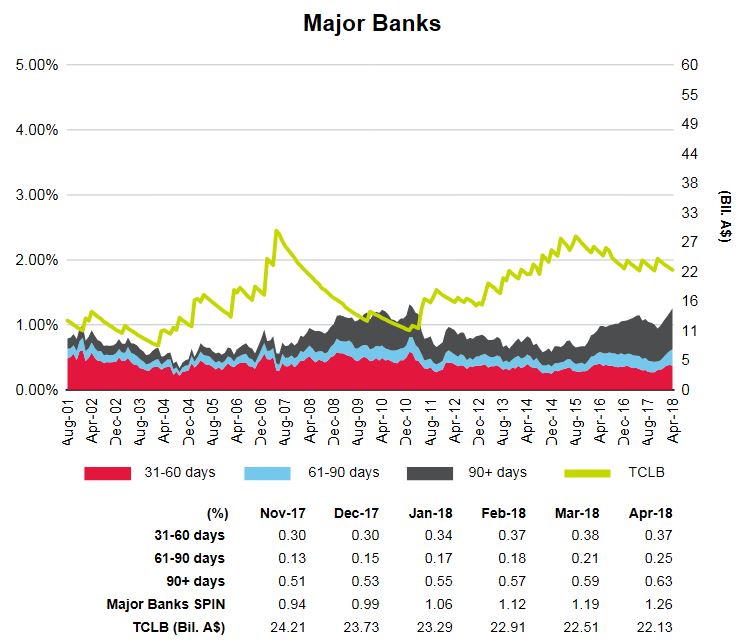
Finally, looking across the markets, shares in Australia started the new financial year well, with most banking stocks going higher. Bendigo Bank was up 1.72%, Suncorp up 0.54% and even the languishing Bank of Queensland rose 0.77%. Westpac was up 0.85%, ANZ up 1.97% on its buybacks, NAB up 1.6% and CBA up 1.2%, though still below its peak in 2017 when it was above $82. So risks in the mortgage book are clearly not worrying investors that much just now. This despite the 90-Day mortgage default rates going higher as reported in the S&P Ratings SPIN Index. Macquarie, who has more business offshore than on shore rose 0.42%, at 122.96, just off its all-time highs, The ASX 200 ended higher up 0.91% to 6,272, a solid rise. The Aussie Dollar did a little better too against the US Dollar settling at 74 cents, up 0.57% and against the Chinese Yuan up 0.7% to $4.94.
Now back to global debt. Deutsche Bank published a chart which showed that of the $50 trillion global bond market, about $8 Trillion of these bonds are now trading at negative interest rates, thanks to changes in interest rates across the market. Within the $50 trillion, the amount of nonfinancial corporate bonds has increased 2.7 times over the past decade to $11.7 trillion, according to Mckinsey. Debt in China has outgrown that in the USA, based on GDP, with non-financial corporate debt in China sitting at 160% of GDP, compared with 97% in the USA, according to JP Morgan. The China credit boom, is well, booming…
This all signals more trouble ahead, given that the US 3 Month bond rate and LIBOR are sitting at highs, and the 10 Year US Bond Rate remains elevated, reflecting the expectation of more FED rate hikes ahead. And the latest from the FED is that further rate rises are required, and expected.
U.S. stocks finished the week mostly higher, thanks mainly to low-volumes of buyers on Friday. The S&P 500 finished the week up about 1.5% and the Dow ended about 0.8% higher for the week. The big winner was the tech-heavy NASDAQ Composite, which closed up about 2.4% for the week. The DOW ended the week up 0.41% to 24,456 after light holiday trading.
US employment data showed still-solid growth in payrolls, but lower-than-expected wages, which eased inflation concerns. Nonfarm payrolls rose by 213,000 in June. That was higher than the consensus estimates of 200,000. The jobless rate unexpectedly rose to 4.0% from 3.8%, missing consensus expectations for it to remain unchanged as more people entered the labor force. Average hourly earnings advanced 0.2% month-on-month in June, below expectations. The data still suggests the Federal Reserve will gradually raise interest rates. The markets are still pricing in two more rate hikes this year.
The real unknown though is the U.S, China Trade Battle which is now officially underway. The U.S. has put tariffs in place on $34 billion worth of Chinese goods and the Chinese hit right back with tariffs on $34 billion on U.S. goods going into effect. China said the U.S. had “launched the largest trade war in economic history to date.” And the U.S. administration is already looking at ramping up the amount of tariffed goods, threatening another 16 billion dollars in two weeks, and then more later. No one knows where this will lead. But there are risks for Australia and other countries getting caught in the cross-fire.
The U.S. dollar endured a tough week that was not helped by the mixed jobs numbers that offered little encouragement for traders looking for faster Fed hikes. The dollar index, which compares the greenback to a basket of six currencies, was down about 0.7% for the week. The dollar also faced pressure from the euro during the week. German Chancellor Angela Merkel resolved an immigration battle and with her interior minister that had threatened the future of her coalition government.
Oil continued higher through the week, as supply limits kicked in, up 1.33% to 73.91, and Gold fell again, down 0.23% as risks abated.
And finally, Bitcoin recovered a little to 6,615 but remains volatile, while the broader VIX index sits slightly above the lows seen last year, but below the peak of a few months back.
So it seems that investors are banking on the debt elastic not snapping back anytime soon, but we will be watching for further signs of stress given the massive amount owing out there as rates rise. Meantime banks are making hay, despite the levels of uncertainly out there. As the BIS report put it “A key takeaway is that, while a low-for-long scenario presents considerable solvency risk for insurance companies and pension funds and limited risk for banks, a snapback would alter the balance of vulnerabilities,”. We have been warned.
Before I sign off, mark your diary. On the 17th July at 8 PM Sydney time I will be running our next live streaming session, where you can discuss in real time the issues in play. Judging by the previous session, it will be a lively event. I will schedule it shortly on our YouTube channel.
The IMF has published an excellent piece on their blog, which sharply defines the issues around bank bail-out and bail-in should a bank fail.
The trouble is the “bail-in” route which they define as targetting “Sophisticated Investors” such as super funds, effectively means a indirect risk to households who save via their superannuation, and of course there is the risk that even deposits could be grabbed as is explicitly stated in New Zealand.
The IMF argues that the risk of bail-in means prospective investors should see a premium to cover the risk, in the returns they get from their investments. But it seems to me in an attempt to deflect risks away from governments being forced to bail-out a bank, once again the end user of financial services products are effectively taking the risks, and creating a moral hazard, where banks and governments can pass the buck.
Watch my previous video:
During the global financial crisis, policymakers faced a steep trade-off in handling bank failures. Using public funds to rescue failing banks (bail-outs) could weaken market discipline and lead to excessive risk taking—the moral hazard effect.
Letting private investors absorb the losses (bail-ins) could destabilize the financial sector and the economy as a whole—the spillover effect. In most cases, banks were bailed out.
This created public resentment and prompted policymakers to introduce measures to shift the burden of bank resolution away from taxpayers to private investors.
Resolving a failing bank should rely on bail-ins: private stakeholders should bear the losses.
Our recent study, also featured in an Analytical Corner in the 2018 Spring Meetings, looks at the question of what to do when a bank fails.
We advocate a resolution framework that carefully balances the moral hazard and spillover effects and improves the trade-off. Such a framework would make bail-outs the exception rather than the rule.
Balancing moral hazard and spillover effects
Not all crises are alike. Some are isolated, with little or no spillover effect. In those cases, bail-outs would merely create moral hazard. Resolving a failing bank should rely on bail-ins: private stakeholders should bear the losses.
Other crises are systemic, and affect all corners of an economy or many countries at the same time.
The destabilizing spillovers associated with bank failures in such a situation would justify the use of public resources: moral hazard still exists but is bearable compared to the alternative of a severe crisis that hurts all, including those without a stake in the troubled bank.
So, the framework should commit to using bail-ins in most cases and allow use of public funds only when the risks to macro-financial stability from bail-ins are exceptionally severe.
Improving the trade-off
The best way to avoid such dilemmas is to reduce spillovers and the need for bail-outs in the first place. This can be achieved through two mutually re-enforcing mechanisms.
The first mechanism is reducing the likelihood of crises and minimizing costs should a crisis occur. This translates into having a more resilient banking system: less leverage and risk taking, and more capital and liquidity. Then the odds that a bank runs into trouble are smaller. And, if there is trouble, banks can absorb the losses without help from the government.
The second mechanism is making the bail-in option viable. The problem is that policymakers may make the promise to bail in a troubled bank but, in a crisis, they will be tempted to bail them out. So people will not believe that bail-ins will happen and continue to expect bail-outs.
This is the worst of both worlds, because it has spillover and moral hazard effects.
How do policymakers make a credible commitment that there really will be bail-ins?
First, ensure that banks have enough buffers to absorb losses and clarify upfront which investor claims (such as bonds and deposits) will in the event of failure be written down and in what order. Second, only allow sophisticated investors who can understand and absorb the losses to hold these bail-in-able claims. Third, improve systemic banks’ resolvability by periodic assessments, living wills that spell out how the bank will be resolved, and domestic and cross-border drills to assess the impact of a threat.
Turning to the other side of the trade-off, how do we limit moral hazard?
First, credibly commit to using bail-outs only in exceptional cases and on a temporary basis with a clear exit plan. Second, use public funds only after those that can absorb the losses have been bailed in. Third, recover these bail-out funds after the storm has passed and ensure that all is executed in a transparent, accountable manner.
The way forward
Reforms since the crisis have improved the trade-off by seeking to make bail-ins a credible option and to make bail-outs less likely.
New frameworks—such as those in the United States and the European Union—introduce comprehensive powers to resolve banks, including through bail-ins. These measures also seek to contain spillovers from bail-ins by ensuring that banks have adequate buffers to absorb losses, and aim to make them more resolvable via effective resolution planning.
We support the ongoing reform agenda and stress that resolution frameworks should minimize moral hazard. That said, we also emphasize the need to allow for sufficient, albeit constrained, flexibility to be able to use public resources in systemic crises—when spillovers are deemed likely to severely jeopardize macro-financial stability.
The BIS is worried by the current low interest rate environment, and in a new report by a committee chaired by Philip Lowe warn of the impact on financial stability across the financial services sector, with pressures on banks via net interest margins, and on insurers and super funds. They warn that especially in competitive markets, risks rise in this scenario. Low interest rates may trigger a search for yield by banks, partly in response
to declining profits, exacerbating financial vulnerabilities.
In addition, keeping rates low for longer may create the need to lift rates sharper later with the risks of rising debt costs and the broader economic shock which follows. A salutatory warning!
Interest rates have been low in the aftermath of the Global Financial Crisis, raising concerns about financial stability. In particular, the profitability and strength of financial firms may suffer in an environment of prolonged low interest rates. Additional vulnerabilities may arise if financial firms respond to “low-for-long” interest rates by increasing risk-taking.
The decade following the Great Financial Crisis (GFC) has been marked by historically low interest rates. Yields have begun to recover in some economies, but they are expected to rise only slowly and to stabilise at lower levels than before, weighed down by a combination of cyclical factors (eg lower inflation) and structural factors (eg productivity, demographics). Moreover, observers put some weight on the risk that interest rates may remain at (or fall back to) very low levels, a so-called “low-forlong”
scenario. An environment characterised by “low-for-long” interest rates may dampen the profitability and strength of financial firms and thus become a source of vulnerability for the financial system. In addition, low rates could change firms’ incentives to take risks, which could engender additional financial sector vulnerabilities.
In light of these concerns, the Committee on the Global Financial System (CGFS) mandated a Working Group co-chaired by Ulrich Bindseil (European Central Bank) and Steven B Kamin (Federal Reserve Board of Governors) to identify and provide evidence for the channels through which a “low-for-long” scenario might affect financial stability, focusing on the impact of low rates on banks and on insurance companies and private pension funds (ICPFs).
Now a report by the Committee on the Global Financial System finds that low market interest rates for a long time could have implications for financial stability as well as for the health of individual financial institutions. Philip Lowe, Chair, Committee on the Global Financial System and Governor, Reserve Bank of Australia said:
“The adjustment of financial firms to a low interest rate environment warrants further investigation, especially when low rates are associated with a generalised overvaluation of risky assets. I hope that this reports provides both a sound rationale for ongoing monitoring efforts and a useful starting point for future analysis”.
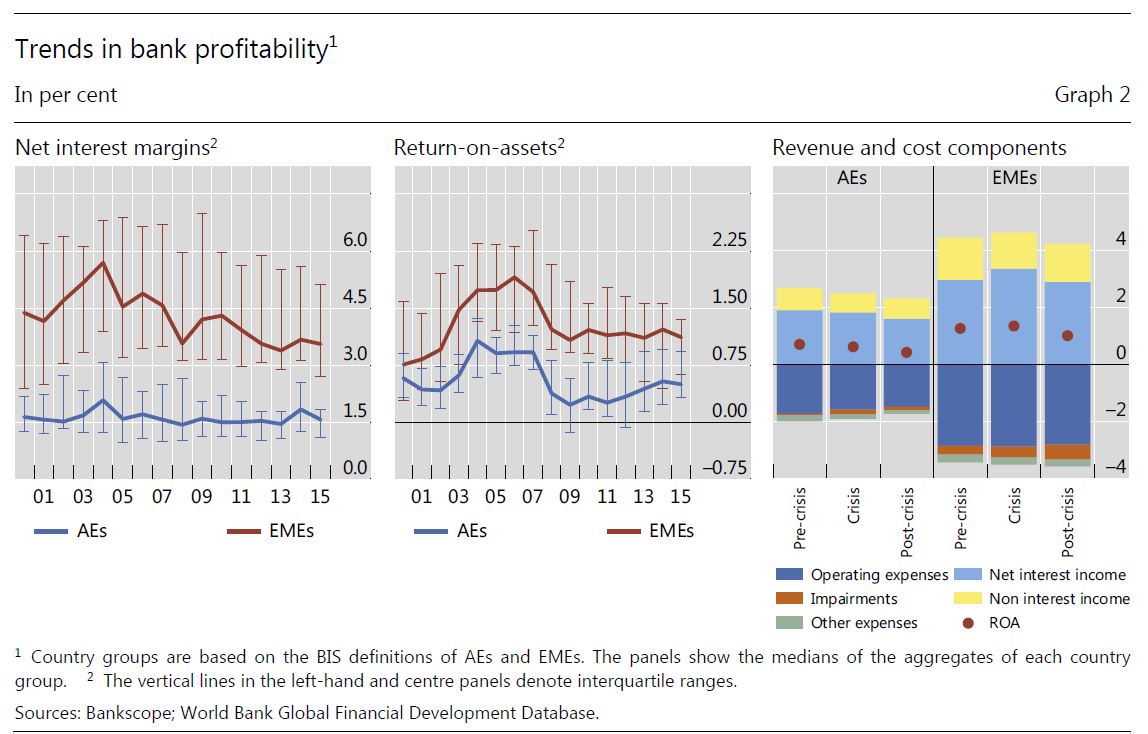
For banks, based on econometric evidence, simulation models, and reviews of past stress tests, the Working Group found considerable evidence that low interest rates and shallower yield curves depress net interest margins (NIMs). This effect was more pronounced for banks facing constraints on their ability to reduce deposit rates, for example, because of very low interest rates or strong competitive pressures. low rates might reduce resilience by lowering profitability, and thus the ability of banks to replenish capital after a negative shock, and by encouraging risk-taking. These effects can be expected to be particularly relevant for banks operating in jurisdictions where nominal deposit rates are constrained by the effective lower bound, leading to compressed net interest margins. For banks in emerging market economies (EMEs), such adverse effects might materialise not only as a result of low domestic interest rates but also as a consequence of “spillovers” from low interest rates in advanced economies (AEs), which can encourage capital inflows into EMEs, excessive local credit expansion, and heightened competitive pressures for EME banks.
Lower for longer would be harder on insurers and pension funds than on banks. Even though the CGFS analysis did not show that measures of firms’ financial soundness dropped significantly, prolonged low rates could still involve material risks to financial stability. In particular, a “snapback”, involving an unexpected sudden increase in market rates from currently low levels, could affect banks’ solvency and create liquidity issues for insurers and pension funds.
“A key takeaway is that, while a low-for-long scenario presents considerable solvency risk for insurance companies and pension funds and limited risk for banks, a snapback would alter the balance of vulnerabilities,”
Chair Philip Lowe, said.
“The first line of defence against these risks should be to continue to build resilience in the financial system by encouraging adequate capital, liquidity and risk management. But the report also underscores the need to monitor institutions’ exposures in a comprehensive way, including through stress tests.”
The CGFS is a central bank forum for the monitoring and analysis of broad financial system issues. It supports central banks in the fulfilment of their responsibilities for monetary and financial stability by contributing appropriate policy recommendations.
Dwelling investment has gone from making a positive contribution to growth two years ago to being roughly flat over the year to March. In terms of our forecasts, dwelling investment is not expected to contribute much to growth over the next couple of years, but is expected to remain at a high level.
To understand the outlook, it is helpful to recognise that there isn’t a single national housing market. At the state level, there have been some similarities in the evolution of dwelling investment, but there have also been distinct differences (Graph 5).
Graph 5
One point of similarity is that the construction of higher-density apartments has been much more important than in the past, especially in the east-coast capitals. We have used our liaison program quite extensively to understand how to adapt our forecasting processes to take into account that the time taken for a building approval to progress to construction and the period of construction is longer and more variable for high-density projects than for detached dwellings. The liaison program, which includes organisations such as the UDIA and its members, has also allowed us to gain deeper insights into specific local factors, such as differences in planning rules and the emergence of capacity constraints in the housing construction sector.
One point of difference across states has been the timing of dwelling investment cycles. For New South Wales and Victoria, the level of dwelling investment has been broadly stable at a high level since 2016. In contrast there has been a decline in higher-density construction in Queensland since early 2017. In Western Australia, residential construction peaked in mid 2015, which was well after the end of the mining boom. These differences highlight the fact that there are different demand and supply forces at work across the states. Given time constraints, I am going to focus my attention on the demand side of the market.
An important driver of housing demand over the long run is the rate at which new households are being formed. This depends on population growth and changes in the average number of people who are living in each household. Household size declined steadily in Australia between 1960 and 2000 before levelling out, alongside declines in marriage and fertility rates and population aging. The natural increase in the Australian population has also declined over time due to demographic factors. In particular, lower fertility rates have offset increased life expectancy (Graph 6). Having said that, the rate of natural increase in Australia’s population remains higher than in most other advanced economies.
Graph 6
Immigration has also been a feature of the population growth story and it has certainly been the dominant influence on the swings in population growth over the past decade. The largest single category of net overseas migration has been people on temporary student visas (Graph 7). Prior to the financial crisis, a large share of these students were coming to Australia for vocational training courses. Following changes to visa requirements, student visa numbers initially dropped, but have picked up again in recent years, mostly due to an increase in students attending university. To put this into perspective, education now accounts for around 10 per cent of Australia’s total exports, which is in the same ball park as our rural exports. From the perspective of demand for housing, the important point is that most of these students have gone to Sydney and Melbourne.
Graph 7
Another interesting category is skilled workers. The net inflow of people on skill visas increased in response to demand for workers during the mining boom. Most of these workers went to Western Australia and Queensland. At the same time, net migration to Western Australia and Queensland from other states and New Zealand also increased. As the mining sector transitioned from the construction to the production phase of the mining boom, the demand for labour fell. The number of people on skilled visas fell and the inflow of people from New Zealand and other Australian states turned to an outflow.
As a consequence, there have been quite large differences in population growth at the state level, which have had direct effects on the demand for housing (Graph 8). Population growth is expected to remain strong, particularly in Victoria and New South Wales, and the net overseas migration component of this is expected to be driven by people on student visas.
Graph 8
On the supply side, the pipeline of residential construction that has been approved, but not completed remains high in New South Wales and Victoria (Graph 9). There is also a reasonable pipeline of work in Queensland, although it has already started to decline. Based on recent approvals data and expected demand conditions, this suggests that dwelling investment in New South Wales and Victoria will remain at a high level for a number of years. Liaison contacts have suggested to us that capacity constraints in the construction industry, particularly in New South Wales, will make it difficult for construction activity to increase.
Graph 9
Of course household formation and population growth are not the only drivers of housing demand. For example, interest rates and changes in lending standards can also influence how much households are willing and able to spend on housing. Another way to gauge the current balance of housing supply and demand is to look at housing price growth.
Over the past five years, housing price growth has been subdued in Brisbane and Perth (Graph 10). This is consistent with the fall in population growth coinciding with an increase in the supply of housing. In contrast, housing price growth has been strong until recently in Sydney and Melbourne, where population growth has been strong. Given that housing accounts for around 55 per cent of total household assets, we are paying close attention to these developments.
Graph 10
The Housing Market in the Illawarra Region
From a demand perspective, the Illawarra region has experienced a pick-up in population growth. Some of this has come from overseas students attending the University of Wollongong, and some has come from people migrating to the Illawarra region from Sydney. Although the Illawarra region is a little older, on average, than the rest of Australia and Sydney, it still has a large working-age population (Graph 11).
Graph 11
This is partly because its geographic proximity and transport infrastructure allow people living in Wollongong and the Illawarra region to commute to Sydney. Around 20 per cent of Wollongong workers commute at least 50 kilometres to work (Graph 12). This is one of the highest rates in the state. Unsurprisingly, five of the seven areas with higher shares of people commuting more than 50 kilometres are also within commuting distance of Sydney. Illawarra residents are also well placed to benefit from the fact that some of the fastest growing areas of Sydney are in south and south-west, including the proposed “aerotropolis” around the new airport at Badgery’s Creek. Access to these growth areas will be enhanced if some of the recently announced transport infrastructure plans are realised.
Graph 12
Although people from the Illawarra region can and do commute to Sydney, labour market conditions in the Illawarra region itself have also been strong recently (Graph 13). In combination, these factors mean that there has been strong employment growth for those living in the Illawarra region over the past five years and the unemployment rate is close to the average for New South Wales, which is, in turn, lower than the Australian unemployment rate.
Graph 13
Strong population growth and the economic prosperity associated with strong labour market outcomes have led to higher housing prices in the Illawarra region (Graph 14). Just as in Sydney, developers have responded to the higher prices, and dwelling investment in the region has increased. Also similarly to Sydney, there has been a debate about whether the infrastructure has been growing fast enough to accommodate the needs of an expanding population and the increase in construction that goes with that.
Graph 14
Conclusion
In summary, over the past couple of years, non-mining business investment has become a more important driver of growth in the Australian economy. This is a good thing because investment of this kind is necessary to ensure future productivity growth, which is ultimately what contributes to the economic prosperity and welfare of the Australian people. Infrastructure investment has been a part of this story.
At the same time, dwelling investment growth has eased off. Although dwelling investment is still expected to remain at a high level, particularly in New South Wales and Victoria, it is not likely to contribute much to growth over the next couple of years. Demand for housing remains strong because population growth is expected to stay strong. However, the housing story is different across states and across regions within states, partly because population trends differ. The effects of the mining investment cycle on population trends and housing markets in Western Australia is a clear-cut illustration of this point.
The data show that population trends and housing market developments in the Illawarra region are closely linked to those in Sydney, partly because the transport infrastructure allows people to live in the Illawarra region and commute to Sydney. Future transport infrastructure plans and the development associated with the Badgery’s Creek airport are likely to strengthen these ties. As always, the key to effective urban development is high-quality, transparent cost-benefit analysis of potential infrastructure projects informed by local knowledge. The UDIA has an important role to play here. The UDIA and its members, in Wollongong and elsewhere, also have an important role to play in macroeconomic policy by informing the Bank’s understanding of the factors at play in different housing markets through our liaison program.
The banking and financial services Royal Commission has unearthed the unethical practices and incentives of life insurers selling policies over the phone at the expense of the most vulnerable customers living in remote communities; via Financial Standard.
ASIC Indigenous Outreach Program senior policy analyst Nathan Boyle highlighted the rampant practice of signing up customers by being forced into policies they allegedly didn’t need or unwittingly signed up for.
Based on listening to several phone calls from ClearView Life Insurance, Boyle alleged staff coaxed customers into providing bank details and enough personal information which then entered them into a contract without knowing, he said.
This is the way “gratuitous concurrence can play out in practice,” he added.
Boyle was referring to ASIC’s review of ClearView in February, which used unfair and high pressure sales tactics when selling life insurance direct to consumers over the phone between 1 January 2014 and 30 June 2017.
Of 32,000 life insurance policies sold, 1166 were to consumers residing in areas with high indigenous populations that unlikely spoke English as their first language.
ClearView has since ceased selling life insurance directly to consumers and refunded $1.5 million to thousands of customers as a result of poor sales practices.
The Commission heard the story of Kathy Marika, an indigenous woman who was convinced into buying a funeral insurance policy with Let’s Insure (which is owned by Select AFSL) even though she was already covered.
Marika said she couldn’t fully understand the representative, who spoke over her and at great length and initially believed was calling about a survey. Ultimately, she said the representative was “forcing” her to sign up to a policy that deducted $60 per month from her account.
“I told them that I didn’t want it. I told them I’ve already had one, but he seemed to be really pushing or asking me to say ‘yes,'” she said.
When Marika eventually decided to cancel the policy, she said Let’s Insure was relentless with the phone calls.
Senior Counsel Assisting Rowena Orr asked: “And in your statement you say that sometimes they called you day after day and sometimes once a week?”
“Well, they never left me alone,” Marika said.
She eventually ran into financial difficulty and sought the assistance of Legal Aid. She told them she could no longer afford the funeral insurance.
In a written response, Let’s Insure said it disputes the allegations it didn’t act properly and in accordance with the law when it sold the policy.
“However, as an act of goodwill, we will refund all premiums paid on the above policies, currently 40 totalling $1,890.34, subject to your client’s authorisation for us to cancel their policies,” Let’s Insure said.
Select AFSL managing director Russell Howden admitted that in hindsight “we pushed our agents” and this practice was “regrettable.”
Some staff members were incentivised with a Vespa scooter and a cruise – which he conceded drove the wrong behaviour.
“We have evolved our commission structure. It was designed to make agents productive but, at all times, the intended outcome was compliant sales,” he said.
A Roy Morgan survey released in January found the phone was the most popular means of purchasing life insurance policies.
The ABA Australia’s banks have today backed the Federal Government’s move to limit cash payments to $10,000 to tackle the ‘black economy’, however have highlighted the need for any reform to be implemented carefully.
This year’s budget included a new limit on cash payments to $10,000 to clamp down on the ‘black economy’, one of the recommendations of the black economy taskforce appointed by Minister O’Dwyer.
In its submission released today the banking industry outlines its broad support for the change, however have highlighted areas of concern.
Key points of interest to the banking industry are:
The need for a realistic implementation timeframe to help customers and businesses who are heavily reliant on cash payments so they can adapt to the changing environment
Ensuring the cash limit does not apply to transfers between financial institutions which are critical to ensuring cash is distributed quickly and easily throughout the economy
The change applies to payments only and not withdrawals of over $10,000
CEO of the Australian Banking Association Anna Bligh said that the industry was fully supportive of the Federal Government’s efforts to tackle the ‘black economy’.
“Limiting cash payments to $10,000 is an important change to make sure business and individuals pay their fair share of tax and operate within the law,” Ms Bligh said.
“Banks are on the ground regularly talking with local business, so they know the importance of getting this policy right.
“It’s important that local shop owners, manufacturers and others are given enough time to adapt to this policy which for many of them will be a big change to the way they do business.
“It’s also important that banks can continue to serve the economy by quickly distributing cash where needed therefore it’s important an exception is clearly made when it comes to this policy,” she said.
Digital Finance Analytics (DFA) has released the June 2018 mortgage stress and default analysis update.
The latest RBA data on household debt to income to March reached a new high of 190.1 [1] …
… so no surprise to see mortgage stress continuing to rise. Across Australia, more than 970,000 households are estimated to be now in mortgage stress (last month 966,000). This equates to 30.3% of owner occupied borrowing households. In addition, more than 22,000 of these are in severe stress. We estimate that more than 57,100 households risk 30-day default in the next 12 months. We expect bank portfolio losses to be around 2.8 basis points, though losses in WA are higher at 5.2 basis points. We continue to see the impact of flat wages growth, rising living costs and higher real mortgage rates.
The latest S&P Ratings data shows a rise in 90 day plus delinquencies in the SPIN series for April, from the major banks. So despite the fact it only covers MBS mortgages the trend is consistent with our stress analysis!
The inevitable result of too lose lending standards and easy loans is creating an intractable problem for many households given the continued low income growth, high cost environment. This also means risks to lenders continue to rise.
Our surveys show that more households are keeping their wallets firmly in their pockets as they try to manage ever tighter cash flows. This is an economically significant issue and will be a drag anchor on future growth. The RBA’s bet on sustained household consumption looks pretty crook. Even now, household debt continues to climb to new record levels, mortgage lending is still growing at an unsustainable two to three times income. Falling home prices just adds extra picante to the problem.
We continue to see households having to cope with rising living costs – notably child care, school fees and fuel – whilst real incomes continue to fall and underemployment remains high. Households have larger mortgages, thanks to the strong rise in home prices, especially in the main eastern state centres, and now prices are slipping. While mortgage interest rates remain quite low for owner occupied borrowers, those with interest only loans or investment loans have seen significant rises. Rate pressure will only increase as higher Bank Bill Swap Rates (BBSW) will force more lenders to lift their mortgage rates, as a number of smaller players already have done.
Our analysis uses the DFA core market model which combines information from our 52,000 household surveys, public data from the RBA, ABS and APRA; and private data from lenders and aggregators. The data is current to end June 2018. We analyse household cash flow based on real incomes, outgoings and mortgage repayments, rather than using an arbitrary 30% of income.
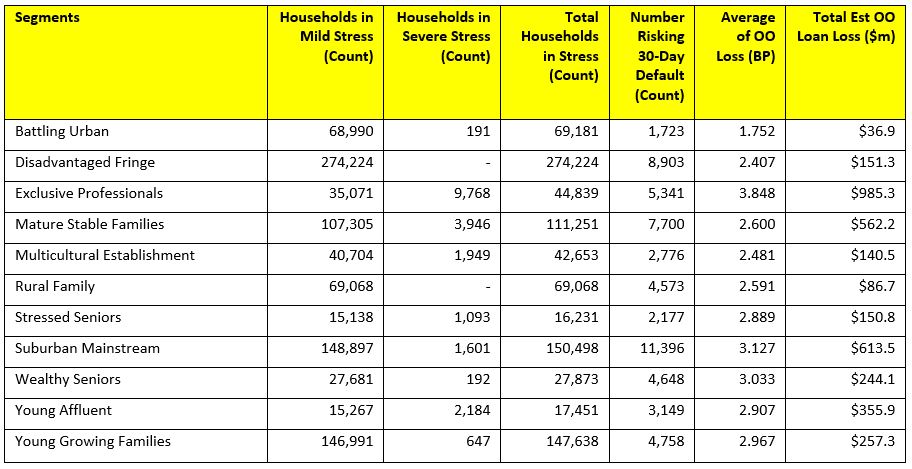
Households are defined as “stressed” when net income (or cash flow) does not cover ongoing costs. They may or may not have access to other available assets, and some have paid ahead, but households in mild stress have little leeway in their cash flows, whereas those in severe stress are unable to meet repayments from current income. In both cases, households manage this deficit by cutting back on spending, putting more on credit cards and seeking to refinance, restructure or sell their home. Those in severe stress are more likely to be seeking hardship assistance and are often forced to sell.
Probability of default extends our mortgage stress analysis by overlaying economic indicators such as employment, future wage growth and cpi changes. Our Core Market Model also examines the potential of portfolio risk of loss in basis point and value terms. Losses are likely to be higher among more affluent households, contrary to the popular belief that affluent households are well protected.
Stress by The Numbers.
Regional analysis shows that NSW has 264,737 households in stress (264,344 last month), VIC 266,958 (271,744 last month), QLD 172,088 (164,795 last month) and WA has 129,741. The probability of default over the next 12 months rose, with around 10,953 in WA, around 10,526 in QLD, 14,207 in VIC and 15,200 in NSW.
The largest financial losses relating to bank write-offs reside in NSW ($1.3 billion) from Owner Occupied borrowers) and VIC ($927 million) from Owner Occupied Borrowers, which equates to 2.10 and 2.76 basis points respectively. Losses are likely to be highest in WA at 5.2 basis points, which equates to $761 million from Owner Occupied borrowers.
A fuller regional breakdown is set out below.
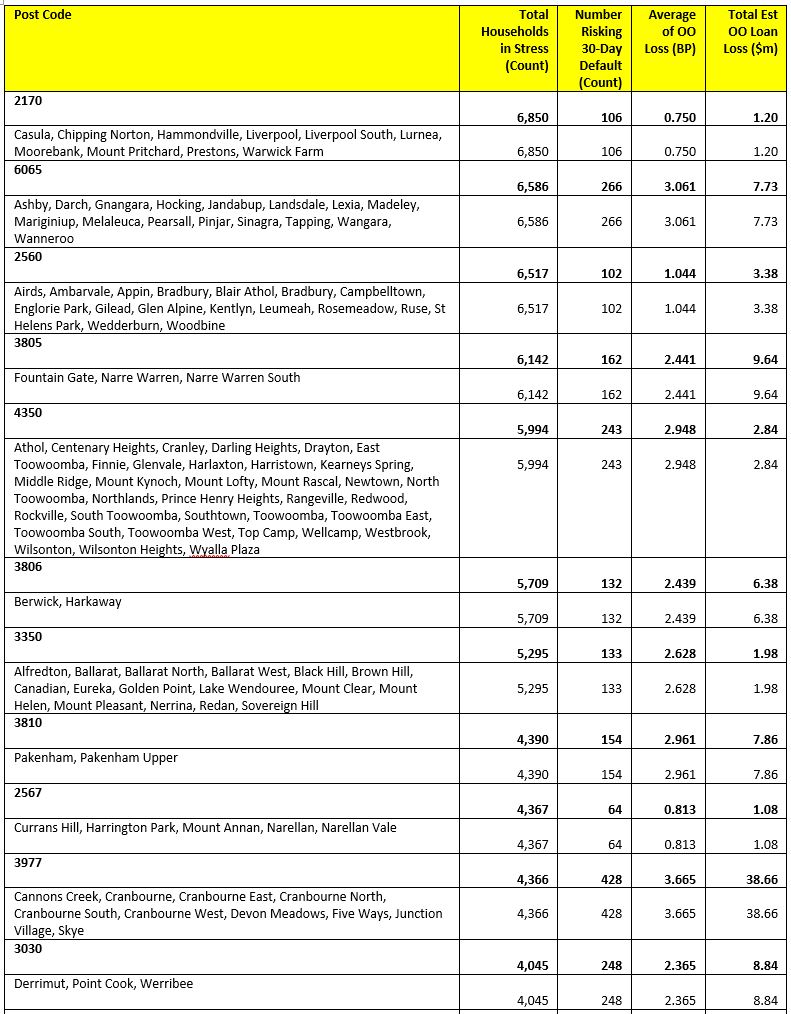
Here are the top 20 postcodes sorted by number of households in mortgage stress.
Some Important Context
The rise in mortgage stress does not occur in a vacuum. The revelations from the Royal Commission into Misconduct in the Banking, Superannuation and Financial Services Industry (the Commission) have highlighted deep issues in the regulatory environment that have contributed to the household debt “stress bomb”. The most significant area of law discussed by the Commission has been responsible lending. Yet most of the commentary on the regulatory framework has been superficial or poorly informed. For example, several commentators have strongly criticised the Australian Securities and Investments Commission (ASIC) for not doing enough but have failed to explain what ASIC has in fact done, and what it ought to have done. Gill North, Professor of law at Deakin and a Principal of DFA suggests that” APRA (and not ASIC) should be the primary focus of regulatory criticism. APRA has failed to adequately prepare Australia for future financial system instability and its prudential supervision of home lending standards and practices over the last 5 years has been woeful”.
North has published widely on responsible lending law, standards and practices over the last 3-4 years, and continues to do so. Her latest work (which is co-authored with Therese Wilson from Griffith University) outlines and critiques the responsible lending actions taken ASIC from the beginning of 2014 until the end of June 2017. This paper will be published by the Federal Law Review, a top ranked law journal later this month.
The responsible lending study by North and Wilson found that ASIC proactively engaged with lenders, encouraged tighter lending standards, and sought or imposed severe penalties for egregious conduct. Further, ASIC strategically targeted credit products commonly acknowledged as the riskiest or most material from a borrower’s perspective, such as small amount credit contracts (commonly referred to as payday loans), interest only home loans, and car loans. North suggests “ASIC deserves commendation for these efforts but could (and should) have done more given the very high levels of household debt. The area of lending of most concern, and that ASIC should have targeted more robustly and systematically, is home mortgages (including investment and owner occupier loans).”
Reported concerns regarding actions taken by the other major regulator of the finance sector, the Australian Prudential Regulation Authority (APRA), have been muted so far. However, an upcoming paper by North and Wilson suggests APRA (rather than ASIC) should be the primary focus of criticism. This paper concludes that “APRA failed to reasonably prevent or mitigate the accumulation of major systemic risks across the financial system and its regulatory approach was light touch at best.”
You can request our media release. Note this will NOT automatically send you our research updates, for that register here.
[contact-form to=’mnorth@digitalfinanceanalytics.com’ subject=’Request The June 2018 Stress Release’][contact-field label=’Name’ type=’name’ required=’1’/][contact-field label=’Email’ type=’email’ required=’1’/][contact-field label=’Email Me The June 2018 Media Release’ type=’radio’ required=’1′ options=’Yes Please’/][contact-field label=”Comment If You Like” type=”textarea”/][/contact-form]
Note that the detailed results from our surveys and analysis are made available to our paying clients.
[1] RBA E2 Household Finances – Selected Ratios March 2018
Kwok (A Co-Founder of Finty), David & Andrew Boyd.
Credit Card Compare does what it says on the tin, by providing a website for prospective credit card customers to select and compare the features and benefits of a wide range of Australian credit cards. In fact, the business, which started in a domestic setting a decade ago has thrived, and now has around 150,000 people seeking advice each month via the site.
When customers get a card approved from the bank, they receive a referral fee but do not handle the application or credit assessment processes, so Credit Card Compare is essentially a lead generating platform for lenders. The trick of course is to get current data passed back from the banks and David said that given the legacy systems in some organisations, this can be a challenge. They have some additional enhancements in the works, which we will see down the track. As yet they do not provide advice on which card is best, but simply make it possible for consumers to compare cards on a range of standard parameters and prioritise the features which they believe are most important.
The announcement of Credit Card Compare’s acquisition of Singapore based start-up, Finty.com highlights their desire to reach out and expand into selected Asian markets. Singapore has a unique credit card market, in that as well as card applicants being enticed with cash back, rewards and points, Finty enriches the rewards they receive, and as a result has a significant footprint in the market, despite relatively modest numbers of applications. In that market, customer rewards for taking a card are paid once approved, and most card holders possess a battery of separate cards for different purposes, for example, travel, expenses, and shopping. The average Singaporean would somewhere between six to eight cards, a much higher number than in Australia where most people only have one or two cards.
David sees significant growth potential across Asia, and also potentially some leverage from Finty.com back into the Australian business, seeing a win-win between the two businesses, with niche expertise from Singapore paired with executional capability in Australia.
Given the release of the ASIC report into Credit Cards, where they underscore the fact that many households have the wrong cards for their purchase and repayment behaviour, it seems to me that Credit Card Compare is well placed to bring greater sophistication into the local Australian market, whilst growing across the region. A nice trick to pull off if they can do it.
ASIC’s review into credit card lending in Australia has found that 18.5% of consumers are struggling with credit card debt. ASIC reviewed 21.4 million credit card accounts open between July 2012 and June 2017.
ASIC’s report (REP 580) finds that while credit cards offer flexibility, they can present a debt trap for more than one in six consumers. In June 2017 there were almost 550,000 people in arrears, an additional 930,000 with persistent debt and an additional 435,000 people repeatedly repaying small amounts.
‘Our findings confirm the risk that credit cards can cause financial difficulty for many Australian consumers’, ASIC Deputy Chair Peter Kell said.
Consumers are also being provided with credit cards that don’t meet their needs. For instance, many consumers carry balances over time on high interest rate products, when lower-rate products would save them money. ASIC estimates that these consumers could have saved approximately $621 million in interest in 2016–17 if they had carried their balance on a card with a lower interest rate.
Deputy Chair Kell said that ‘only a handful of credit providers take proactive steps to address persistent debt, low repayments or poorly suited products. There are a number of failures by lenders to act in the interests of consumers and we expect them to respond swiftly to our findings. We will be following up to ensure the problems we have identified are addressed, including public updates later this year’.
ASIC also looked at balance transfers and their effect on debt outcomes. The data shows that while many consumers reduce their credit card debt during the promotional period of transfer to a new card, a concerning number of consumers increase their debt: over 30% of consumers increase their debt by 10% or more after transferring a balance.
ASIC found that rules introduced in 2012 that require lenders to apply repayments against amounts accruing the highest interest first have helped reduce the interest charged on credit card debt. However, four lenders (Citi, Latitude, American Express and Macquarie) have retained old rules for grandfathered credit cards open before June 2012. ASIC estimates that almost 525,000 consumers have paid more interest as a result.
ASIC found that while these four credit providers are not breaking the law, they are charging their longstanding customers more interest than they should have been, and their conduct is out of step with the rest of the industry.
In anticipation of a new Banking Code of Practice, from 2019 Citi and Macquarie will no longer retain the older repayment allocation methodology for grandfathered credit cards. American Express has also indicated that it will make this change in 2019. Lattitude is considering its position.
Background
On 16 December 2015 the Senate Economics References Committee released its report relating to credit card interest rates, Interest rates and informed choice in the Australian credit card market (the Senate Inquiry). A primary concern of the Committee was that too many Australians are ‘revolving’ credit card debt for extended periods of time while paying high interest charges.
In March 2018, the Government implemented the first phase of reforms in response to the Senate Inquiry. These reforms will help prevent future consumers from experiencing problem credit card debt by:
ensuring that credit providers assess a consumer’s ability to repay a credit card limit over a period prescribed by ASIC
banning unsolicited credit limit increase invitations, and
making it easier for consumers to cancel credit cards.
ASIC has also today released a consultation paper about the credit assessments reform proposing that ASIC prescribe a period of three years. Once implemented this reform will strengthen responsible lending assessments for credit cards.
ASIC’s review
In 2017, ASIC began a review into credit card lending in Australia. As well as picking up on issues highlighted by previous regulatory reforms and the Senate Inquiry.
ASIC’s review of credit card lending focused on:
consumer outcomes – including whether there are people with debt that causes problems, such as missing payments or carrying lots of credit card debt over time
the effect of balance transfers on the amount of debt, and
the tailored rules that apply to credit cards.
Snapshot of the market
As of June 2017:
there were 14 million open credit card accounts, an increase of over 300,000 since 2012.
Outstanding balances totalled almost $45 billion.
Approximately $31.7 billion in balances on credit cards that were incurring interest charges.
Consumers were charged approximately $1.5 billion in fees in 2016-17, including annual fees, late payment fees and other amounts for credit card use.
Around 62% of consumers had only one credit card between 2012 and 2017.
Consumers with multiple cards generally had two cards.
Fewer than 5% of consumers had five or more credit cards between 2012 and 2017.

 This mirrors recent short term movements in the US.
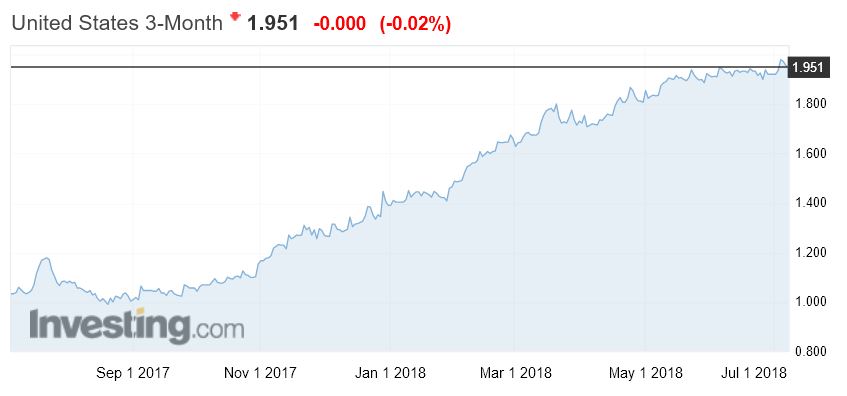 But as the Fed is likely to lift again, this slight relief may be just short term.