He outlines the results of recent bank stress testing, with a focus on the exposure to mortgage lending. Essentially, the tests indicate that whilst capital buffers appear to be adequate, the assumptions made by the banks, in terms of raising further capital, and other mitigating factors may well be too optimistic. “Banks may well survive the stress, but that is not to say the system could sail through it with ease”. The entire speech is worth reading, but I highlight some of his remarks.
Let me start by posing a question: are Australian banks adequately capitalised?
That’s a pretty important question, and one that the Financial System Inquiry is rightly focussed on. When compared against the Basel III capital requirements, they certainly seem to be. At end June 2014, the Common Equity Tier 1 ratio of the Australian banking system was 9.1 per cent, well above the APRA minimum requirement of 4.5 per cent currently in place, or 7.0 per cent when the capital conservation buffer comes into force in 2016. And in APRA’s view, after adjusting for differences in national application of the Basel standards, the largest Australian banks appear to be in the upper half of their global peers in terms of their capital strength. But the question remains: is that adequate?
There is no easy answer to that question. To answer it, you need to first answer another question: adequate for what?
Adequate to generate confidence is one simple answer. We require banks to have capital because they make their money by taking risks using other people’s money. That is not intended to sound improper; the financial intermediation provided by banks is critical to the efficient functioning of the economy. However, as very highly leveraged institutions at the centre of the financial system, investing in risky assets and offering depositors a capital guaranteed investment, we need confidence that banks can withstand periods of reasonable stress without jeopardising the interests of the broader community (except perhaps for their own shareholders). But what degree of confidence do we want?
Risk-based capital ratios are the traditional measure used to assess capital adequacy. Risk weights can be thought of as an indicator of likely loss on each asset on (and off) a bank’s balance sheet. So they tell us something about the maximum loss a bank can incur. But they don’t tell us anything about how likely, or under what scenario, those losses might eventuate.
Over the past decade, and particularly in the post-crisis period, regulators and banks have supplemented traditional measures of capital adequacy with stress testing. Stress testing helps provide a forward-looking view of resilience in a way in which static comparisons or benchmarks cannot. It provides an alternative lens through which the adequacy of capital can be assessed. In simple terms, it tries to answer the question: does a bank have enough capital to survive an adverse scenario – can we be confident it has strength in adversity?
Unsurprisingly, our stress test this year has targeted at risks in the housing market. The low risk nature of Australian housing portfolios has traditionally provided ballast for Australian banks – a steady income stream and low loss rates from housing loan books have helped keep the banks on a reasonably even keel, even when they are navigating otherwise stormy seas. But that does not mean that will always be the case. Leaving aside the current discussion of the state of the housing market, I want to highlight some key trends that demonstrate why housing risks and the capital strength of Australian banks are inextricably and increasingly intertwined.
Over the past ten years, the assets of Australian ADIs have grown from $1.5 trillion to $3.7 trillion. Over the same period, the paid-up capital and retained earnings have grown from $84 billion to $203 billion. Both have increased by almost identical amounts – close enough to 140 per cent each. This similarity in growth rates over the decade hides some divergent trends in individual years, but today the ratio of shareholders’ funds to the balance sheet assets of the Australian banking system – a simple measure of resilience – is virtually unchanged from a decade ago. Much of the recent build up in capital has simply reversed a decline in core equity in the pre-crisis period – as a result, on the whole we’re not that far from where we started from.
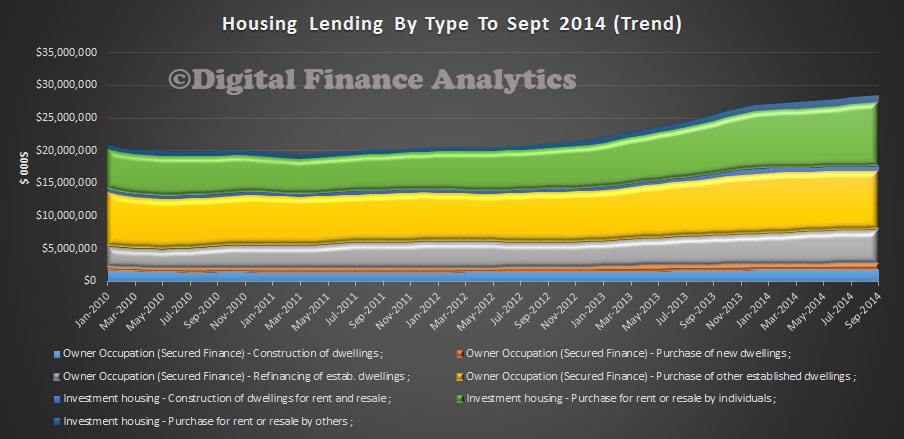
So how have regulatory capital ratios risen? Largely through changes in the composition of the asset side of the balance sheet. While the ratio of loans to assets has barely budged, the proportion of lending attributable to housing has increased from roughly 55 per cent to around 65 per cent today. Because housing loans are regarded as lower risk, the ratio of risk weighted assets to total (unweighted) assets has fallen quite noticeably – from 65 per cent to around 45 per cent. The impact of this trend is that, even though balance sheets have grown roughly in line with shareholders’ funds, risk-weighted assets have grown more slowly and regulatory capital ratios are correspondingly higher.
Results – Phase 1
In the first phase, banks projected a significant impact on profitability and marked declines in capital ratios in both scenarios, consistent with the deterioration in economic conditions. The stress impact on capital was driven by three principal forces: an increase in banks’ funding costs which reduced net interest income, growth in risk weighted assets as credit quality deteriorated, and of course, a substantial increase in credit losses as borrowers defaulted. In aggregate, the level of credit losses projected by banks was comparable with the early 1990s recession in Australia, but unlike that experience, there were material losses on residential mortgages. This reflects the housing market epicentre of the scenarios, and also the increasing concentration of bank loan books on that single asset class. In each scenario, losses on residential mortgages totalled around $45 billion over a 5 year period, and accounted for a little under one-third of total credit losses. By international standards, this would be broadly in line with the 3 per cent loss rate for mortgages experienced in the UK in the early 1990s, but lower than in Ireland (5 per cent) and the United States (7 per cent) in recent years. In other words, banks’ modelling predicts housing losses would certainly be material, but not of the scale seen overseas.
Stress testing on this core portfolio is an imprecise art, given the lack of domestic stress data to model losses on. Beneath the aggregate results, there was a wide range of loss estimates produced by banks’ internal models. This variation applies both to the projections for the number of loans that would default, and the losses that would emerge if they did. Our view was that there seemed to be a greater range than differences in underlying risk are likely to imply. Another key area where there were counter-intuitive results was from the modelling of the impact of higher interest rates on borrowers’ ability to meet mortgage repayments. Banks typically projected little differentiation in borrower default rates between the two scenarios, despite the very different paths of interest rates and implied borrowing costs. This raises the question whether banks could be underestimating the potential losses that could stem from sharply rising interest rates in the scenario. In the current low interest rate environment, this is a key area in which banks need to further develop their analytical capabilities.
Phase 2
The results in the second phase of the stress test, based on APRA estimates of stress loss, produced a similar message on overall capital loss – although the distribution across banks differed from Phase 1 as more consistent loss estimates were applied. Aggregate losses over the five years totalled around $170 billion under each scenario. Housing losses under Scenario A were $49 billion; they were $57 billion under Scenario B.
These aggregate losses produced a material decline in the capital ratio of the banking system. The key outcomes were:
- Starting the scenario at 8.9 per cent, the aggregate Common Equity Tier 1 (CET1) ratio of the participant banks fell under Scenario A to a trough of 5.8 per cent in the second year of the crisis (that is, there was a decline of 3.1 percentage points), before slowly recovering after the peak of the losses had passed.
- From the same starting point, under Scenario B the trough was 6.3 per cent, and experienced in the third year.
- The ratios for Tier 1 and Total Capital followed a similar pattern as CET1 under both scenarios.
- At an individual bank level there was a degree of variation in the peak-to trough fall in capital ratios, but importantly all remained above the minimum CET1 capital requirement of 4.5 per cent.
This broad set of results should not really be a surprise. It reflects the strengthening in capital ratios at an industry level over the past five years. But nor should it lead to complacency. Almost all banks projected that they would fall well into the capital conservation buffer range and would therefore be severely constrained on paying dividends and/or bonuses in both scenarios. For some banks, the conversion of Additional Tier 1 instruments would have been triggered as losses mounted. More generally, and even though CET1 requirements were not breached, it is unlikely that Australia would have the fully-functioning banking system it would like in such an environment. Banks with substantially reduced capital ratios would be severely constrained in their ability to raise funding (both in availability and pricing), and hence in their ability to advance credit. In short, we would have survived the stress, but the aftermath might not be entirely comfortable.
Recovery planning.
The aggregate results I have just referred to assume limited management action to avert or mitigate the worst aspects of the scenario. This is, of course, unrealistic: management would not just sit on their hands and watch the scenario unfold. As part of Phase 2, APRA also asked participating banks to provide results that included mitigating actions they envisaged taking in response to the stress. The scale of capital losses in the scenarios highlights the importance of these actions, to rebuild and maintain investor and depositor confidence if stressed conditions were to emerge.
This was an area of the stress test that was not completed, in our view, with entirely convincing answers. In many cases, there was clear evidence of optimism in banks’ estimates of the beneficial impact of some mitigating actions, including for example on cost-cutting or the implications of repricing loans. The feedback loops from these steps, such as a drop in income commensurate with a reduction in costs, or increase in bad debts as loans become more expensive for borrowers, were rarely appropriately considered.
Despite the commonality of actions assumed by banks, there was variation in the speed and level of capital rebuild targeted. Some banks projected quick and material rebuilds in their capital positions, after only a small “dip” into the capital conservation range. Other banks assumed that they would remain within the range for a long period of time. It is far from clear that a bank could reasonably operate in such an impaired state for such a length of time and still maintain market confidence.
Disappointingly, there was a only a very light linkage between the mitigating actions proposed by banks in the stress test and their recovery plans (or “living wills”), with loose references rather than comprehensive use. Recovery plans should have provided banks with ready-made responses with which to answer this aspect of the stress test. APRA will be engaging with banks following the stress test to review and improve this area of crisis preparedness.
Most importantly, the exercise also raised questions around the combined impact of banks’ responses. For example, proposed equity raisings, a cornerstone action in most plans, appeared reasonable in isolation – but may start to test the brink of market capacity when viewed in combination and context. The tightening of underwriting standards, another common feature, could have the potential to lead to a simultaneous contraction in lending and reduction in collateral values, complicating and delaying the economic recovery as we have seen in recent years in other jurisdictions. In other words, banks may well survive the stress, but that is not to say the system could sail through it with ease.
Concluding comments
To sum up, the Australian banking industry appears reasonably resilient to the immediate impacts of a severe downturn impacting the housing market. That is good news. But a note of caution is also needed – this comes with a potentially significant capital cost and with question marks over the ease of the recovery. The latter aspect is just as important as the former: if the system doesn’t have sufficient resilience to quickly bounce back from shocks, it risks compounding the shocks being experienced. Our conclusion is, therefore, that there is scope to further improve the resilience of the system.

 In original terms, the number of first home buyer commitments as a percentage of total owner occupied housing finance commitments rose to 12.0% in September 2014 from 11.8% in August 2014. Still near the lowest on record.
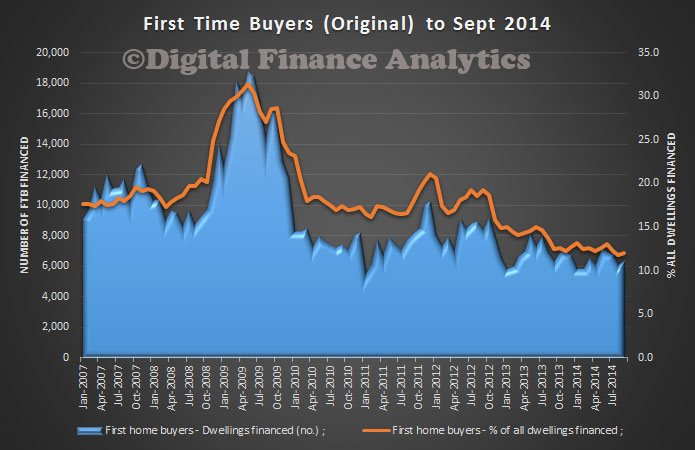 NSW first time buyers continues at the lowest levels, though with a slight uplift this month. WA data flatters the Australia-wide averages for first time buyer finance. It is not just a Sydney thing.
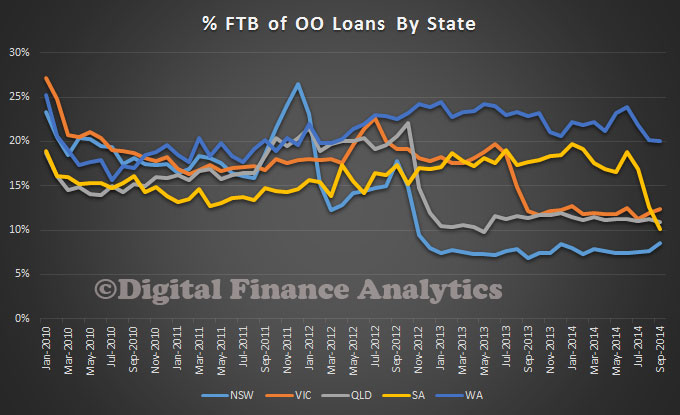 In trend terms, the number of commitments for owner occupied housing finance fell 0.2% in September 2014. In trend terms, the number of commitments for the purchase of established dwellings fell 0.3%, while the number of commitments for the purchase of new dwellings rose 1.2% and the number of commitments for the construction of dwellings rose 0.2%.