Investors are not being compensated for the risks they are taking in the current late-cycle global economy, warns Jamieson Coote Bonds via InvestorDaily.
Record levels of corporate and household debt, combined with the prospect of rising interest rates, are putting the Australian and world economies on a knife’s edge.
That’s the view of Jamieson Coote Bonds director of investment, research and strategy Paul Chin, who is also concerned about the prospect of ‘contagion’ from the collapse of the Turkish lira last week.
“Our concern with markets right now is that investors are not compensated well enough for the risks that they’re taking. That’s evident in so many different ways,” Mr Chin said.
While he is not predicting the current crisis in Turkey will create a broader financial crisis along the lines of the 1998 Asian meltdown, Mr Chin said it is a sign of the dangers of autocratic leadership.
Turkish president Recep Tayyip Erdogan, who effectively controls monetary policy in the country, refuses to raise interest rates because he believes doing so would lead to inflation (an opinion that is at odds with almost every economist in the world).
The consensus among economists is that Turkey needs to raise official interest rates by about 1,000 basis points (10 per cent) in order to arrest the decline of the lira, which fell 40 per cent against the US dollar last week following the imposition of US trade sanctions.
Mr Chin said he had similar concerns about the autocratic manner in which US president Donald Trump has ignited a trade war with China.
“It’s a major risk and it really does derail world growth. It could precipitate the next crisis inadvertently as well,” Mr Chin said.
Trade wars, by definition, can only be win/lose or lose/lose, he said. In the latter scenario, he said, “everyone goes protectionist and isolationist”.
“It’s just tinder dry in terms of how late cycle we are. We have high debt levels and one little thing can push everything over the edge,” he said.
Jamieson Coote Bonds (JCB) is a ‘pure-play’ defensive fixed income manager that invests in high-grade Australian bonds as well as the sovereign debt of G7 countries.
Mr Chin says many of the financial advisers he talks to are “pulling their hair out” looking for growth options in their portfolio.
But if JCB is right, they might be looking for the wrong thing at the wrong time.
“Advisers are thinking to themselves: ‘Things are pretty richly valued right now. I’m concerned about the trade war, I’ve read stuff about Turkey. I’d better start reading about defensives,’” Mr Chin said
Yesterday we ran a live discussion on our revised property and finance scenarios. For those who need to “answers” this is a brief overview. We explain more about our thoughts in the full show (below).
Scenarios are a way of exploring different futures, and to consider the consequences, not as a forecast, but to facilitate understanding and debate.
None of these scenarios may turn out to be right…. Things change.
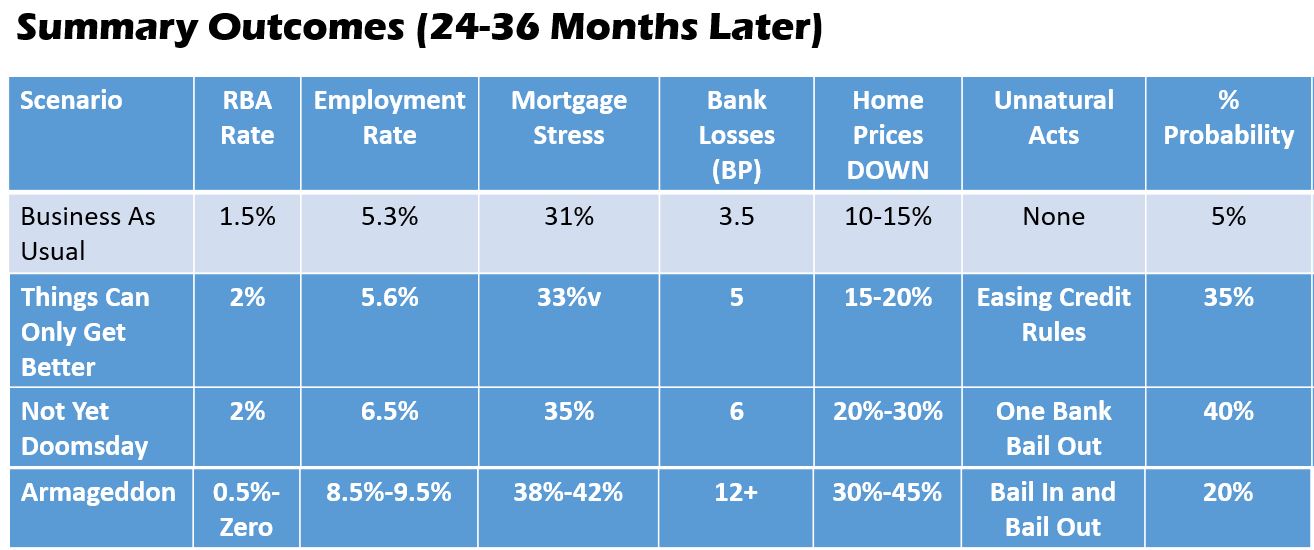
We use a framework driven from our core market model and we are going to look at the four potential outcomes, updated with the latest data and outcomes.
Business As Usual
Credit growth eases
Fall in prices continues, employment around current level
RBA still banking on household consumption to support growth.
Things Can Only Get Better
International rates rise out of cycle
Exchange rate down
RBA lifts rates – pressure on rates 50 basis points.
Credit growth slides.
Loss rates rise.
Home prices slide further.
Not Yet Doomsday
US rate rises trigger pressure in the USA
Flight to quality, to US$ or gold.
Capital exits Australia, need rates higher to retain investment, yet needs to cut to help the economy.
One bank in Australia would have issues, due to investor loans.
Armageddon
International crisis, pressure on economies.
Caught in the tide.
Unemployment lifts
Defaults rise.
Unusual measures.
Australia parallels Ireland (or worst)
For each scenario we look at a range of outcomes, and also apply a probability rating. The results are shown here:
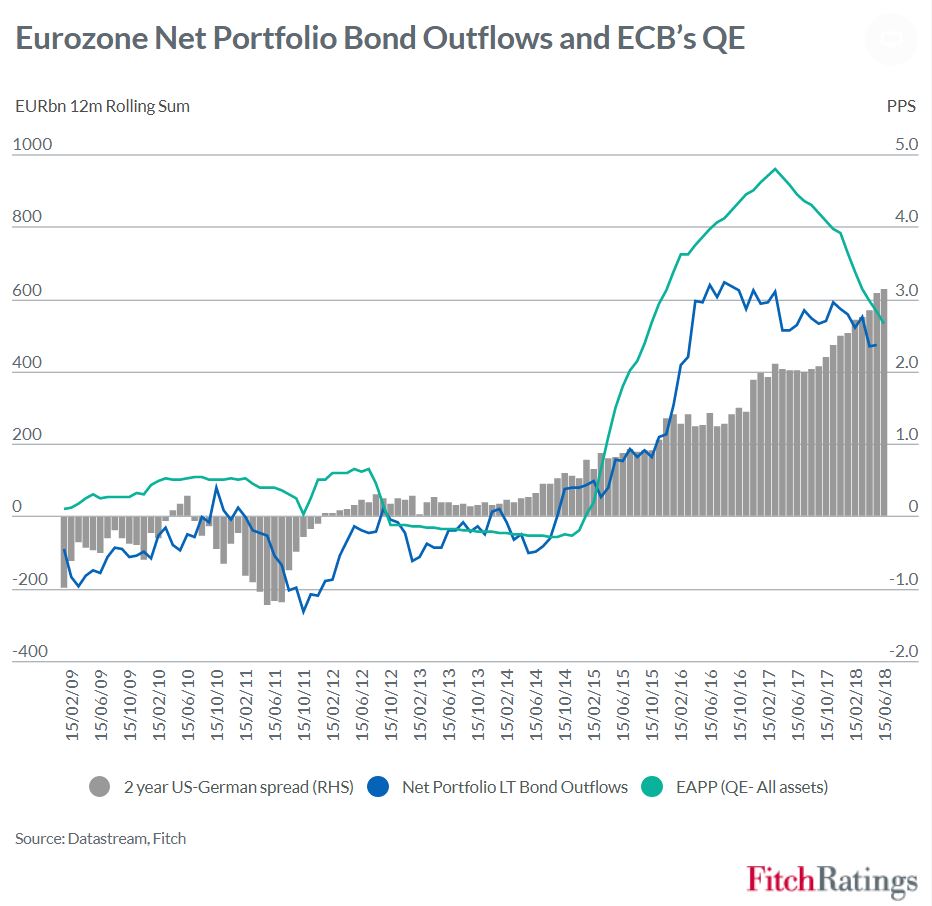
Global bond yields could see upward pressure if net capital outflows from the eurozone start to subside when the ECB ends its quantitative easing (QE) in December 2018, according to Fitch Ratings.
The latest chart of the month from Fitch’s economics team shows net outflows of capital from the eurozone in the form of long-term portfolio debt instruments. This is calculated as purchases of foreign bonds by eurozone residents minus foreigners’ purchases of eurozone bonds. Net portfolio debt outflows rose sharply after the ECB commenced government bond purchases in early 2015. ECB purchases were substantially greater than the net issuance of new debt to fund eurozone government deficits, implying reduced exposures by existing holders of eurozone government debt. In an environment of increasing scarcity, existing bondholders moved capital to other geographies.
This large net capital outflow has likely helped cap benchmark long-term bond yields in the US (and elsewhere) and a reversal of these flows could drive yields upwards. Since the start of the ECB’s sovereign QE programme, it has bought over EUR2 trillion of bonds while net bond outflows from the eurozone have amounted to EUR1.5 trillion. Eurozone investors now own as many US bonds as Japan and China combined. However, with net QE purchases set to end this year net outflows have already recently started to lose some momentum with foreign selling of eurozone bonds moderating since the start of this year. The risk is that eurozone net bond outflows could drop away sharply when the ECB QE ends in December 2018, reducing demand for US Treasuries and pushing up US (and global) yields.
One factor that could temper such a shock is the ongoing yield advantage of owning US bonds. This is likely to remain a strong pull factor for eurozone investors, as the chart shows. The spread between two-year US Treasuries and German Bunds is at the widest in three decades. The large stock of ECB QE holdings is expected to continue to contain Bund yields, which will remain further anchored by ECB’s negative deposit rate. We believe the ECB deposit rate will be on hold until late next year while the central bank awaits confirmation of firmer underlying inflation trends. Meanwhile the Fed will continue to raise rates.
While the ECB’s dampening influence on global bond yields is likely to weaken significantly from next year, it is unlikely to go away completely.
More evidence of the global fragility of the financial markets on Friday.
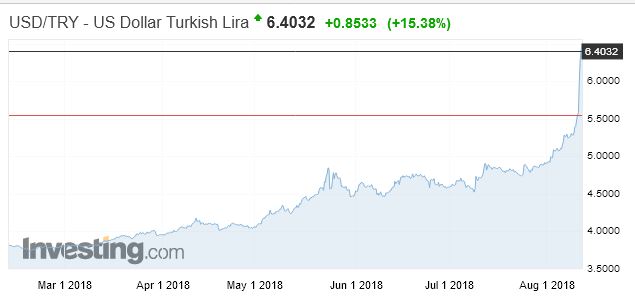
Turkey’s finance minister, Berat Albayrak, unveiled a new plan for their economy on August 10th.
The new economic stance will be one with “determination” — that’s a key part of it, Albayrak says. It will “transform” Turkey’s economy. It will also have a “strategic” and “powerful infrastructure.”
But Donald Trump, tweeted that he would double tariffs on Turkish steel and aluminium products.
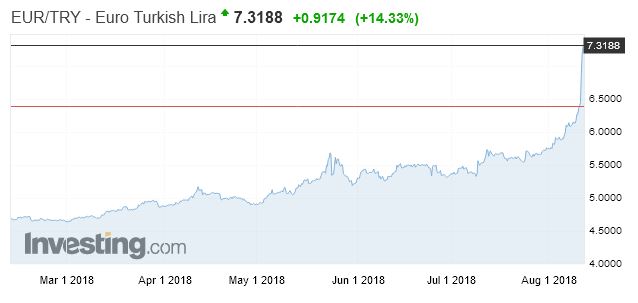
As a result, the lira plummeted further. In the course of an hour, it reached a new low of 6.80 to the dollar, marking its worst daily performance in over a decade. It recovered a little afterwards, but has lost about 40% of its value against the dollar since the start of the year.
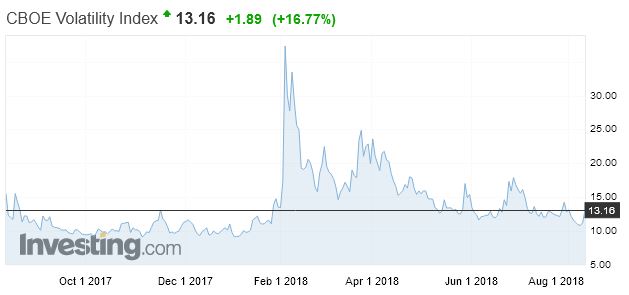
Many fear the fallout could spread beyond Turkey’s border, prompting traders to abandon riskier assets like stocks in search of safe-havens like gold, yen and Treasuries.
Volatility, as measured by the “fear index”, rose nearly 17%, underlying investor concerns about the broader impact of a possible crash in Turkey’s economy.
The exposure to a slump in Turkey’s economy is “pretty international,” though limited to the banking sector, said Tim Ash, a senior EM strategist at Bluebay Asset Management.
Data from the Bank for International Settlements showed that Japanese banks are owed $14 billion, U.K. lenders $19.2 billion and the United States about $18 billion.
The Turkish Lira also moved the same way against the Euro.
“We’re not going to lose the economic warfare” being waged against Turkey said President Recep Tayyip Erdogan.
Erdogan is boasting of Turkey’s 7.4 percent growth rate in the first quarter. Forget about the exchange rate, he says. “It’s going to be better.”
Responsible investment in Australia has hit a major milestone, with a new report finding over half of all professionally managed investments in Australia are now invested as responsible investments. Environmental, social, corporate governance and ethics considerations now sit alongside financial as critical components informing the investment decisions of the majority of Australia’s professional investors.
The 17th annual Australian Responsible Investment Benchmark Report 2018 (KPMG), the most comprehensive review of the responsible investment sector in Australia, reveals the industry hitting new heights with $866 billion now managed as responsible investments, representing 55 per cent of all professionally managed assets in Australia, up from $622 billion in 2016 (growth of 39% year on year).
“This is a major milestone to reach with a majority of funds invested in Australia now being invested under commitments to responsible investment,” said Simon O’Connor, CEO of RIAA. “We are now at a stage whereby issues such as climate change, human rights, corporate culture, diversity and a whole range of other important sustainability issues are right at the forefront of consideration by Australia’s finance community.”
O’Connor explained the uplift in assets was largely due to mainstream investment funds making a switch to incorporate responsible investment, such as incorporating negative screening, systematically assessing environmental, social and governance (ESG) factors as well as engaging directly on these issues to influence corporate Australia.
“Nearly two decades of progress in responsible investment has this year reached an important tipping point, which we believe will only gain further momentum in light of growing calls for transparency and accountability across finance along with a growing consumer demand for investments that align with their values,” said O’Connor.
Broad Responsible Investment
RIAA and KPMG research reviewed Broad Responsible Investment strategies of 112 asset managers in Australia, finding 24 managers could demonstrate a leading approach to ESG integration, constituting $679.3 billion AUM, up by 22% year on year
Asset managers cited ESG factors positively impacting portfolio performance as now the greatest driver of growth in responsible investment (up by 20 per cent year on year)
Core Responsible Investment
Core Responsible Investments using negative or positive screening, sustainability themed investments, impact investing and community finance have also reached a record level of $186.7 billion representing 12% of all professionally managed assets, more than tripling between 2015 and 2017.
This growth in absolute and relative terms reflects both a surging demand for ethical, sustainable and impact investments as well as a further embedding of negative screens across mainstream financial products and mandates – particularly across tobacco and controversial weapons
Core responsible investment Australian share funds outperformed their benchmark over three, five and ten years
Responsibly invested international share funds outperformed the benchmark in the one and three-year time horizons, with comparable performance over ten years; and responsibly invested balanced portfolios outperformed their benchmark over the three, five and ten year periods
“Our research continues to show us Australians don’t want to build their retirement savings and other investments off the back of harmful activities without compromise to financial performance. The investment industry is responding, by providing more investment opportunities that align with these values, but also building these considerations into the bulk of the market.
“While it’s hugely positive to see responsible investment now with the lion’s share, our aspiration is to see this number grow as the understanding of ESG factors on positive portfolio performance increases,” said O’Connor.
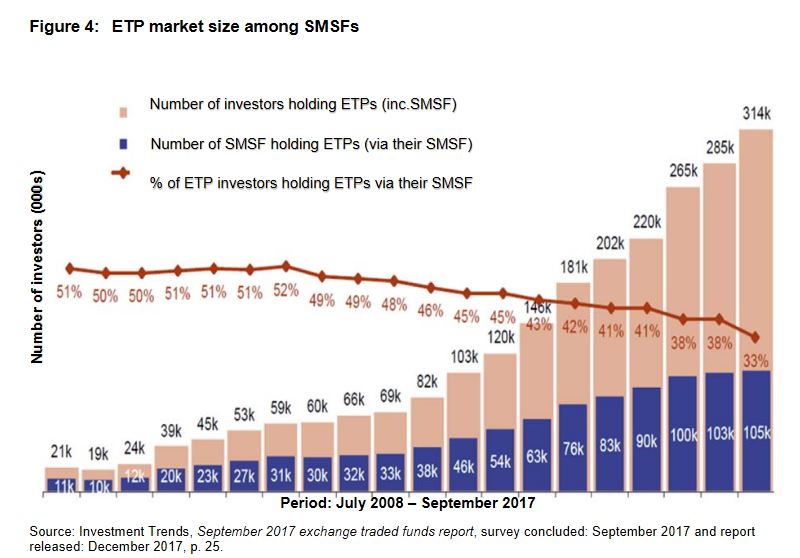
Exchange traded products (ETPs) are open-ended investment products that are traded on a securities exchange market. ETPs trade and settle like shares and give investors exposure to underlying assets without owning those assets directly.
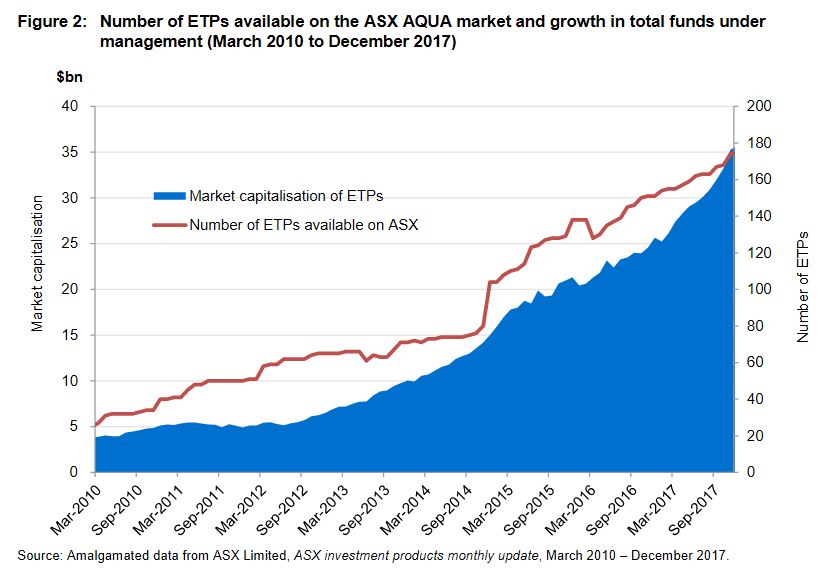
ETPs differ from listed funds because they are open-ended. Tthis means that the number of units on issue may increase or decrease daily depending on investor demand. ETPs, especially exchange traded funds (ETFs), are increasingly popular with retail investors and self-managed superannuation funds (SMSFs).This is because of their accessibility, perceived low cost, transparency, intraday liquidity, diversification benefits and ability to provide exposure to new asset classes. There has been steady growth in both funds under management and the number of ETP products available on the market in Australia
ACIS’s review focused on two types of ETPs: a) passively managed ETFs with an investment objective to track an index or benchmark; and b) funds that are actively managed to outperform a benchmark or to achieve an absolute return objective (referred to as ‘active ETFs’ and ‘managed funds’).
The review found that the market is generally performing well, and ETPs are meeting the relatively low cost and liquidity expectations of investors. However, the review identified a range of risks that require monitoring by issuers and oversight by market operators.
The large and growing investment in ETPs in Australia by retail and SMSF investors prompted ASIC to look at a number of the key premises and functions of the ETP market. The key concern identified was the potential for the bid/offer spread to temporarily widen, leading to investors paying a spread that would be considered too high, and undermining the relatively low cost proposition of some ETPs.
Further, ASIC considers that market operators and issuers should play a more proactive role in monitoring the performance of ETPs, including liquidity in the market, and where they observe spreads widening unreasonably, they should take appropriate action.
ASIC is also recommending that ETP issuers publish the indicative net asset value (iNAV) with a frequency that enables investors and financial advisers to make more informed decisions.
ASIC Commissioner John Price said, ‘We encourage issuers to continue to educate investors and their advisers about how the ETP market operates and to provide them the tools, like an iNAV, to help them make informed investment decisions’.
Another area of concern identified in the report was market maker concentration, as although there are an increasing number of new entrants in Australia that serve a growing market, most liquidity is still provided by only two entities. ASIC expects issuers and market operators to be aware of this risk and incorporate a means of managing it into their risk management framework.
While not many ETPs have closed in Australia to date, ASIC encourages issuers and market operators to develop policies for reviewing, and where necessary remove from quotation with an orderly wind down, ETPs that may not meet ongoing suitability for quotation, such as very small ETPs that may be uneconomical to operate.
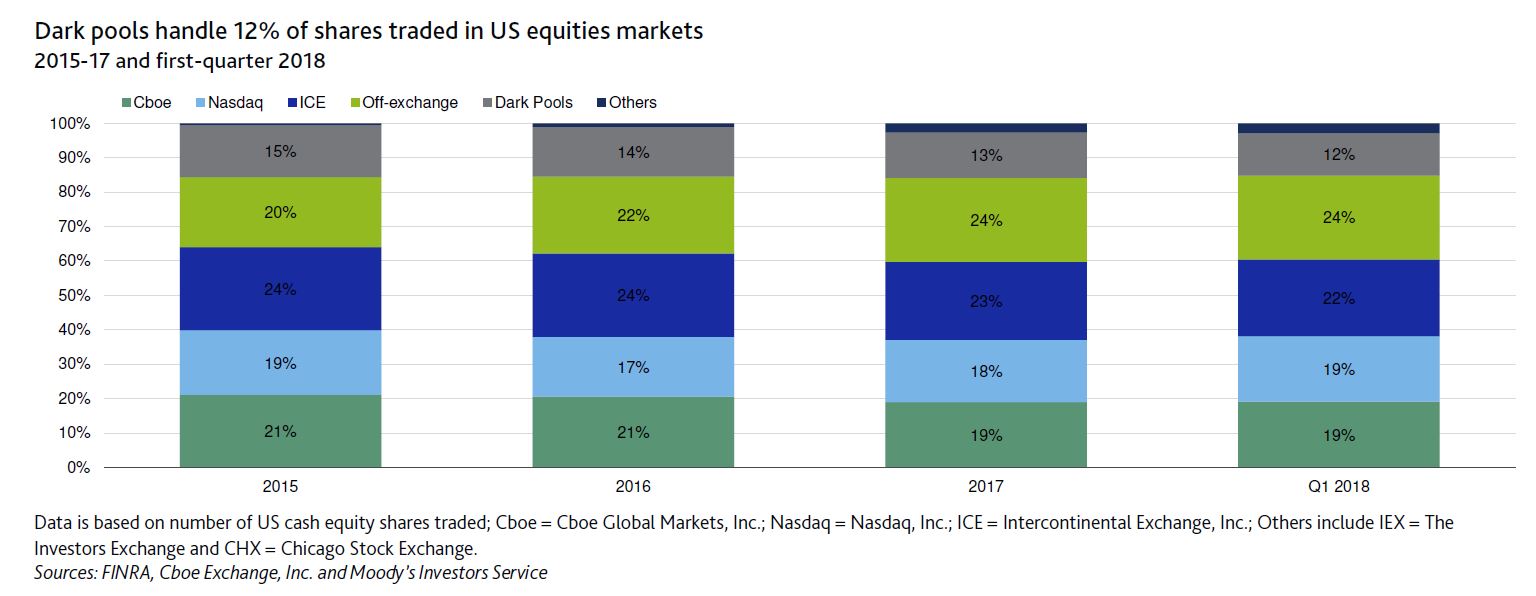
Moody’s says that last Wednesday, the US Securities and Exchange Commission adopted amendments to the rules governing alternative trading systems (dark pools) that will increase transparency around trading data and execution.
The new rule is credit positive because it will require dark pools to provide standardized and detailed public disclosures, enhancing their oversight. The new disclosures take effect January 2019.
The increased disclosure requirements will improve reporting and oversight by dark-pool operators, which are typically large banks and independent and specialized trading firms such as Liquidnet Holdings, Inc. We expect these improvements to increase customer confidence in dark-trading venues, allowing customers to assess potential conflicts of interest or the potential for leakage of subscriber information from the dark pools to its broker-dealer operator or affiliates. The tougher reporting requirement standards will also strengthen dark pools’ internal oversight and compliance framework, which should limit future regulatory penalties, a credit positive.
Dark pools are a type of off-exchange trading venue that institutional investors actively use because they provide anonymous execution and minimize market effects. Dark-pool trades remain subject to national market system regulatory requirements, chief among them that trades must be executed at or better than the national best bid-offer price – the price that corresponds to the most competitive, publicly visible resting order on so-called bright venues such as exchanges. As of first quarter 2018, dark pools processed around 12% of all US equity trading volume
In recent years, the SEC and the New York Attorney General have scrutinized dark pools. Securities regulators investigated whether banks misled institutional investors participating in their dark pool trading venues and favored high frequency traders. A number of dark-pool operators agreed to settle charges relating to disclosure failures or other securities law violations. Most prominently in 2016, subsidiaries of Barclays Bank PLC (A2/A2 stable, baa31) and Credit Suisse AG (A1/A1 stable, baa2) agreed to settle separate cases. Barclays paid $70 million and Credit Suisse paid $84.3 million to resolve claims that their dark pools failed to continuously monitor the trading venues against predatory trading, to treat subscriber information confidentially and other disclosure shortfalls.
The new reporting requirements include the disclosure of information regarding ownership of a dark pool and its broker-dealer and arrangement between the dark pool and affiliate broker-dealers. A dark pool will also be required to disclose the type of subscribers it caters to, order types, fees and other operational information.
Welcome to the Property Imperative weekly to 21th July 2018, our digest of the latest finance and property news with a distinctively Australian flavour.
By the way if you value the content we produce please do consider joining our Patreon programme, where you can support our ability to continue to make great content. Here is the link.
Watch the video, listen to the podcast, or read the transcript.
It’s important to look past the headlines and examine the data, because we need to see the truth beneath.
Let’s start with the housing market this week. Auction clearance rates and volumes continue to fall and Sydney recorded the lowest clearance rate the city has seen since December 2012. CoreLogic says that last week saw 1,178 homes taken to auction across the capital cities, returning a clearance rate of 52.0 per cent. Compare this with 52.6 per cent across 1,411 auctions last week and 69.4 per cent on 1,627 homes this time last year.
Melbourne’s final clearance rate came in at 56.2 per cent across 559 auctions last week, similar to the previous week when 631 auctions were held and a clearance rate of 56.1 per cent was recorded. This time last year auction volumes were higher across the city with 756 homes going under the hammer returning a clearance rate of 74.9 per cent.
Sydney’s final clearance rate dropped to 46.9 per cent last week across 408 auctions, the lowest clearance rate the city has seen since December 2012. In comparison, 552 auctions were held across Sydney over the previous week returning a clearance rate of 50.1 per cent while this time last year, 609 homes went under the hammer, returning a clearance rate of 69.2 per cent.
Across the smaller auction markets, clearance rates improved everywhere except Brisbane. In terms of volumes, Adelaide was the only city to see an increase with an additional 8 homes taken to auction over the week. Of the non-capital city markets, the Hunter region recorded a 70.6 per cent final auction clearance rate across 17 results, followed closely by Geelong where 70.4 per cent of the 27 auction results were successful.
CoreLogic says auction activity is expected to remain relatively subdued this week with 1,155 homes scheduled for auction across the combined capital cities, similar to last week. And they also reported that home prices slid further across all the centres other than Brisbane, down another 0.11% in the past week. So absolutely no indication of any improvement. Today I had the chance to visit five auctions in our area, none sold, and no-one serious made any bids at three of the events.
But this should come as no surprise, as credit is still less available than a few months ago. Indeed, around forty percent of households seeking to refinance their mortgages have been knocked back compared with just 5% a year ago. We discussed these findings as part our analysis of Household Financial Confidence, which overall was lower again – see our post “Household Financial Confidence On The Blink Again” . The June 2018 edition of the index, which draws information from our rolling household surveys, registered just 89.7, well below the 100 neutral setting and down from 90.2 last month. Debt remains a major issue, with mortgages being the front line. Households remain highly leveraged. Some households with lower Loan to Value ratios have been able to switch to other, cheaper loans. We also continue to see many households adding to their overall debt via credit cards, or other loans. The new positive credit environment which commenced 1 July 2018 will change the game ahead and credit may become harder to source for some. On the other hand, households continue to dip into their savings to maintain lifestyle and budgets. Significantly more than one third of households with an owner occupied mortgage had savings LESS than the equivalent of one month’s mortgage repayment. The other two thirds had significantly larger resources which would insulate them in a down turn, at least for a time.
CoreLogic has looked at the changes in property values by area from their peaks, with Perth showing a 28% fall alongside Darwin, Brisbane down 12.5%, Adelaide down 7.4%, Canberra down 6.8%, Sydney down 5.3% and Melbourne down 0.9%. And over the past decade, house values fell on average 27% across Mackay, in Queensland, and more than 34% across the WA outback. These are big falls, and puts the movements in Sydney and Melbourne into perspective – or perhaps provides a better view of where we are headed.
S&P Global Ratings did a job on the banks this week, saying they recently negatively revised their view of the Australian banking sector’s industry risk. Developments over the past two years in the Australian banking sector, including information coming out of hearings at the ongoing Royal Commission, highlight some weaknesses in the effectiveness of regulation in the banking sector, and the conduct, governance, and risk appetite shown by Australian banks. This is a big deal, as we discussed in our post “And Now For The Bad News, At Least For The Banks”.
In addition, The latest S&P Ratings SPIN index to May 2018, based on their portfolio of mortgage backed securities showed a further move up in defaults compared with last month, from 1.36% to 1.38%. There were rises in New South Wales of 0.02%, Queensland of 0.04% and Northern Territory up 0.52%. Significantly, the larger hikes were seen in the major bank portfolios, with the prime spin rising from 1.36% last month to 1.38% in May. There was a rise in 61-90 day past due loans, from 0.22% last time to 0.25%. While these moves are small, arrears are now as high as they were back in 2011, and interest rates are much lower today, so this highlights the risks in the system. This does not appear to be a seasonal issue either; it is more structural.
In addition, personal insolvencies were higher again, according to the Australian Financial Security Authority who released their statistics for 2017–18 and the June quarter 2018. The data reveals a sharp rise in total personal insolvencies to the highest level since the Global Financial Crisis a decade ago, with record high insolvencies reached in WA and NT, and debt agreements also hitting an all-time high. The pressure on households continues to bite.
Even the RBA minutes, out this week discussed the problem. And the latest SQM Research data on rentals also showed that Sydney vacancy rates are the highest in 13 years, at 2.8%, potentially putting more pressure on property investors in city.
We also ran some alternative mortgage scenarios this week, showing that even if incomes started to move up, to nearer 3% that’s 1% higher than now, the number of households struggling with their finances would remain well above the long term trends. We remain, as a nation, highly exposed to debt, especially if interest rates rise. You can watch our video on this analysis “Alternative Mortgage Stress Scenarios”.
Even CBA’s Gareth Aird, their Senior Economist, in a fairly bullish piece, admitted that for many households, the number one headwind that they face with respect to consumption is debt repayment. Australia has one of the most indebted household sectors globally. Debt to income ratios have risen from around 148% in mid-2012 to a record high of 190% in Q 2018. This measure includes all households regardless of whether they actually have a mortgage. For households that have a mortgage, that figure is significantly higher. It has increased steadily as interest rates have come down despite lower rates making it easier to repay debt. Basically growth in the net flow of credit (i.e. new credit less repayments) has been higher than growth in income. He says a high debt burden relative to income acts as a constraint on future household consumption growth. It means that interest payments as a share of income are higher than otherwise. And of course the principal must be paid too. This leaves households with less income that can be spent on goods and services. And it means that households have a much greater sensitivity to interest rate changes. From a demographic perspective, it is younger households feeling the debt burden most acutely. There are also about $120bn of interest only loans in aggregate that are scheduled to roll over to principle and interest (P&I) loans annually over the next three years. Borrowers shifting to P&I loans will face higher monthly loan repayments. Could not have put it better myself.
The plight of households in the current environment even reached New York in an excellent piece in the New Your Times. “Australian Housing Costs Rival New York’s, but Boom May Be Ending“. I was quoted extensively: “We are on the edge of a precipice,” said Martin North, principal analyst for Digital Finance Analytics, an independent research and advisory firm. “All of the forces that have driven the home sector and the debt sector higher in the last 20 years are all coming to a critical inflection point.” “Almost everywhere you look, you can see icebergs,” Mr. North said. Signs of stress are showing. Mr. North, the analyst from Digital Financial Analytics, estimates that of 3.5 million mortgages where the owner lives in the home, almost a third of the households have incomes close to or less than their expenditures. He predicts that at least 50,000 homeowners may default in the next 12 months.
If you want to get deep and dirty into our analysis, and the potential consequences for Australian Households, and mitigation strategies, then you might want to watch the recording of our Live Stream from last Tuesday. It’s just over the hour in length, and we have some excellent interactions in the chat room. In fact there are two versions available, the live edition, including real-time chat, and the odd technical glitch (helps to turn the sound on), or the slightly shorter version, at higher quality and tidied up, but without the chat. You can choose. We plan more live events down the track. The links are below.
The apparent bright spot this week was the latest employment data which was above market expectations. The number of people employed rose 50,900 from May to June in seasonally adjusted terms, which was well ahead of forecasts of around 16,500. And that wasn’t just a lot of new part-time jobs. Full-time employment rose by 41,200. On a year-on-year basis that represents an increase in employment of 2.8%. But even then, the number of people unemployed fell from 715,200 in May to 714,100 in June. This is explained by the participation rate – the proportion of people participating or trying to participate in the paid labour market. The participation rate rose from 65.5% in May to 65.7% in June, leaving the unemployment rate unchanged at 5.4%. The Australian labour force participation rate is actually pretty high. A useful comparison is the United States – probably the world’s most robust labour market – where the current rate is 62.9%. The key point is that if more people are going to come into the labour market when it looks better – as they have been consistently – then a continued reduction in the unemployment rate is going to require creating a whole lot more jobs. And in any case the basis for counting employed people is suspect. We discussed this in our post “And Now for The Good News”. Little sign of wages growth at the moment.
The local stock markets had a pretty good week, again, with the ASX All Ords up 0.35% on Friday to 6,377. The S&P ASX 100 was up 0.38% to 5,168, encouraged by the employment data, and the economic news from China. Westpac, the largest investment mortgage lender was up 0.67% to 29.90, but well below its 12 month highs, and CBA rose 0.68% to 75.90, but again well below prices from a year ago. The overhang from the Royal Commission, tighter funding, and higher risks explain why they are priced down.
Looking across to the US markets, the earnings season was in full flight for the week and the majority hit or beat Wall Street expectations. The Down Jones Industrial was down 0.3% to 25,058 on Friday and the S&P 500 fell a little to 2,801. The Volatility Index, the VIX was also a little lower, but remains above its level last year. The financial sector continued to perform well. Morgan Stanley led the broker-dealer reports and Goldman Sachs also topped estimates, although concerns about its succession plan hit the stock later in the day. But even so, these stocks are off their 12 month highs, and Macquarie Bank, in comparison, has been performing more strongly in our local market up 0.84% on Friday to 125.40.
On the tech-heavy NASDAQ, which fell just a little on Friday, down 0.07% to 7,820, it was a tale of two techs as a momentum stock fell short of what investors wanted and an old stalwart came through. Netflix tumbled at the start of the week after the company missed expectations on new subscribers, a key metric for the streaming company. Netflix added 5.14 million subscribers in the latest quarter, shy of analysts’ expectations for more than 6.2 million. But after the bell on Thursday, Microsoft reported second-quarter earnings that beat consensus thanks to cloud services revenue.
The prospect for the path of U.S. interest rates took an interesting turn at the end of the week. At first things seemed to jibe with market expectations that the Federal Reserve will raise rates once and possibly twice before the year is out. At his Humphey-Hawkins testimony before the Senate Banking Committee and the House Financial Services Committee, Federal Reserve Chairman Jerome Powell reiterated the central bank should gradually increase interest rates.
But President Donald Trump shook some of the market’s confidence, saying on Thursday he’s “not thrilled” about the Fed hiking rates and going into more specifics on Twitter on Friday.
The tweets had little overall impact on the market forecasts for upcoming rate hikes. But they did take the legs from the dollar on Friday. The U.S. Treasury Department has long had a policy of simply stating that a strong dollar is in America’s best interest.
The yield curve continues to converge across the long and short term, and this has often been seen as an early warning of trouble ahead. This from Bloomberg.
The 30-year bond is sitting at 3.03% and the 3 Month at 1.98%. The 3 Month LIBOR rates remained above 2.3% and the 10 year benchmark is at 2.9%, just a little off its highs, and this also reflected in a lower BBSW rate in Australia, suggesting a small fall in margin pressure for the banks locally compared with a few weeks ago.
Trade-war concerns took a back seat through most of the week, but were revived on Friday and could weigh more heavily next week, despite another full earnings calendar. President Trump said in an interview on CNBC that he is ready to impose tariffs on $500 billion worth of Chinese goods to the U.S. if China does not back down on its trade policies. “I’m not doing this for politics, I’m doing this to do the right thing for our country” he said on CNBC’s “Squawk Box.” “We have been ripped off by China for a long time.”
In fact, Moody’s highlighted that already the trade-wars is hitting base metal prices, yet is hardly mentioned. Since worries surrounding a trade war came to the fore, the base metals price index has sunk by 13.0%. The copper futures are well down from their highs a couple of months back, as is steel. This could crimp Australian GDP in the months ahead. And both Gold and Silver were weaker, suggesting that at the moment “risk” investors are preferring the US Dollar.
It’s also worth noting the Chinese Yuan slide against the US dollar and the Australian Dollar and some are suggesting that this is a sign of the Chinese Government answering the Trade wars by taking their currency lower (so reducing the cost of their goods in the local economies). The Aussie Dollar continues to drift lower against the US Dollar, and we expect this to continue, indeed one economist suggested it could end up around 60c in the months ahead.
Crude oil prices posted a second-straight weekly decline and may continue to weigh on energy stocks, as they have of late. On the New York Mercantile Exchange crude futures for September delivery rose $1.30 to settle at $70.46 a barrel Friday. Investors continue to weigh up the prospect of a global shortage in supplies, despite Saudi Arabia’s pledge to hold off flooding the market with more output. That said, crude oil prices were supported on Friday by the plunge in the dollar following Trump’s remark about the greenback and other currencies.
Bitcoin lifted a little, and continues in a less volatile mode, though well below earlier highs.
Finally, for today, another lens on the debt bomb, as featured in my recent discussions with Economist John Adams, including those on the debt bomb itself, the international debt bubble and more recently the meaning of money. We have more planned, so watch out for those, and there is also dedicated web page on the DFA blog. Again the link is below.
The McKinsey Global Institute says that since the GFCs, many large corporations around the world have shifted toward bond financing as commercial bank lending has been subdued. Today, 19 percent of total global corporate debt is in the form of bonds, nearly double the share in 2007. Annual nonfinancial corporate bond issuance has increased 2.5 times, from $800 billion in 2007 to $2 trillion in 2017. The global value of corporate bonds outstanding has increased 2.7 times since 2007 to $11.7 trillion, doubling as a share of GDP.
The average quality of blue-chip borrowers has declined. In the United States, almost 40 percent of nonfinancial corporate bonds are now rated BBB, just one notch above speculative-grade “junk bonds.” Growth in speculative-grade bonds has been particularly strong. Globally, the value of corporate high-yield bonds outstanding increased from $500 billion in 2007 to $1.9 trillion in 2017. In the coming five years, and unprecedented amount of these bonds will come due. Bond issuance by companies in China and other developing countries has soared. The value of China’s nonfinancial corporate bonds outstanding rose from $69 billion in 2007 to $2 trillion at the end of 2017, making China one of the largest bond markets in the world. Outside China, growth has been strongest in Brazil, Chile, Mexico, and Russia.
From 2018 to 2022, a record amount of bonds—between $1.6 trillion and $2.1 trillion annually—will mature. Globally, a total of $7.9 trillion of bonds will come due during those five years, based on bonds already issued. However, some bonds have maturities of less than five years and may still be issued and come due during that period. If current issuance trends continue, then as much as $10 trillion of bonds will come due over the next five years. At least $3 trillion of this total will be from US corporations, $1.7 trillion from Chinese companies, and $1.7 trillion from Western European companies.
Now overlay the rising interest rate environment, and you can see the problem. Such high leverage will cost the global economy dear, and sooner rather than later.