The Problem With LIBOR

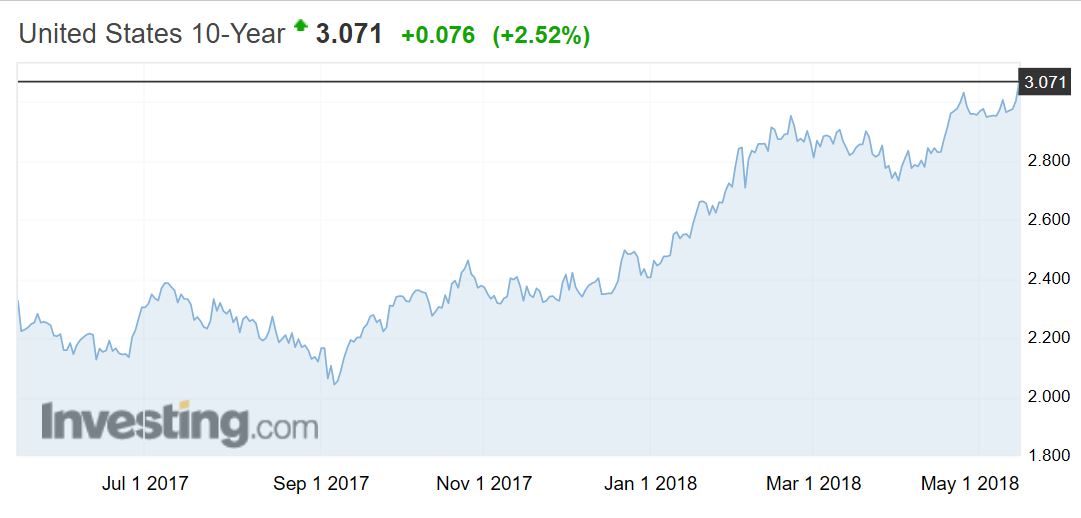
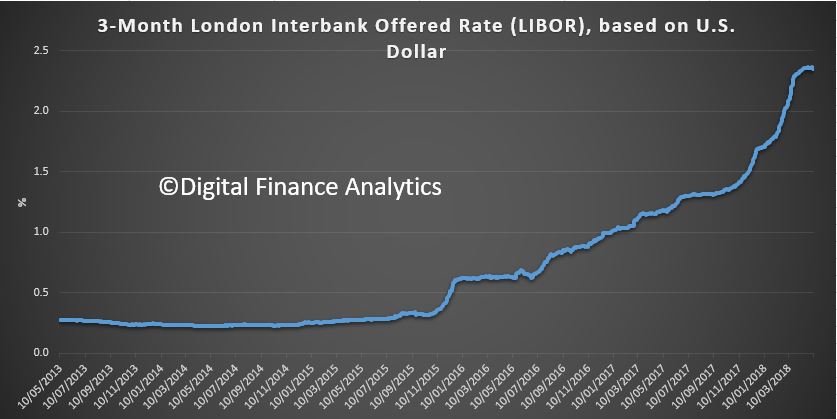
The cost of money continues to rise, and this includes the LIBOR benchmark rate, as shown by this chart. LIBOR or ICE LIBOR (previously BBA LIBOR) is a benchmark rate that some of the world’s leading banks charge each other for short-term loans. As it climbs, it signals rate rises ahead.

But what is LIBOR, and more importantly, will it survive?

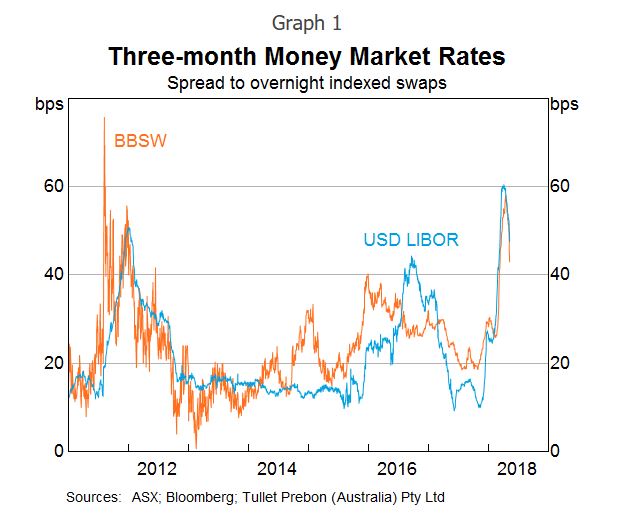
ICE LIBOR stands for Intercontinental Exchange London Interbank Offered Rate and serves as the first step to calculating interest rates on various loans throughout the world. LIBOR is administered by the ICE Benchmark Administration (IBA) and is based on five currencies: the U.S. dollar (USD), euro (EUR), pound sterling (GBP), Japanese yen (JPY), and Swiss franc (CHF). The LIBOR serves seven different maturities: overnight, one week, and 1, 2, 3, 6 and 12 months. There is a total of 35 different LIBOR rates each business day. The most commonly quoted rate is the three-month U.S. dollar rate (usually referred to as the “current LIBOR rate”), as shown in the chart.

So, LIBOR is the key interest rate benchmark for several major currencies, including the US dollar and British pound and is referenced in around US$350 trillion worth of contracts globally. A large share of these contracts have short durations, often three months or less. But it’s up for a shakeout as RBA Deputy Governor Guy Debelle Discussed recently.

Last year, the UK Financial Conduct Authority raised some serious questions about the sustainability of LIBOR. That is, apart from the rate fixing problems and the ensuing large fines.

The key problem is that there are not enough transactions in the short-term interbank funding market to reliably calculate the benchmark. In fact, the banks that make the submissions used to calculate LIBOR are uncomfortable about continuing to do this, as they have to rely mainly on their ‘expert judgment’ in determining where LIBOR should be rather than on actual transactions. To prevent LIBOR from abruptly ceasing to exist, the FCA has received assurances from the current banks on the LIBOR panel that they will continue to submit their estimates to sustain LIBOR until the end of 2021. But beyond that point, there is no guarantee that LIBOR will continue to exist. The FCA will not compel banks to provide submissions and the panel banks may not voluntarily continue to do so. There is no guarantee at all that will be the case.

So market participants that use LIBOR need to work on transitioning their contracts to alternative reference rates. The transition will involve a substantial amount of work for users of LIBOR, both to amend contracts and update systems. The process is not straightforward. A large share of these contracts have short durations, so these will roll off well ahead of 2021, but they should not continue to be replaced with another short-dated contract referencing LIBOR. A very sizeable number of current contracts would extend beyond 2021, with some lasting as long as 100 years.

So regulators around the world have been working closely with the industry to identify alternative risk-free rates that can be used instead of LIBOR. These alternative rates are based on overnight funding markets since there are plenty of transactions in these markets to calculate robust benchmarks. Last month, the Federal Reserve Bank of New York began publishing the Secured Overnight Financing Rate (SOFR) as the recommended alternative to US dollar LIBOR. For the British pound, SONIA has been identified as the alternative risk-free rate, and the Bank of England has recently put in place reforms to ensure that it remains a robust benchmark.

But these chosen risk-free rates are overnight rates, while the LIBOR benchmarks are term rates. Some market participants would prefer for the LIBOR replacements to also be term rates. While the development of term risk-free rates is on the long-term agenda for some currencies, they are unlikely to be available anytime soon. This reflects that there are currently not enough transactions in markets for term risk-free rates – such as overnight indexed swaps (OIS) – to support robust benchmarks. Given this reality, it is very important that users of LIBOR are planning their transition to the overnight risk-free benchmarks that are available, such as SOFR for the US dollar and SONIA for the British pound.

For the risk-free rates to provide an alternative to LIBOR, the next challenge is to generate sufficient liquidity in derivative products that reference the risk-free rates. This will take some time, particularly for the US dollar, where SOFR only recently started being published. Nevertheless, progress is being made, with the first futures contracts referencing SOFR recently being launched.

Market participants also need to be prepared for a scenario where the LIBOR benchmarks abruptly cease to be published. In such an event, users would have to rely on the fall-back provisions in their contracts. However, for many products the existing fall-back provisions would be cumbersome to apply and could generate significant market disruption. For instance, some existing fall-backs involve calling reference banks and asking them to quote a rate. To address this risk, the Financial Stability Board has encouraged ISDA to work with market participants to develop a more suitable fall-back methodology, using the risk-free rates that have been identified. But LIBOR is very different from an overnight risk-free rate as it includes bank credit risk and is a term rate. So the key challenge is to agree on a standard methodology for calculating credit and term spreads that can be added to the risk-free rate to construct a fall-back for LIBOR. This needs to be resolved as soon as possible, and we encourage users of LIBOR to engage with ISDA on this important work.

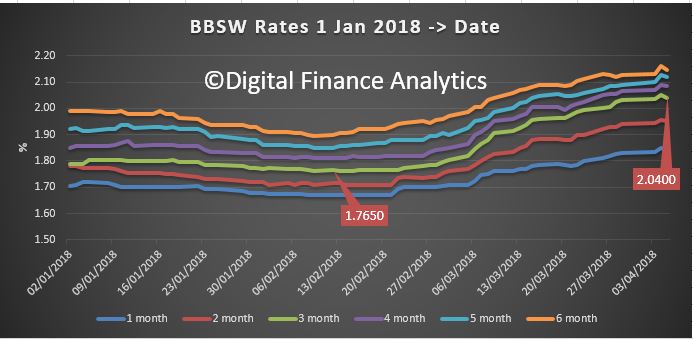
Finally, In Australia, the key InterBank Offer Rate benchmark for the Australian dollar is BBSW. Again we saw a spate of rate manipulations around BBSW, but the RBA and the Australian Securities and Investments Commission (ASIC) have been working closely with industry to ensure that it remains robust. The RBA argues the critical difference between BBSW and LIBOR is that there are enough transactions in the local bank bill market each day to calculate a robust benchmark. Australia has an active bank bill market, where the major banks issue bills as a regular source of funding, and a wide range of wholesale investors purchase bills as a liquid cash management product.

They think that BBSW can continue to exist even if credit-based benchmarks, such as LIBOR, are discontinued in other jurisdictions. But in the event that LIBOR was to be discontinued, with contracts transitioning to risk-free rates, there may be some corresponding migration away from BBSW towards the cash rate. This will depend on how international markets for products such as derivatives and syndicated loans end up adapting in a post-LIBOR world.

The infrastructure is already in place for BBSW and the cash rate to coexist as the key interest rate benchmarks for the Australian dollar. The OIS market is linked to the cash rate and has been operating for almost 20 years. It already has good liquidity at the short end, and the infrastructure is there for longer term OIS. A functioning derivatives market for trading the basis between the benchmarks is important for BBSW and the cash rate to smoothly coexist. Such a basis swap market is also in place, allowing market participants to exchange the cash flows under these benchmarks.

So the bottom line is that these Interbank Offer Rates are not as immutable as might be imagined, and this uncertainty is likely to continue for some time to come.

U.S. 10-Year Treasury Yield Hits Highest Level Since 2011

U.S. government 10-year bond yields rose to their highest level since 2011 on Tuesday and the two-year yield hit its highest since 2008 as traders continued to price in a faster pace of rate hikes by the Federal Reserve this year.

The yield on 10-year U.S. Treasury notes rose as high as 3.095, the highest level since August 2011. Bond yields move inversely to prices. Two-year Treasury yields rose as high as 2.56%, their highest since 2008. The yield on the 30-year Treasury note was also higher at 3.191%.

Mortgage rates in the US also moved higher.Yields were boosted after a report on U.S. retail sales for April indicated that consumer spending is on track to rebound after a soft patch in the first quarter.

The Commerce Department reported that retail sales rose 0.3% in April, while the prior months figure was revised up to 0.8% from a previously reported 0.6%.

Yields have climbing higher since the Fed said on at its May meeting that inflation is moving closer to its 2% target.

The Fed raised rates in March and projected two more rate hikes this year, although many investors see three hikes as possible.

The Economic Outlook (According to the RBA)

We got some more data on the state of the Australian Economy today from RBA Deputy Governor, Guy Debelle, which built on the recently released Statement on Monetary Policy (SMP).

There were four items which caught my attention.

First, the recent rise in money market interest rates in the US, particularly LIBOR. He said there are a number of explanations for the rise, including a large increase in bill issuance by the US Treasury and the effect of various tax changes on investment decisions by CFOs at some US companies with large cash pools.  This rise in LIBOR in the US has been reflected in rises in money market rates in a number of other countries, including here in Australia. This is because the Australian banks raise some of their short-term funding in the US market to fund their $A lending, so the rise in price there has led to a similar rise in the cost of short-term funding for the banks here; that is, a rise in BBSW. This increases the wholesale funding costs for the Australian banks, as well as increasing the costs for borrowers whose lending rates are priced off BBSW, which includes many corporates.

However, he says the effect to date has not been that large in terms of the overall impact on bank funding costs. It is not clear how much of the rise in LIBOR (and hence BBSW) is due to structural changes in money markets and how much is temporary. In the last couple of weeks, these money market rates have declined noticeably from their peaks.  But to my mind it shows one of the potential risks ahead.

Second the gradual decline in spare capacity is expected to lead to a gradual pick-up in wages growth. But when? The experience of other countries with labour markets closer to full capacity than Australia’s is that wages growth may remain lower than historical experience would suggest. In Australia, 2 per cent seems to have become the focal point for wage outcomes, compared with 3–4 per cent in the past. Work done at the Bank shows the shift of the distribution of wages growth to the left and a bunching of wage outcomes around 2 per cent over the past five years or so.

The RBA says that recent data on wages provides some assurance that wages growth has troughed. The majority of firms surveyed in the Bank’s liaison program expect wages growth to remain broadly stable over the period ahead. Over the past year, there has been a pick-up in firms expecting higher wage growth outcomes. Some part of that is the effect of the Fair Work Commission’s decision to raise award and minimum wages by 3.3 per cent.  They suggest there are pockets where wage pressures are more acute. But, while those pockets are increasing gradually, they remain fairly contained at this point

But he concluded that there is a risk that it may take a lower unemployment rate than we currently expect to generate a sustained move higher than the 2 per cent focal point evident in many wage outcomes today.

Third, he takes some comfort from the fact that arrears rates on mortgages remain low. This despite Wayne Byres comment a couple of months back, that at these low interest rates, defaults should be even lower! Debelle said that even in Western Australia, where there has been a marked rise in unemployment and where house prices have fallen by around 10 per cent, arrears rates have risen to around 1½ per cent, which is not all that high compared with what we have seen in other countries in similar circumstances and earlier episodes in Australia’s history. To which I would add, yes but interest rates are ultra-low. What happens if rates rise as we discussed above or unemployment rises further?

Finally, the interest rate resets on interest-only loans will potentially require mortgage payments to rise by nearly 30–40 per cent for some borrowers. There are a number of these loans whose interest-only periods expire this year. It is worth noting that there were about the same number of loans resetting last year too. The RBA says there are quite a few mitigants which will allow these borrowers to cope with this increase in required payments, including the prevalence of offset accounts and the ability to refinance to a principal and interest loan with a lower interest rate. While some borrowers will clearly struggle with this, our expectation is that most will be able to handle the adjustment so that the overall effect on the economy should be small.

This switch away from interest-only loans should see a shift towards a higher share of scheduled principal repayments relative to unscheduled repayments for a time. We are seeing that in the data. It also implies faster debt amortisation, which may have implications for credit growth.

And there is a risk of a further tightening in lending standards in the period ahead. This may have its largest effect on the amount of funds an individual household can borrow, more than the effect on the number of households that are eligible for a loan. This, in turn, means that credit growth may be slower than otherwise for a time. That he says has more of an implication for house prices, than it does for the outlook for consumption. To which I would add, yes, but consumption is being funded by raiding deposits and higher debt. Hardly sustainable.

So in summary, there are still significant risks in the system and the net effect could well drive prices lower, as credit tightens. And I see the RBA slowly turning towards the views we have held for some time. I guess if there is more of a down turn ahead, they can claim they warned us (despite their settings setting up the problem in the first place).

Is This How Bitcoin Could Go Mainstream?

When I made my first video on Digital and Cyber Currencies – What Is Money? I said I would return to Bitcoin.

Now, today I am not going to discuss the mechanics of the digital currency, there are plenty of others who have done that; nor am I going to discuss the limited supply, which is mirroring gold, other than to note this one of the fundamental design criteria of the crypto currency.

But institutional investors are getting more interested.

For example, Goldman Sachs announced it will be opening a crypto derivatives trading desk “within weeks,” as well as recently hiring a cryptocurrency trader as vice president of their digital asset markets. It will trade Bitcoin futures in a principal, market-making capacity and will also create non-deliverable forward products.

Then last week there was some more potentially important news out of the USA. There are rumours that the New York Stock Exchange may be planning to offer ‘Physical Delivery’ of Bitcoin. If this is true, it could mark a significant transformation in the role of digital currencies like Bitcoin.

The suggestion from unnamed “multiple sources” is that NYSE’s parent company Intercontinental Exchange or ICE is planning to offer Bitcoin (BTC) swap contracts but these contracts would be settled with the delivery of Bitcoin itself. Think about that, a mechanism to allow the physical delivery of a digital currency. If this IS true, this would have significant consequence for the future of crypto.

While there are Bitcoin futures contracts currently being offered on Chicago based CME Group derivatives marketplace or CME (since December 2017) and Chicago Board Options Exchange CBOE, these are ultimately settled in dollars.

The suggested crypto swap contracts would be settled in Bitcoin, and this would be a significant milestone which may signal a major Wall Street adoption of crypto.

Significantly it could mean that the ICE has a custody solution. As Bitcoin are generally bearer instruments it means you have to have a third-party custody option if institutional investors are going to get seriously involved.

There are so called “Cold storage custodian solutions” offered by small operators.

It’s not clear whether ICE is likely to build an in-house cold storage solution or to outsource it. In fact, ICE has made no comment at all on this, so it might be just speculation.

But here’s the thing, if ICE can offer a custodian solution that meets SEC rules and compliance requirements, this could “open the floodgates” to institutional capital, resulting in some “big price moves” in the crypto markets.

A custody solution would also open the door for pensions and endowments and so become an emergent asset class…most obviously at the expense of gold.

The Bitcoin price is still sitting well below the previous highs and the markets did not really respond to the rumours. But if this is true, then it may mark a significant inflection point in evolution of crypto. It might go mainstream.

Aussie fintech startup wins Barclays’ global “Open Innovation Challenge 2018”

Aussie trade financing deep technology startup, Trade Ledger, has finished ahead of nine other VC-backed companies from across the world to be named the winner of the Barclays UK Ventures “Open Innovation Challenge 2018” in London this week.

The ten finalists were hand-picked by Barclays due to their potential to offer game-changing business solutions across a variety of industries, however Trade Ledger came out on top because of the way it completely transforms processes in business lending, through its world-first technology platform.

“Within Barclays UK Ventures, we’re looking for companies we can partner with to develop and deliver transformational products and services,” said Ben Davey, CEO of Barclays UK Ventures.

“We chose Trade Ledger as they have re-imagined the lending process by improving the processes through automation and opening up lending opportunities to a larger client base, which fully aligns to our Shared Growth ambition.”

The competition involved a face-to-face pitch by each of the ten finalists to Barclays’ technology leadership team. Other finalists hailed from high-tech industries such as AI security, recruitment CRM and marketing automation, process mining software, application performance management, IoT, chatbots, and robotic process automation platform creation.

The event served as a means for Barclays to gain access to some of the most advanced technologies being developed from across the globe.

“These events are a great way for us to uncover solutions that will materially improve our business and the solutions we offer to customers and clients,” said Sean Duffy, Managing Director of Technology Media and Telecoms in Barclays Corporate Banking Division.

“This is the first time we’ve hosted this event in the UK, which is a testament to the growing strength and depth of VC-backed companies in our home market.”

Gaining international exposure through competitions such as this one is an important aspect of Trade Ledger’s “born global” strategy, designed to tackle the £1.2 trillion under-supply of business credit globally.

“We are delighted that Barclays has chosen the Trade Ledger business lending platform as the winner of this global challenge,” Martin McCann, CEO and founder of Trade Ledger.

“It was an incredible opportunity to be able to present our tech and strategy for helping banks address the massive under-supply of business credit, to such a large and diverse group of the bank’s technology leaders.

“We believe the platform will help Barclays accelerate their transformation into data-driven lending, and that our selection proves the unique value of the Trade Ledger platform to support the bank’s innovation and growth ambitions.”

Further discussions on a partnership with Barclays are ongoing, and will help Trade Ledger prove product marlet fit within tier 1 banks globally.

The Property Imperative 10 Report Released

The latest and updated edition of our flagship report “The Property Imperative” is now available on request with data to April 2018.

This Property Imperative Report is a distillation of our research in the finance and property market, using data from our household surveys and other public data. We provide weekly updates via our blog – the Property Imperative Weekly, but twice a year publish this report.  This is volume 10.

Residential property, and the mortgage industry is currently under the microscope, as never before. The currently running Royal Commission has laid bare a range of worrying and significant issues, and recent reviews by the Productivity Commission and ACCC point to weaknesses in both the regulation of the banks and weak competition in the sector. We believe we are at a significant inflection point and the market risks are rising fast. Portfolio risks are being underestimated.  Many recent studies appear to support this view. There are a number of concerning trends.

Around two thirds of all households have interests in residential property, and about half of these have mortgages. More households are excluded completely and are forced to rent, or live with family or friends.

We have formed the view that credit growth will slow significantly in the months ahead, as lending standards tighten. As a result, home prices will fall. We note that household incomes remain flat in real terms, the size of the average mortgage has grown significantly in the past few years, thanks to rising home prices (in some states), changed lending standards, and consumer appetite for debt. In fact, consumer debt has never been higher in Australia. Household finances are being severely impacted, and more recent changes in underwriting standards are making finance less available for many. But the risk is in those loans made in recent years under looser standards, including interest only loans.

Property Investors still make up a significant share of total borrowing, and experience around the world shows it is these households who are more fickle in a downturn. Many use interest only loans, which create risks downstream, and regulators have recently been applying pressure to lenders to curtail their growth.  Already we are seeing a drop in investor loans, and a reduction in interest only loans. A significant proportion will be up for review within tighter lending rules. This may lift servicing costs, at very least and potentially cause some to sell.

We hold the view that home prices are set to ease in coming months, as already foreshadowed in Sydney. We think mortgage rates are more likely to rise than fall as we move on into 2019.

We will continue to track market developments in our Property Imperative weekly video blogs, and publish a further update in about six months’ time.

If you are seeking specific market data from our Core Market Model, reach out, and we will endeavour to assist.

Here is the table of contents.

1	EXECUTIVE SUMMARY
2	TABLE OF CONTENTS
3.	OUR RESEARCH APPROACH
4.	THE DFA SEGMENTATION MODEL
5	PROFILING THE PROPERTY MARKET
5.1	Current Property Prices
5.2	Property Transfer Volumes Are Down
5.3	Clearance Rates Are Easing
5.4	But Can We Believe the Auction Statistics Anyway?
6	MORTGAGE LENDING TRENDS
6.1	Total Housing Credit Is Up
6.2	ADI Lending Trends
6.3	Housing Finance Flows – Bye-Bye Property Investors
6.4	The Rise of the Bank of Mum and Dad
6.5	Lending Standards Are Tightening
6.6	How Low Will Borrowing Power Go?
6.7	The Portfolio Mix Is Changing
6.8	Funding Costs Are Higher
6.9	The Interest Only Loan Problem
7	HOUSEHOLD FINANCES AND RISKS
7.1	Households’ Demand for Property
7.2	Property Active and Inactive Households
7.3	Cross Segment Comparisons
7.4	Property Investors
7.5	How Many Properties Do Investors Have?
7.6	SMSF Property Investors
7.7	First Time Buyers.
7.8	Want to Buys
7.9	Up Traders and Down Traders
7.10	Household Financial Confidence Continues to Fall
7.11	Mortgage Stress Is Still Rising
7.12	But The RBA Is Unperturbed
7.13	Latest Household Debt Figures a Worry
8	THE CURRENT INQUIRIES
8.1	Productivity Commission
8.2	The ACCC Mortgage Pricing Review
8.3	The Royal Commission into Misconduct in Finance Services
8.4	Merge Financial Advice and Mortgage Brokering Regulation
9	AN ALTERNATIVE FINANCIAL NARRATIVE
9.1	Popping The Housing Affordability Myth
9.2	The Chicago Plan
10	FOUR SCENARIOS
11	FINAL OBSERVATIONS
12	ABOUT DFA
13	COPYRIGHT AND TERMS OF USE

Request the free report [85 pages] using the form below. You should get confirmation your message was sent immediately and you will receive an email with the report attached after a short delay.

Note this will NOT automatically send you our ongoing research updates, for that register here.

[contact-form to=’mnorth@digitalfinanceanalytics.com’ subject=’Request for The Property Imperative Report 10′][contact-field label=’Name’ type=’name’ required=’1’/][contact-field label=’Email’ type=’email’ required=’1’/][contact-field label=’Email Me The Report’ type=’radio’ options=’Yes Please’ required=’1′ /][contact-field label=’Comment If You Like’ type=’textarea’/][/contact-form]

Risks In A Financially Connected World

The Bank for International Settlements, the “Central Bankers Banker” has just released an interesting, and concerning report with the catchy title of “Financial spillovers, spillbacks, and the scope for international macroprudential policy coordination“.

But in its 53 pages of “dry banker speak” there are some important facts which shows just how much of the global financial system is now interconnected.

They start by making the point that over the past three decades, and despite a slowdown coinciding with the global financial crisis (GFC) of 2007–09, the degree of international financial integration has increased relentlessly.

In fact the rapid pace of financial globalisation over the past decades has also been reflected in an over sixfold increase in the external assets and liabilities of nations as a share of GDP – despite a marked slowdown in the growth of cross-border positions in the immediate aftermath of the GFC.

This chart shows the evolution of advanced economies’ financial exposures to a group of large middle-income countries, split into portfolio exposures and bank exposures. It shows that both types of exposures have increased substantially since the late 1990s.

Here is another chart which again the linkages, looking at cross-border liabilities by counterparty. The chart shows the classification of cross-border debt liabilities by type of counterparty. It shows that cross-border liabilities where both creditor and debtor are banks are the largest of the four possible categories, and increased rapidly in the run-up to the GFC. It also shows a rapid increase in credit flows relative to foreign direct investments (FDI) and portfolio equity flows.

They explain that cross-border bank-to-bank funding (liabilities) can be decomposed into two distinctive forms: (a) arm’s length (interbank) funding that takes place between unrelated banks; and (b) related (intragroup) funding that takes place in an internal capital market between global parent banks and their foreign affiliates. They note that cross-border bank-to-bank liabilities have also played a major role in the expansion of domestic lending, at their peak in 2007 these flows accounted for more than 25% of total private credit of the recipient economy.

This also opens the door to potential arbitrage, for example “rebooking” of loans, whereby loans are originated by subsidiaries but then booked on the balance sheet of the parent institution.  Indeed, the presence of foreign branches of financial institutions that are not subject to host country regulation may undermine domestic macroprudential policies.

This degree of global linkage raises significant issues, despite the argument trotted about by economists that there are benefits from the improved efficiency of resource allocation.

First, the increased global interconnectedness has led to new risks, associated with the amplification of shocks during turbulent times and the transmission of excess financial volatility through international capital flows. They suggest there is robust evidence that private capital flows have been a major conduit of global financial shocks across countries and have helped fuel domestic credit booms that have often ended in financial crises, especially in developing economies.

Second, international capital flows have created macroeconomic policy challenges for advanced economies as well. For example, the rest of the world’s appetite for US safe assets was an important factor behind the credit and asset price booms in the United States that fuelled the subsequent financial crisis and created turmoil around the world. It is also well documented that since the GFC, the various forms of accommodative monetary policy pursued in the United States and the euro area have exerted significant spillover effects on other countries by influencing interest rates and credit conditions around the world – irrespective, at first sight, of the nature of the exchange rate regime.

Finally, there is evidence to suggest that in recent years financial market volatility in some large middle-income countries has been transmitted back, and to a greater extent, to asset prices in advanced economies and other countries. For instance, the suspension of trading after the Chinese stock market drop on 6 January 2016 affected major asset markets all over the world. Thus, international spillovers have become a two-way street – with the potential to create financial instability in both directions.

This means that macroeconomic settings in the USA – and especially the progressive rise in their benchmark rate, and reversal of QE, will have flow-on effects which will resonate around the global financial system. In a way, no country is an island.

The paper does also make the point that there may be some benefits – for example, if the global economy is experiencing a recession for instance, the coordinated adoption of an expansionary fiscal policy stance by a group of large countries may, through trade and financial spillovers, benefit all countries. The magnitude of this gain may actually increase with the degree to which countries are interconnected, the degree of business cycle synchronisation, and the very magnitude of spillovers.

But, if maintaining financial stability is a key policy objective, the propagation of financial risks through volatile short-term capital flows also becomes a source of concern.

After detailed analysis the paper reaches the following conclusions.

First, with the advance in global financial integration over the last three decades, the transmission of shocks has become a two-way street – from advanced economies to the rest of the world, but also and increasingly from a group of large middle-income countries, which we refer to as SMICs, to the rest of the world, including major advanced economies. These increased spillbacks have strengthened incentives for advanced economies to internalise the impact of their policies on these countries, and the rest of the world in general. Although stronger spillovers and spillbacks are not in and of themselves an argument for greater policy coordination between these economies, the fact that they may exacerbate financial risks – especially when countries are in different phases of their economic and financial cycles – and threaten global financial stability is.

Second, the disconnect between the global scope of financial markets and the national scope of financial regulation has become increasingly apparent, through leakages and cross-border arbitrage – especially through global banks. In fact, what we have learned from the financial trilemma is that it has become increasingly difficult to maintain domestic financial stability without enhancing cross-border macroprudential policy coordination, at least in its structural dimension. Avoiding the leakages stemming from international regulatory arbitrage and open capital markets requires cooperation, but addressing cyclical risks requires coordination.

Third, divergent policies and policy preferences contribute additional dimensions to global financial risks. In the absence of a centralised macroprudential authority, coordination needs to rely on an international macroprudential regime that promotes global welfare. Yet, divergence in national interests can make coordination unfeasible. Fourth, significant gaps remain in the evidence on regulatory spillovers and arbitrage, and the role of the macroprudential regime in the cross-border transmission of shocks. In addition, research on the potential gains associated with multilateral coordination of macroprudential policies remains limited. This may be due in part to the natural or instinctive focus of national authorities on their own country’s objectives, or to greater priority on policy coordination within countries – an important ongoing debate in the context of monetary and macroprudential policies. This “inward” focus may itself be due to the lack of perception of the benefits of multilateralism with respect to achieving national objectives – which therefore makes further research on these benefits all the more important.

This assessment suggests that, in a financially integrated world, international coordination of macroprudential policies may not only be valuable, but also essential, for macroprudential instruments to be effective at the national level. A first step towards coordination has been taken with Basel III’s principle of jurisdictional reciprocity for countercyclical capital buffers, but this principle needs to be extended to a larger array of macroprudential instruments. Further empirical and analytical work (including by the BIS, FSB and IMF) on the benefits of international
macroprudential policy coordination could play a significant role in promoting more awareness of the potential gains associated with global financial stability. This work agenda should involve a research component focused on measuring the gains from coordination and improving data on cross-border financial flows intermediated by various entities (banks, investment funds and large institutional investors), as well as improving capacity for systemic risk monitoring.

My own take is that we have been sleepwalking into a scenario where large capital flows and international financial players operating cross borders, negating the effectiveness of local macroeconomic measures, to their own ends.  This new world is one where large global players end up with more power to influence outcomes than governments. No wonder that they often march in step, in terms of seeking outcomes which benefit the financial system machine.

Somewhere along the road, we have lost the plot, but unless radical changes are made, the Genie cannot be put back into the bottle. This should concern us all.

Reading Credit Flows for Crisis Signals

A timely warning from the IMF about the rapid growth in credit, especially to risky areas, just before a financial crisis. I suspect this is just where Australia is currently!

From The IMF Blog.

Supervisors who monitor the health of the financial system know that a rapid buildup of debt during an economic boom can spell trouble down the road. That is why they keep a close eye on the overall volume of credit in the economy. When companies go on a borrowing spree, supervisors and regulators may decide to put the brakes on credit growth.

Trouble is, measuring credit volume overlooks an important question: how much of that additional money flows to riskier companies – which are more likely to default in times of trouble—compared with more creditworthy firms? The IMF’s latest Global Financial Stability Report seeks to fill that gap by constructing measures of the riskiness of credit allocation, which should help policy makers spot clouds on the economic horizon.

Our researchers crunched 25 years of data for nonfinancial companies in 55 emerging and advanced economies. They found that when credit grows rapidly, the firms where debt expands faster become increasingly risky in relation to those with the slowest debt expansions. Such an increase in the riskiness of credit allocation, in turn, points to greater odds of a severe economic downturn or a banking crisis as many as three years into the future.

Extra dose

This buildup of lending to relatively less creditworthy companies adds an extra dose of risk – on top of the dangers that may come with the rapid growth of credit overall. Of course, lending to risky firms may be perfectly rational and profitable. But it can also spell trouble if it reflects poorer screening of borrowers or excessive risk-taking.

Fortunately, regulators can take steps to protect the financial system, if necessary. They can require banks to hold more capital or impose limits on bank loan growth, restraining their risk-bearing capacity and increasing their buffers. Ensuring the independence of bank supervisors, enforcing lending standards, and strengthening corporate governance by protecting minority shareholders can also help keep risks in check.

Why does more credit flow to risker firms in good times? It’s possible that investors are unduly optimistic about future economic prospects, leading them to extend credit to more vulnerable firms. If interest rates are unusually low, banks and investors may be tempted to lend money – in the form of loans or bonds – to riskier companies that pay relatively higher rates of interest. We have seen this “search for yield” in advanced economies in recent years because of the prolonged period of ultra-low interest rates. The riskiness of credit allocation may thus be a good barometer of risk appetite.

Global pattern

Our study found a clear global pattern in the evolution of this new measure of financial vulnerability. Starting at elevated levels in the late 1990s, the riskiness of credit allocation fell from 2000 to 2004, in the aftermath of financial crises in Asia and Russia and the dot-com equity bubble. From a historic low in 2004, riskiness rose to a peak in 2008, when the global financial crisis erupted. It then declined sharply before rising again to a level near its historical average at the end of 2016, the last available data point. Riskiness may have continued to rise in 2017 as market volatility and interest rates remained very low in the global economy.

The Global Financial Stability Report holds a clear lesson for policy makers and regulators: both the total volume of credit and the riskiness of its allocation are important. A period of rapid growth is more likely to be followed by a severe economic downturn if more of that credit is flowing to riskier firms. Policy makers should pay close attention to both measures – and take the appropriate steps when warning signals flash.

BBSW Rates Higher; Signals Rate Lifts

The latest BBSW data shows the trajectory in recent weeks. This will add more pressure to bank funding costs.

The question to consider is whether these moves are reflective of changes in global rates – LIBOR for example is higher (see below) – or whether this reflects the perceived risks in the local bank market in the light of the first rounds from the Royal Commission, which has generally underscored potential risks in their lending books. Or both.

The international rates are probably more the cause of the move of 25 basis points or more, which is significant because it suggests more upward pressure ahead, irrespective of what the RBA may choose to do.

We think mortgage rates will likely (and quietly) go higher in the months ahead.


The Housing Boom Is “Officially” Over – The Property Imperative 07 Apr 2018

Welcome to the Property Imperative Weekly to 07 April 2018.

Watch the video, or read the transcript.

In this week’s digest of finance and property news, we start with Paul Keating’s (he of the recession we had to have fame), comment that the housing boom is really over at the recent AFR conference.

He said that the banks were facing tighter controls as a result of the Basel rules on capital adequacy, while financial regulators had had a “gutful” of them. This was likely to lead to changes that would restrict the banks’ ability to lend. He cited APRA’s recent interventions in interest only loans as one example, as they restrict their growth. Keating also said the royal commission into misconduct in the banking and financial services sector would also “make life harder” for the banks and pointed out that banks did not really want to lend to business these days and would “rather just do housing loans”. Finally, he spoke of the “misincentives” within the big banks to grow their business by writing new mortgages, including having a high proportion of interest-only lending.

Anna Bligh speaking at the AFR event, marked last Tuesday her first year as CEO of the Australian Banking Association (ABA) – but said she feels “like 500 years” have already passed. Commenting on the Royal Commission she warned that credit could become tighter ahead. The was she said an opportunity for a major reset, not only in how we do banking but how we think about it, its place in our lives, its role in our economy and, most of all, it’s trustworthiness”.

At the same conference, Rod Simms the Chair of the ACCC speech “Synchronised swimming versus competition in banking” He discussed the results of their recent investigation into mortgage pricing, and also discussed the broader issues of competition versus financial stability in banking. He warned that the industry should be aware of, and respond to, the fact that the drive for consumers to get a better deal out of banking is shared by many beyond the ACCC. Every household in Australia is watching.  You can watch our video blog on this for more details.

He specifically called out a lack of vigorous mortgage price competition between the five big Banks, hence “synchronised swimming”. Indeed, he says discounting is not synonymous with vigorous price competition. They saw evidence of communications “referring to the need to avoid disrupting mutually beneficial pricing outcomes”.

He also said residential mortgages and personal banking more generally make one of the strongest cases for data portability and data access by customers to overcome the inertia of changing lenders.

Finally, on competition. he says if we continue to insulate our major banks from the consequences of their poor decisions, we risk stifling the cultural change many say is needed within our major banks to put the needs of their customers first. Vigorous competition is a powerful mechanism for driving improved efficiency, and also for driving improved price and service offerings to customers. It can in fact lead to better stability outcomes.

This puts the ACCC at odds with APRA who recent again stated their preference for financial stability over competition – yet in fact these two elements are not necessarily polar opposites!

Then there was the report from the good people at UBS has published further analysis of the mortgage market, arguing that the Royal Commission outcomes are likely to drive a further material tightening in mortgage underwriting. As a result, they think households “borrowing power” could drop by ~35%, mainly thanks to changes to analysis of expenses, as the HEM benchmark, so much critised in the Inquiry, is revised. Their starting point assumes a family of four has living expenses equal to the HEM ‘Basic’ benchmark of $32,400 p.a. (ie less than the Old Age Pension). This is broadly consistent with the Major banks’ lending practices through 2017. As a result, the borrowing limits provided by the banks’ home loan calculators fell by ~35% (Loan-to-Income ratio fell from ~5-6x to ~3-4x). This leads to a reduction in housing credit and a further potential fall in home prices.

Our latest mortgage stress data, which was picked by Channel Nine and 2GB, thanks to Ross Greenwood, Across Australia, more than 956,000 households are estimated to be now in mortgage stress (last month 924,500). This equates to 30.0% of households. In addition, more than 21,000 of these are in severe stress, no change from last month. We estimate that more than 55,000 households risk 30-day default in the next 12 months. We expect bank portfolio losses to be around 2.8 basis points, though with losses in WA are higher at 4.9 basis points.  Flat wages growth, rising living costs and higher real mortgage rates are all adding to the burden. This is not sustainable and we are expecting lending growth to continue to moderate in the months ahead as underwriting standards are tightened and home prices fall further”. The latest household debt to income ratio is now at a record 188.6. You can watch our separate video blog on this important topic.

ABS data this week showed The number of dwellings approved in Australia fell for the fifth straight month in February 2018 in trend terms with a 0.1 per cent decline. Approvals for private sector houses have remained stable at around 10,000 for a number of months. But unit approvals have fallen for five months. Overall, building activity continues to slow from its record high in 2016. And the sizeable fall in the number of apartments and high density dwellings being approved comes at a time when a near record volume are currently under construction. If you assume 18-24 months between approval and completion, then we still have 150,000 or more units, mainly in the eastern urban centres to come on stream. More downward pressure on home prices. This helps to explain the rise in 100% loans on offer via some developers plus additional incentives to try to shift already built, or under construction property.

CoreLogic reported  last week’s Easter period slowdown saw 670 homes taken to auction across the combined capital cities, down significantly on the week prior when a record number of auctions were held (3,990). The lower volumes last week returned a higher final clearance rate, with 64.8 per cent of homes selling, increasing on the 62.7 per cent the previous week.  Both clearance rate and auctions volumes fell across Melbourne last week, with only 152 held and 65.5 per cent clearing, down on the week prior when 2,071 auctions were held across the city returning a slightly higher 65.8 per cent success rate.

Sydney had the highest volume of auctions of all the capital city auction markets last week, with 394 held and a clearance rate of 67.9 per cent, increasing on the previous week’s 61.1 per cent across a higher 1,383 auctions.

Across the smaller capital cities, clearance rates improved week-on-week in Canberra, Perth and Tasmania; however, volumes were significantly lower across each market last week compared to the week prior.

Across the non-capital city auction markets, the Geelong region recorded the strongest clearance rate last week with 100 per cent of the 20 auction results reporting as successful.

The number of homes scheduled to go to auction this week will increase across the combined capital cities with 1,679 currently being tracked by CoreLogic, up from last week when only 670 auctions were held over the Easter period slowdown.

Melbourne is expected to see the most significant increase in volumes this, with 669 properties scheduled for auction, up from 152 auctions held last week. In Sydney, 725 homes are set to go to auction this week, increasing on the 394 held last week.

Outside of Sydney and Melbourne, each of the remaining capital cities will see a higher number of auctions this week compared to last week.

Overall auction activity is set to be lower than one year ago, when 3,517 were held over what was the pre-Easter week last year.

Finally, with local news all looking quite negative, let’s look across to the USA as the most powerful banker in the world, JPMorgan Chase CEO Jamie Dimon, just released his annual letter to shareholders.  Given his bank’s massive size (it earned $24.4 billion on $103.6 billion in revenue last year) and reach (it’s a giant in consumer/commercial banking, investment banking and wealth management), Dimon has his figure on the financial pulse.

He says that’s while the US economy seems healthy today and he’s bullish for the “next year or so” he admits that the US is facing some serious economic headwinds.

For one, he’s concerned the unwinding of quantitative easing (QE) could have unintended consequences. Remember- QE is just a fancy name for the trillions of dollars that the Federal Reserve conjured out of thin air.

He said – Since QE has never been done on this scale and we don’t completely know the myriad effects it has had on asset prices, confidence, capital expenditures and other factors, we cannot possibly know all of the effects of its reversal.

We have to deal with the possibility that at one point, the Federal Reserve and other central banks may have to take more drastic action than they currently anticipate – reacting to the markets, not guiding the markets.

And of course the DOW finished the week on a down trend, down 2.34%, and wiping out all the value gained this year, and volatility is way up. Here is a plot of the DOW.

This extreme volatility does suggest the bull market is nearing its end… if it hasn’t ended already. Dimon seems pretty sure we’re in for more volatility and higher interest rates. One scenario that would require higher rates from the Fed is higher inflation:

If growth in America is accelerating, which it seems to be, and any remaining slack in the labor markets is disappearing – and wages start going up, as do commodity prices – then it is not an unreasonable possibility that inflation could go higher than people might expect.

As a result, the Federal Reserve will also need to raise rates faster and higher than people might expect. In this case, markets will get more volatile as all asset prices adjust to a new and maybe not-so-positive environment.

Now– here’s the important part. For the past ten years, the largest buyer of US government debt was the Federal Reserve. But now that QE has ended, the US government just lost its biggest lender.

Dimon thinks other major buyers, including foreign central banks, the Chinese, etc. could also reduce their purchases of US government debt. That, coupled with the US government’s ongoing trade deficits (which will be funded by issuing debt), could also lead to higher rates…

So we could be going into a situation where the Fed will have to raise rates faster and/ or sell more securities, which certainly could lead to more uncertainty and market volatility. Whether this would lead to a recession or not, we don’t know.

We’ll leave you with one final point from Jamie Dimon. He acknowledges markets have a mind of their own, regardless of what the fundamentals say. And he sees a real risk “that volatile and declining markets can lead to a market panic.”

Financial markets have a life of their own and are sometimes barely connected to the real economy (most people don’t pay much attention to the financial markets nor do the markets affect them very much). Volatile markets and/or declining markets generally have been a reaction to the economic environment. Most of the major downturns in the market since the Great Depression reflect negative future expectations due to a potential or real recession. In almost all of these cases, stock markets fell, credit losses increased and credit spreads rose, among other disruptions. The biggest negative effect of volatile markets is that it can create market panic, which could start to slow the growth of the real economy. Because the experience of 2009 is so recent, there is always a chance that people may overreact.

Dimon cautioned investors that interest rates could rise much sooner than they expect. If inflation suddenly comes roaring back. Indeed, it’s entirely possible the 10-year could break above 4% in the near future as inflation returns to 2% and the Fed shrinks its balance sheet.

Dimon also cast a wary eye toward exchange-traded funds, which have seen their popularity multiply since the financial crisis. There are now many ETF products that are considerably more liquid than their underlying assets. In fact far more money than before (about $9 trillion of assets, which represents about 30% of total mutual fund long-term assets) is managed passively in index funds or ETFs (both of which are very easy to get out of). Some of these funds provide far more liquidity to the customer than the underlying assets in the fund, and it is reasonable to worry about what would happen if these funds went into large liquidation.

And Finally America’s net debt currently stands at 77% of GDP (this is already historically high but not unprecedented). The chart below also shows the Congressional Budget Office’s estimate of the total U.S. debt to GDP, assuming a 2% real GDP growth rate. Hopefully, with the right policies they can grow faster than 2%. But more debt does seem on the cards.

And to add to that perspective, we spoke about the recent Brookings report which highlighted the rise in non conforming housing debt in the USA. debt as lending standards are once again being loosened, and risks to mortgage services are rising.

The authors quote former Ginnie Mae president Ted Tozer concerning the stress between Ginnie Mae and their nonbank counterparties.

… Today almost two thirds of Ginnie Mae guaranteed securities are issued by independent mortgage banks. And independent mortgage bankers are using some of the most sophisticated financial engineering that this industry has ever seen. We are also seeing greater dependence on credit lines, securitization involving multiple players, and more frequent trading of servicing rights and all of these things have created a new and challenging environment for Ginnie Mae. . . . In other words, the risk is a lot higher and business models of our issuers are a lot more complex. Add in sharply higher annual volumes, and these risks are amplified many times over. . . . Also, we have depended on sheer luck. Luck that the economy does not fall into recession and increase mortgage delinquencies. Luck that our independent mortgage bankers remain able to access their lines of credit. And luck that nothing critical falls through the cracks…

They say that goldfish have the shortest memory in the Animal Kingdom… something like 3-seconds. But not even a decade after these loans nearly brought down the entire global economy, SUBPRIME IS BACK. In fact it’s one of the fastest growing investments among banks in the United States. Over the last twelve months the subprime volume among US banks doubled, and it’s already on pace to double again this year.

What could possibly go wrong?