I catch up with Author and Businessman Robert Kiyosaki ahead of the final live show in the current series that Harry Dent, Robert and I will be participating in this coming Sunday 30th August 2020, details at www.summitlivestream.com.
Note DFA has no commercial relationship with Harry, Robert or the organisers of this event, and we do not endorse the content or speakers. However, we will be presenting material on our latest research during the session.
DFA has released our latest results from our rolling 52,000 household surveys. As a result of the economic slowdown (which was already underway before COVID) and exacerbated by the COVID restrictions, more households are falling into financial stress.
We define stress in cash flow terms – money in and money out – for both rental and mortgage stress, with those in negative cash flow flagged as stressed. Investor stress is assessed by different means, including negative cash flow, extended vacancy rates, intention to sell and other factors. In the round while the various Government support schemes, and repayment holidays, plus rental freezes are assisting, the downward trajectory in finances is clear, and explains the rising stress.
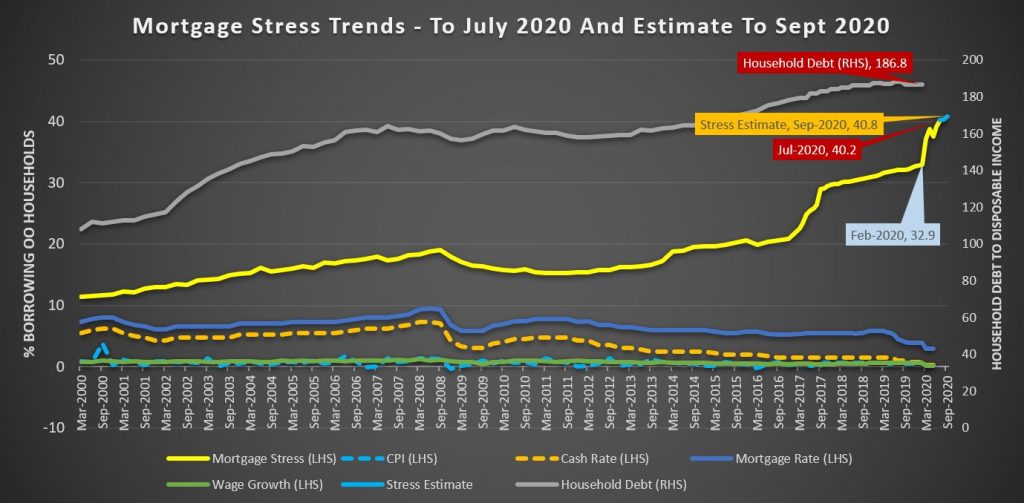
Mortgage stress rose to its highest level ever at 40.2 of households. We expect this to climb higher as support is moderated, and banks have hard conversations about recommencing repayments. Morgan Stanley commissioned a survey of mortgagors as part of some research on the impact of the coronavirus, and found that 55 per cent of them have received some form of income support. Household debt ratios continue to rise (thanks also to the capitalised interest and repayment holidays).
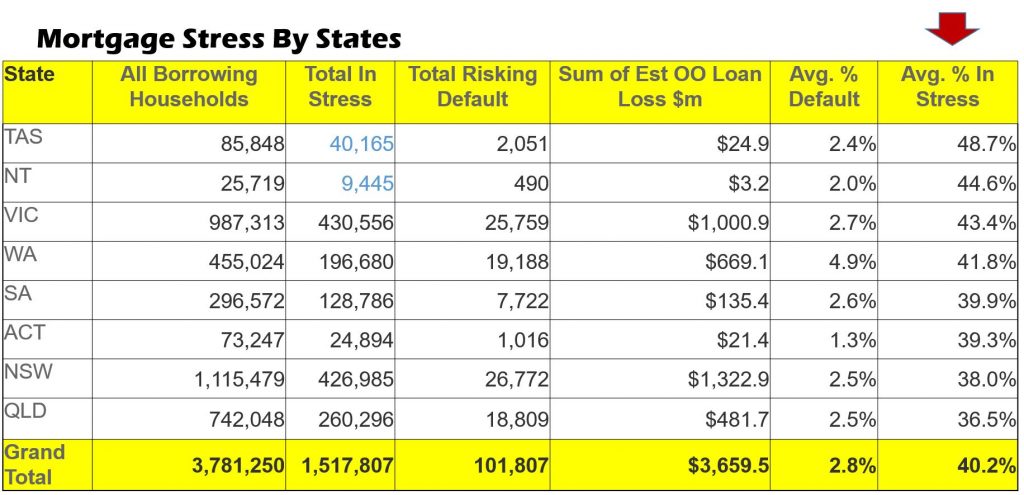
Two states saw a slight decline in the month, TAS and NT, as restrictions were somewhat eased,though both states have the highest stress percentages. But households in VIC rose by more than 15,000 from last month and NSW by more than 12,000. Overall more than 1.5 million households are impacted, up from 1.45 million last month.
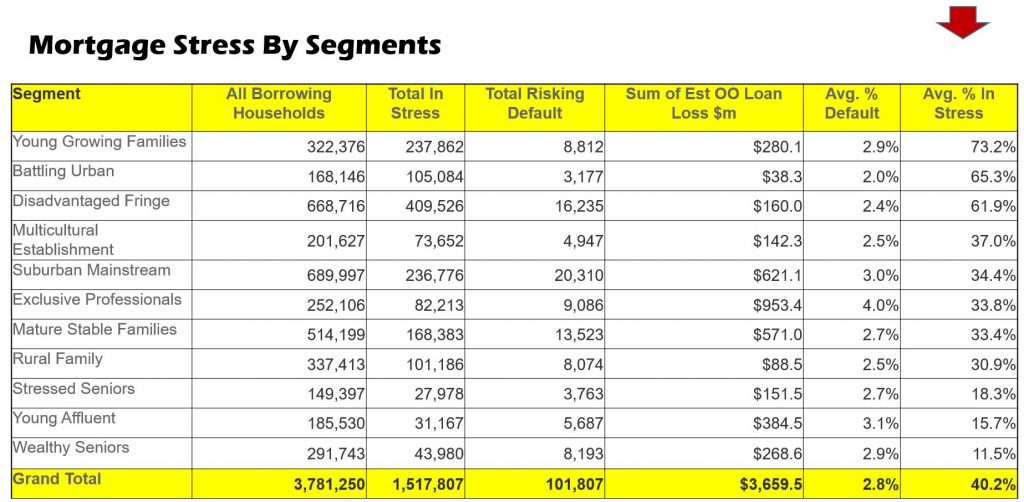
Across the segments, Young Growing Families are most exposed – this includes recent cohorts of first time buyers. Affluent households continue to be impacted, as unemployment is becoming structural. The RBA recently flagged an official rate of ~10% later in the year. The true rate is significantly higher.
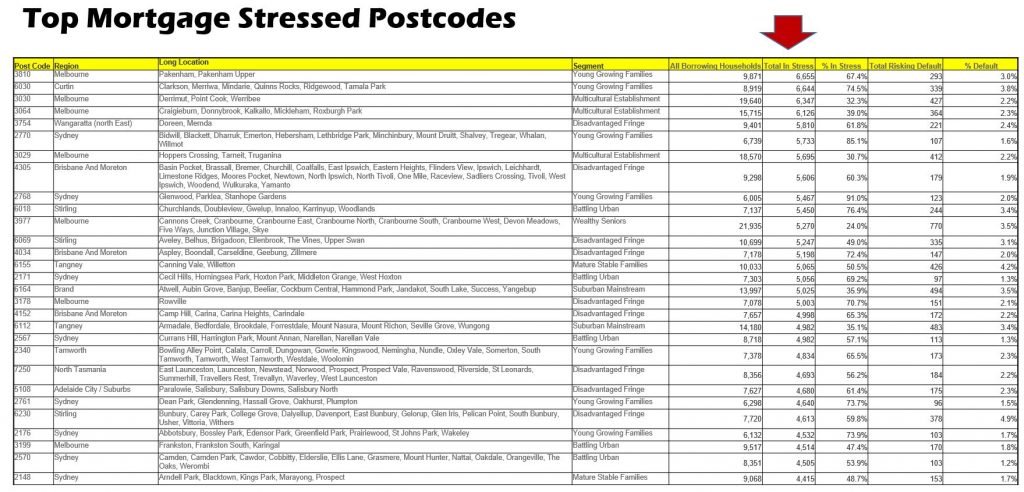
Looking in more detail at the post codes with the largest counts, many are fringe areas where there are many new estates, large houses on small lots driven by the construction boom. However a number of regional centres are also impacted. VIC is particularly exposed.
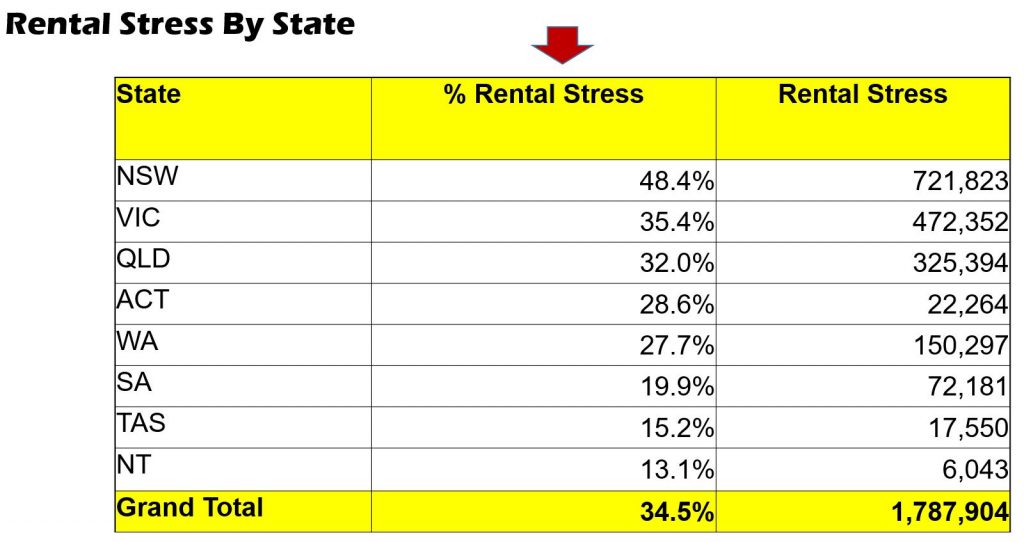
Turning to rental stress, we see a rise of tenants struggling with repayments. There is confusion for some as to whether their rents are on hold, or simply accruing. We are seeing more households planning to move back with family and friends. Stress is highest in NSW and VIC, with a significant spike in the largest states.
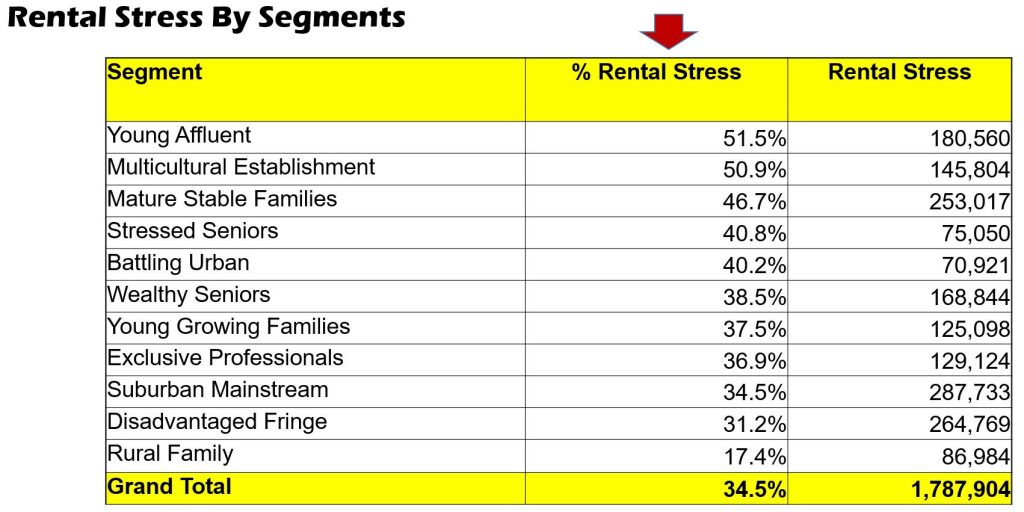
Across the segments, Young Affluent and Multicultural Groups are most exposed, linked with both students suddenly without part-time work, and the shrinking of the gig economy. However in terms of numbers of stressed renters more mainstream families are caught.
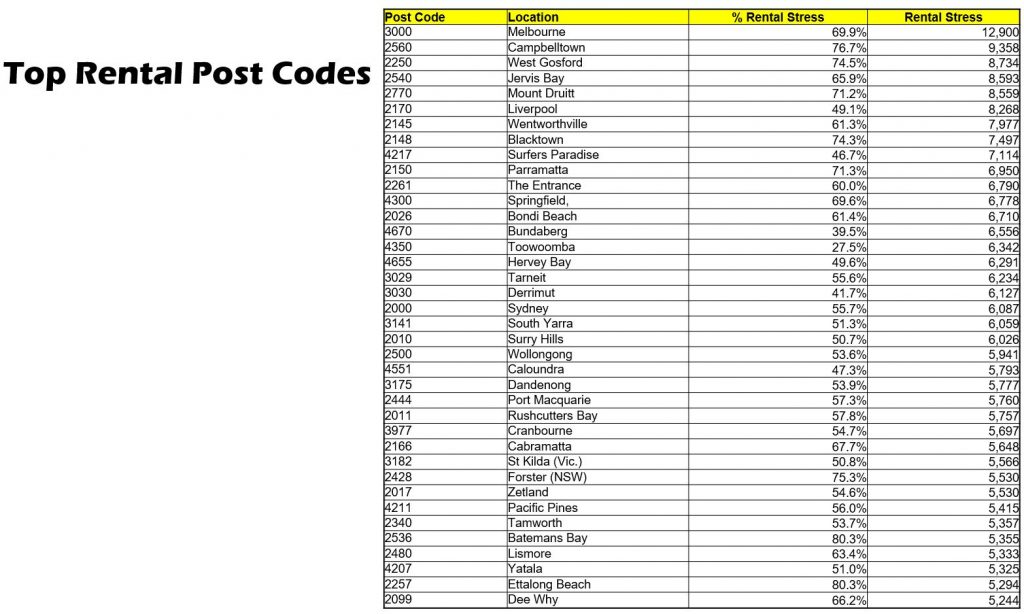
The post code distribution is illuminating, with Melbourne 3000 the standout high risk post code. Then comes both areas of Western Sydney and the Central Coast.
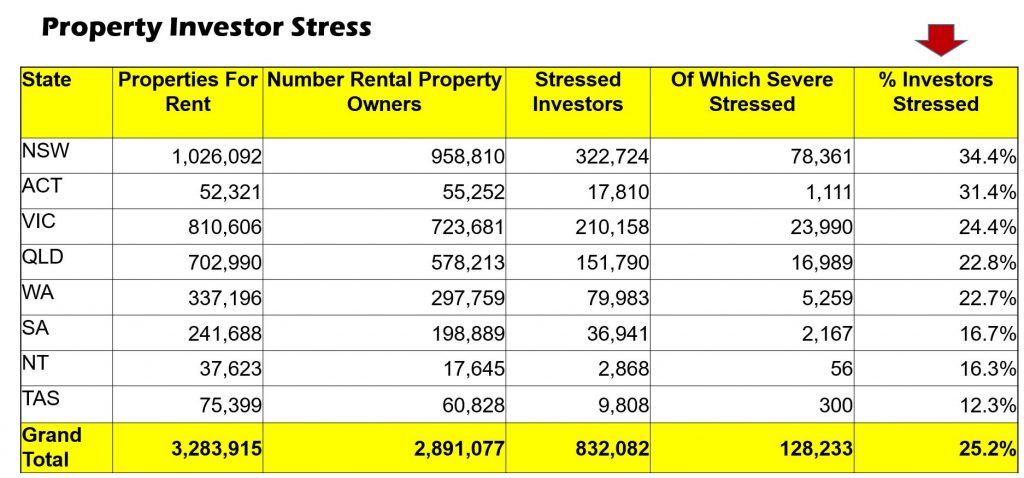
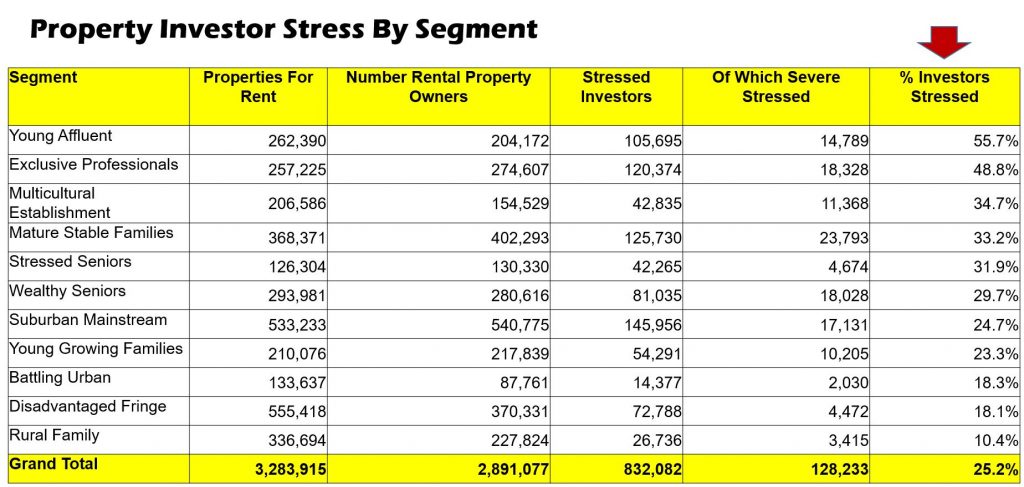
Finally turning to our latest analysis of Stressed Property Investors (based on their place of residence not where their properties are located), we see that 25% of investors are stressed, and overall 12% are actively considering selling. The highest rates of stress are in the NSW and ACT.
By segment, Young Affluent and Exclusive Professional Property Investors are the most stressed, not least because of the higher proportion of multiple investment property held. Many Young Affluents have multiple (cheaper) high-rise investments which are losing value.
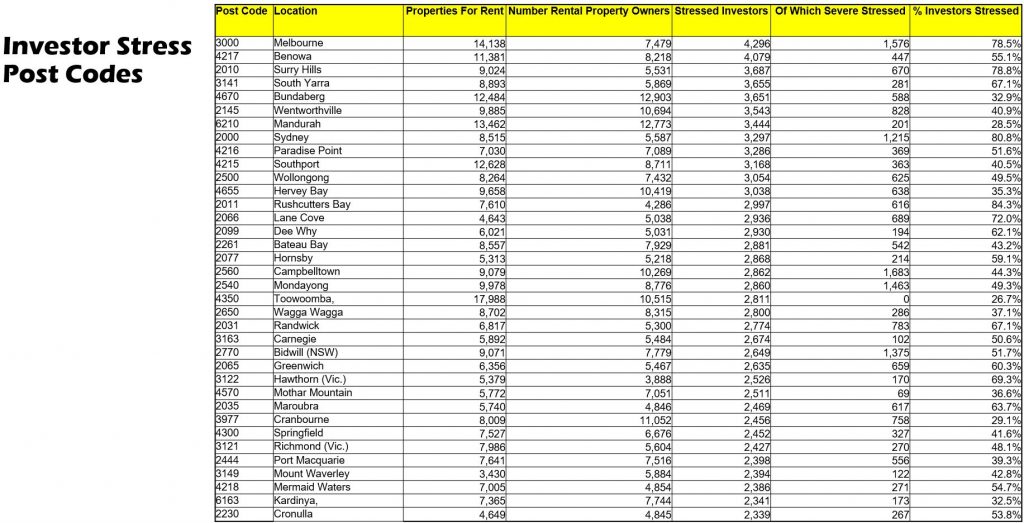
Melbourne 3000 holds the unenviable record for the highest count of stressed Investors (which may well correlate to the high rental stress). Mandurah, in WA, where prices have dropped 38% from peak appears near the top as many Investors have been in difficulty for years, and are unable to sell due to negative equity. Watch and learn….
We expect the banks to be tougher on property holders in these high risk areas, compared to others as the discussions about payment restarts after September.
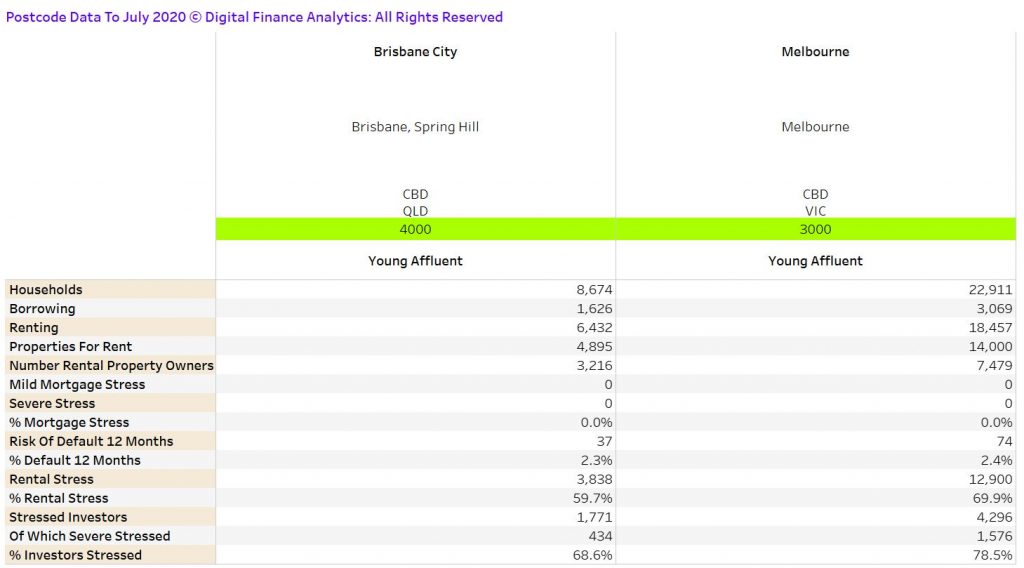
To make the point, here is the full data for 3000 and 4000. The pinch points here are clearly related to investment property.
We can provide post code level data for most locations across the country, or you can subscribe via Patreon to receive a full monthly update.
Finally, we discussed this analysis at length on our recent live stream:
This was my contribution to today’s live event which included Harry Dent and Robert Kiyosaki. I discuss my latest survey results and property and finance scenarios.
A quick reminder of a special event on Sunday. We are in unprecedented times and business as usual won’t wash. So get to hear where things stand, but also what you can do. It’s not too late to sign-up.
Note: DFA has no commercial relationship with the organisers or other participants.
You can watch my recent shows with Harry and Robert.
This is the edited show broadcast live on 19th May 2020. We discussed our latest finance and property scenarios, the latest news and also walked through our mortgage stress data for selected requested post codes.
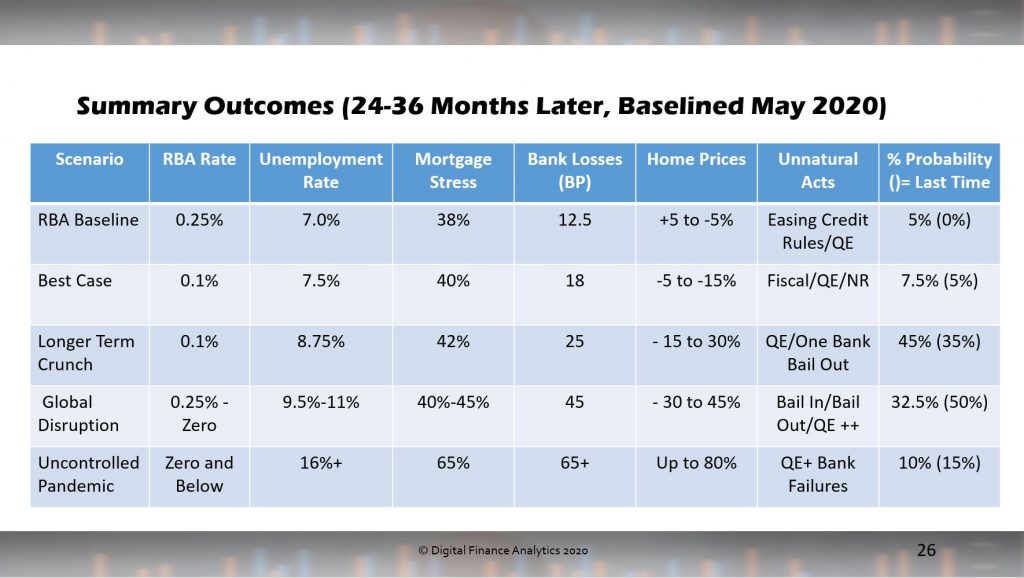
There is a path to higher home prices due to lower rates in line with the RBA market model, however it ignores availability of credit. The “Tulip” model weirdly takes little account of the credit drivers.
Most likely though unemployment will remain higher, while incomes are squeezed and so we have a stronger weighting on FALLS in property values over the next couple of years. How far they fall, and where, will be determined by how much stimulus is thrown at the economy, the migration settings and bank’s willingness to lend in a weaker employment and income environment.
You can watch the edited show here:
Note in the show we were comparing the ratios to the total household population in each post code.
The unedited original stream, with live chat is also available here:
I catch up with Harry Dent ahead of our virtual seminar next week. We discussed property and gold among other things. What is his prognosis? How might we prepare? This is not specific financial advice, just a general conversation.
Harry Dent, Robert Kiyosaki and I will all be participating in an online forum on 24th May 2020. Details here: http://harrydentlive.com/
DFA has no commercial relationship with either Robert or Harry. But at this time, this is an important conversation.
Author and Businessman Robert Kiyosaki and I discuss the upcoming financial crisis and how we might prepare.
In addition, I’m joining forces with Robert Kiyosaki and world renowned economist Harry Dent and you are invited. The 3 of us are holding an emergency livestream, titled:
The Once-in-a-Lifetime Opportunity to Make Generational Wealth From the Crash and Secure Your Future Within the Next 18 Months
Harry Dent, Robert Kiyosaki and myself will share the latest news on:
How to Safely Capture Big Gains from Sudden Shifts on Wall Street, Avoid Hidden Dangers & Capitalize On New Shifts in Our Economy
What is likely to happen as a result of the Coronavirus Pandemic and what it means for you and your financial future
How you could save your retirement and add hundreds of thousands of dollars to your nest egg
How this could be your ONE chance to catch up rapidly – and make ten times the average annual stock market gain in a single year.
What’s coming next… where the immediate opportunities are… and where to park your money for the longer term.
And much, much more…
What’s more, at this 1-day livestream – you’ll get the chance to ask Harry Dent Robert Kiyosaki and myself any questions you want!
Note that DFA has NO COMMERCIAL RELATIONSHIP with either Harry or Robert. But we all believe the decisions people take in the next few months will be life changing!
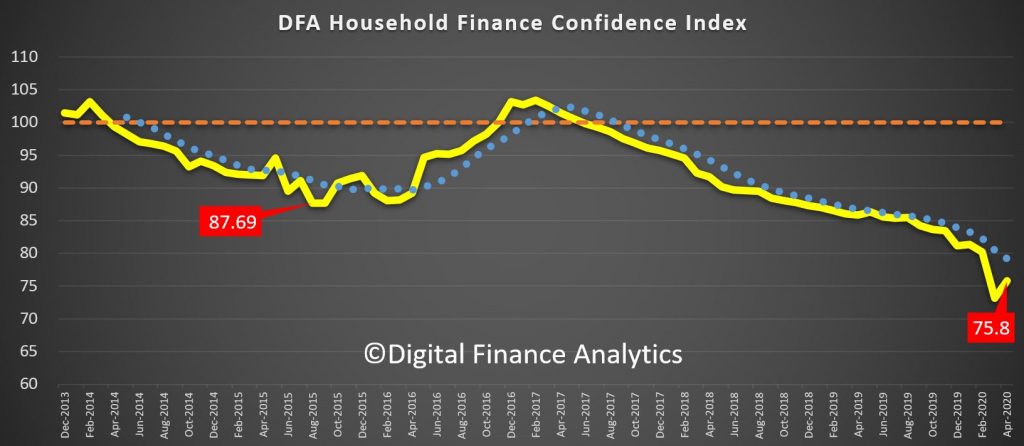
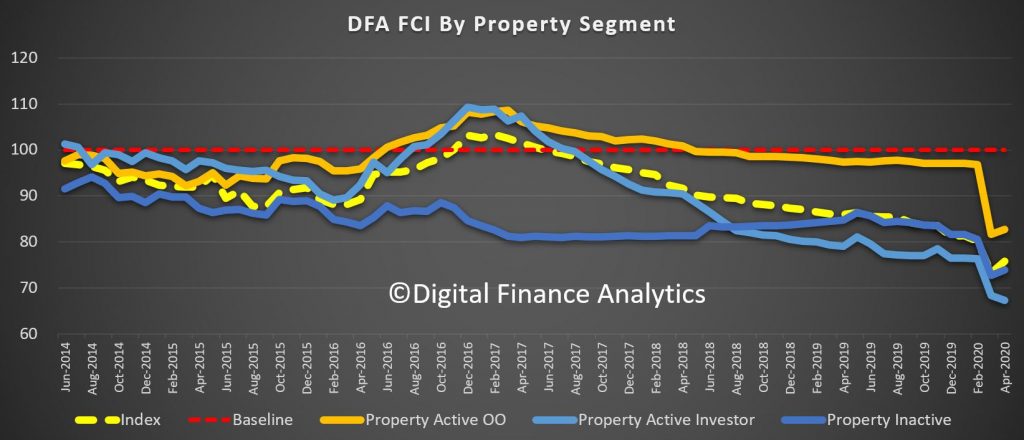
Our latest household financial confidence index improved a little in April, up from 73.2 in March to 75.8 in April. That said, it is still well below the 100 which is a neutral setting, meaning that households are extremely cautious about their finances.
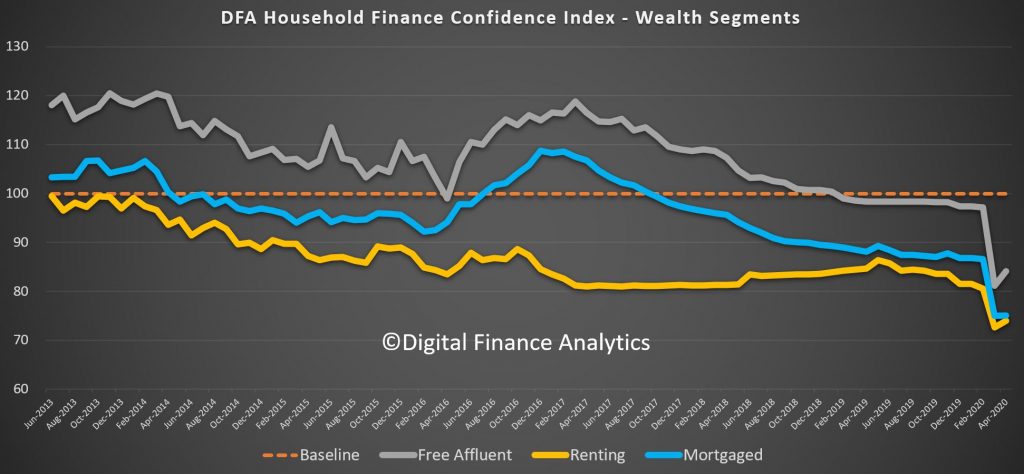
Across our wealth segments, those free affluent households recovered the most mainly thanks to the recovery in stock markets over the past month. Those renting are benefiting from falling rents (though many have income shocks to deal with) while those with a mortgage showed little evidence of a recovery in confidence, thanks to rising debt concerns.
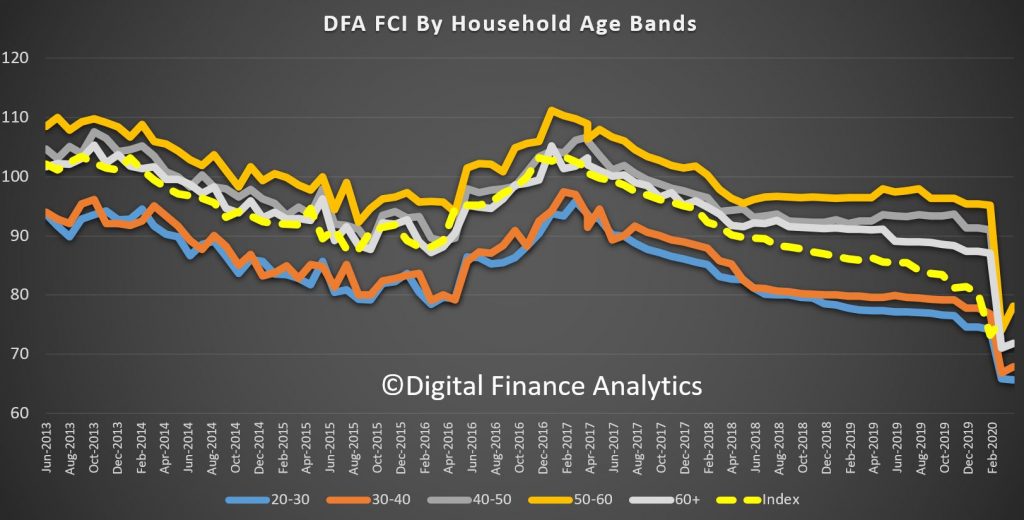
Across the age bands, those aged 50-60 showed the strongest bounce, while those aged 20-30 reported a further fall – not least because younger households tend to be more exposed to zero hour contracts, and part time employment not supported by JobKeeper.
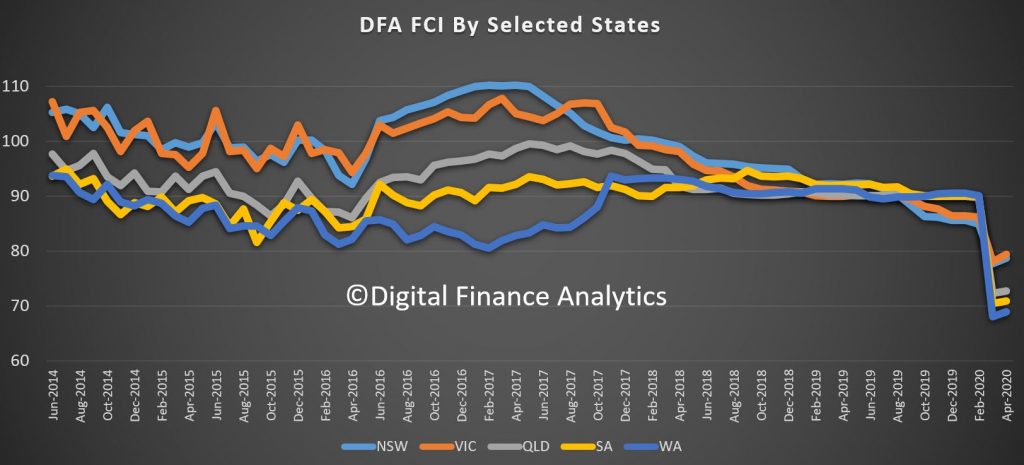
The recovery in confidence was evident across all the states, with NSW and VIC on average more positive relatively speaking than SA and WA.
Across our property segmentation, owner occupied households improved, as did those not holding property, but property investors fell again, thanks to less support from banks in terms of mortgage repayment holidays and falling rents and occupancy. Around 8% of property investors are seriously looking to sell their property if they can. More on that in a future post.
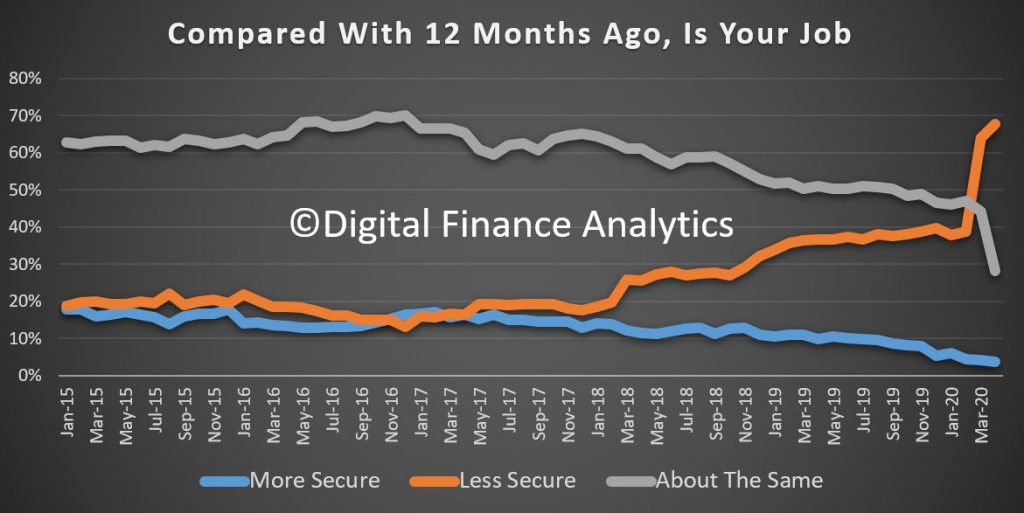
The true state of play is best shown when we look at the moving parts of the index. 67% of households now feel less secure regarding their job prospects than a year ago, a rise of 28% from last month.
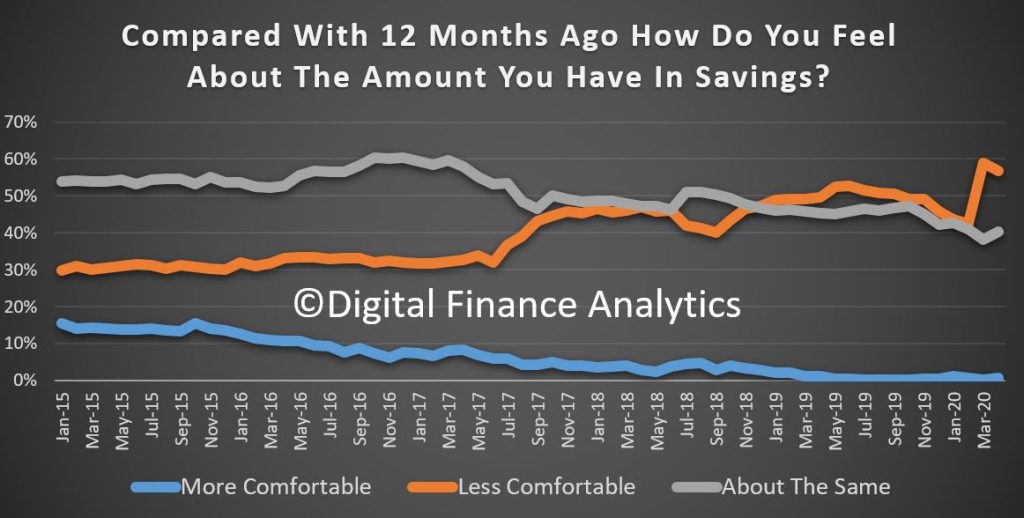
There was a 14% rise in those feeling less comfortable with their savings, to 56% of households. There was a clear intent to try to save more in the months ahead, given current economic uncertainties.
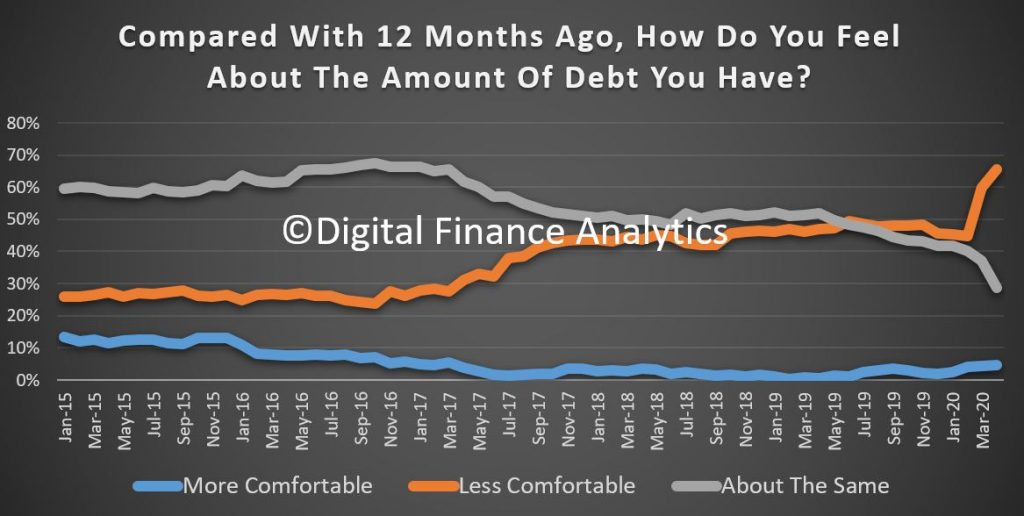
65% of households are less comfortable with their ability to service debt, a rise of more than 20% of households, this despite falling interest rates and bank support schemes. Around $160 billion of loans received some leniency from the banks, but that is a small share of the $1.7 trillion mortgage sector and the $280 billion SME sector.
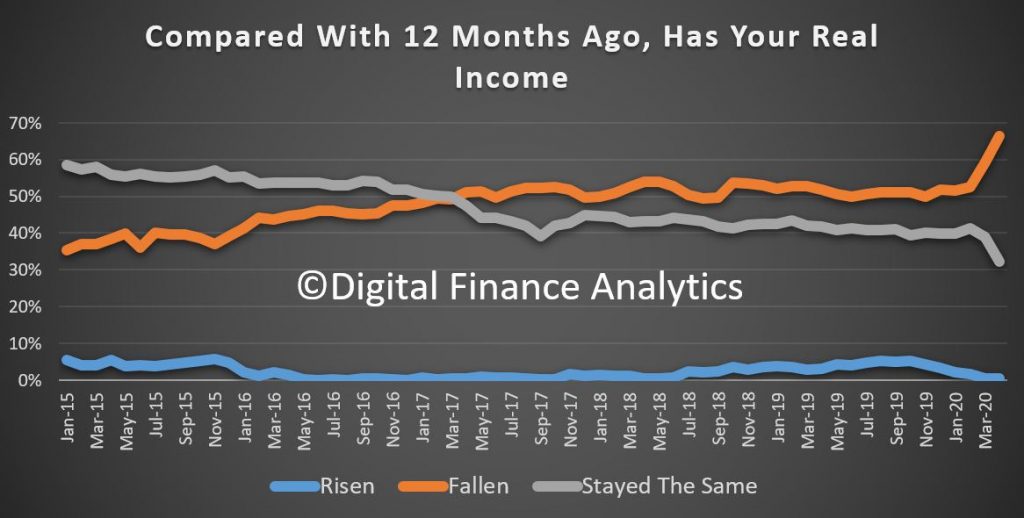
Income pressures are mounting, with 14% saying their incomes had fallen – to 66% of households, while under 1% saw any rise in income – including some who will benefit from higher incomes under JobKeeper than they would normally receive.
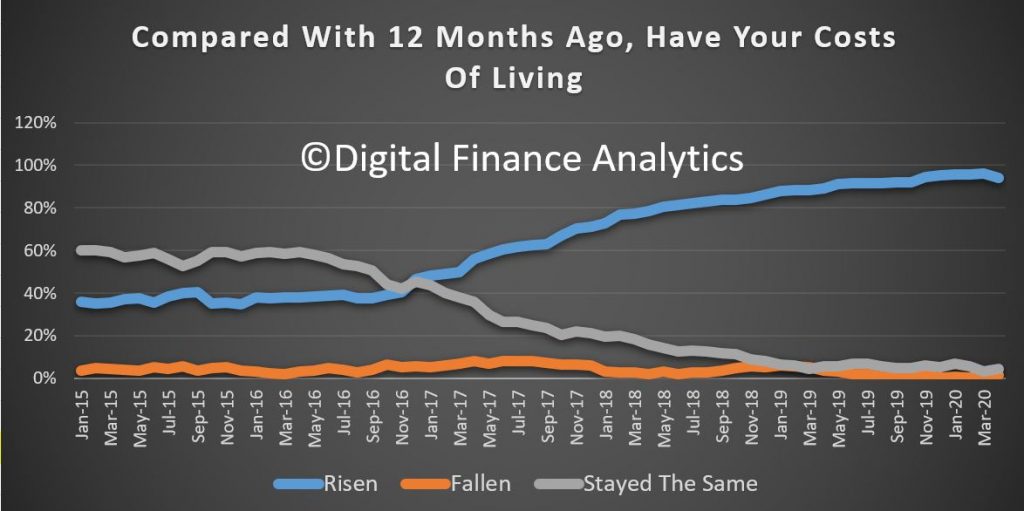
Costs of living continue to drive higher – despite the fall in oil prices – with many households incurring greater costs because they are spending more time at home. 94% said their costs were higher than a year ago.
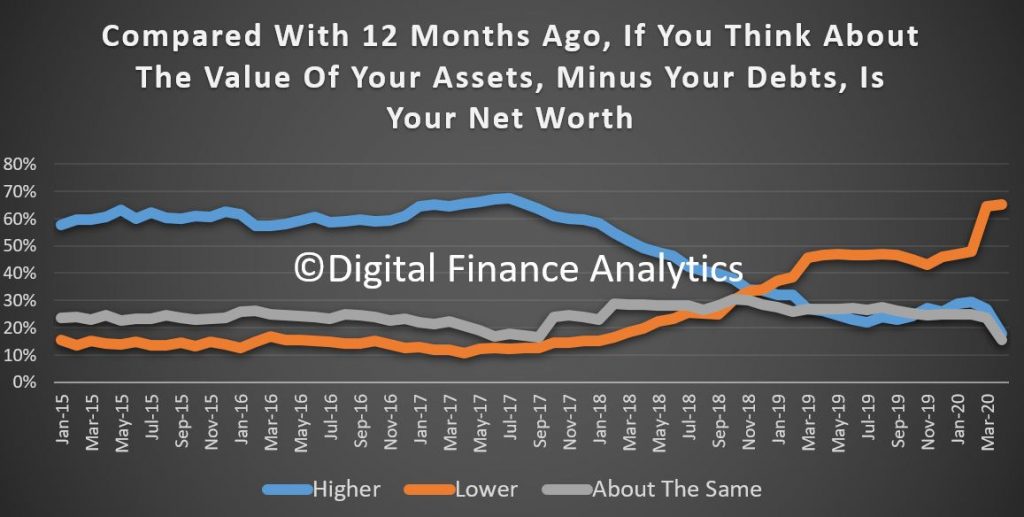
Finally, household net worth was lower for 65% of households, reflecting stock market and property price adjustments, and rising debt levels. There was a drop of 11% in households claiming net worth had risen over the past year to 18%.
So we think the longer terms impacts on households are yet to be fully understood. Certainly, our data suggests households will be cautious, as income pressures, costs of living and rising debts bite. If home prices slide further as we expect they will, then household net worth will put a further brake on the wealth effect and will also adversely impact many households. This does not suggest a V shaped recovery to me.