Household Financial Confidence Erodes Some More

The bad news keeps coming, with the latest DFA Household Financial Confidence Index for October at the lowest ever of 83.7.

This continues the trends of recent months, since dropping through the neutral 100 score in June 2017.

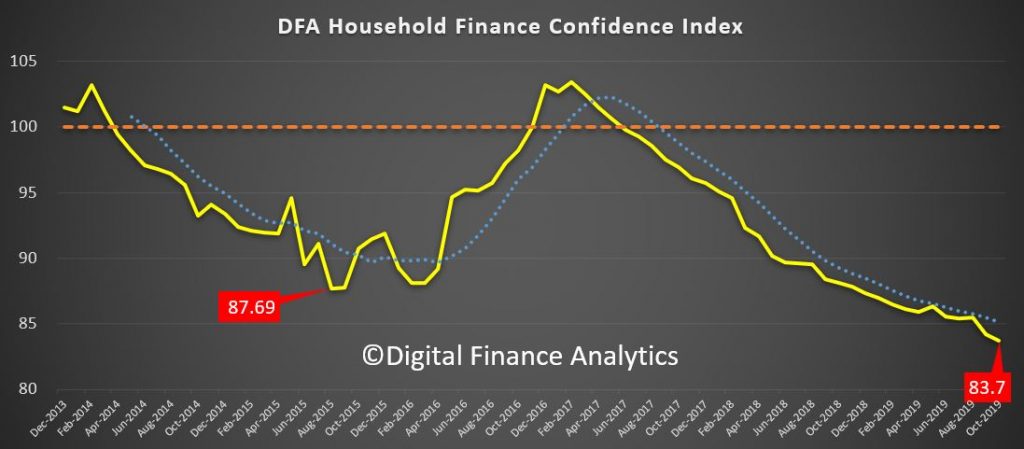
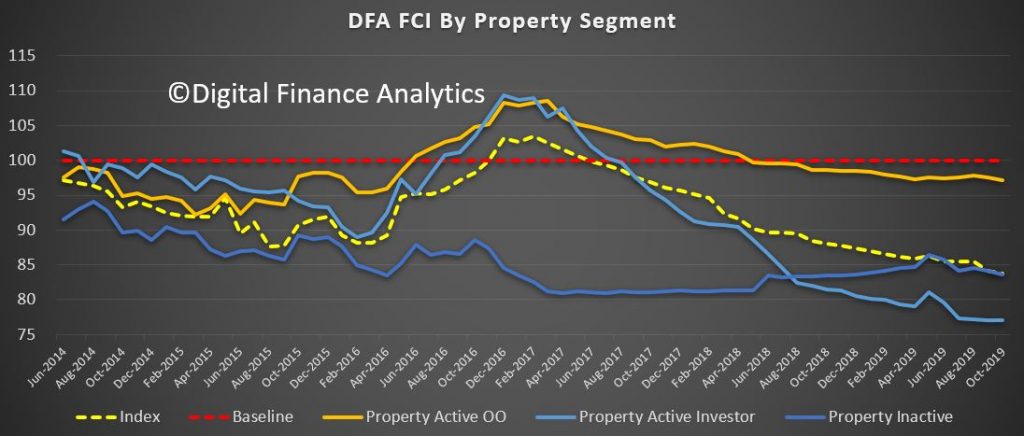
The falls were widespread across our property segments, with investors still way down, under the pressure from low net rental yields, the need to switch to principal and interest from interest only, and worries about construction defects. Owner occupied households were less negative, but those renting continue to struggle with higher levels of rental stress.

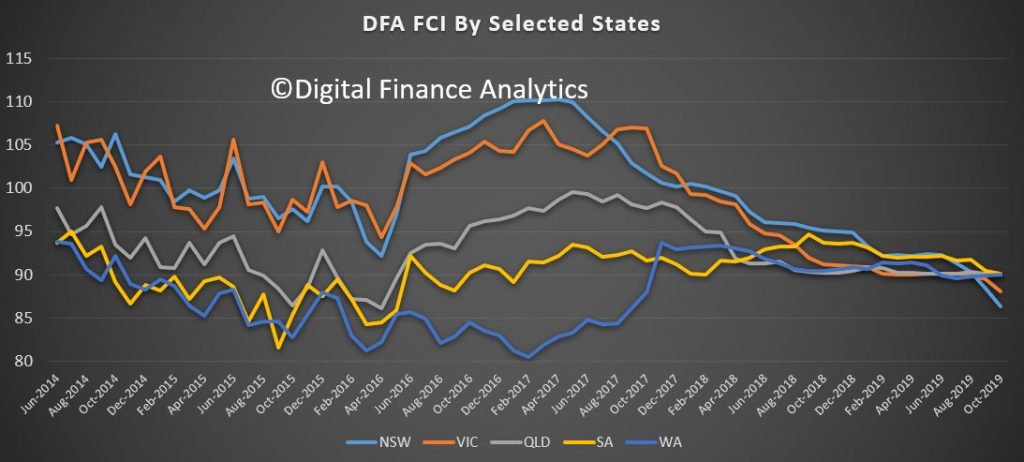
Across the states there were significant falls in NSW and VIC, whilst other states continued to track as in recent months. The main eastern states are now lower than WA and SA, which is a surprising new development.

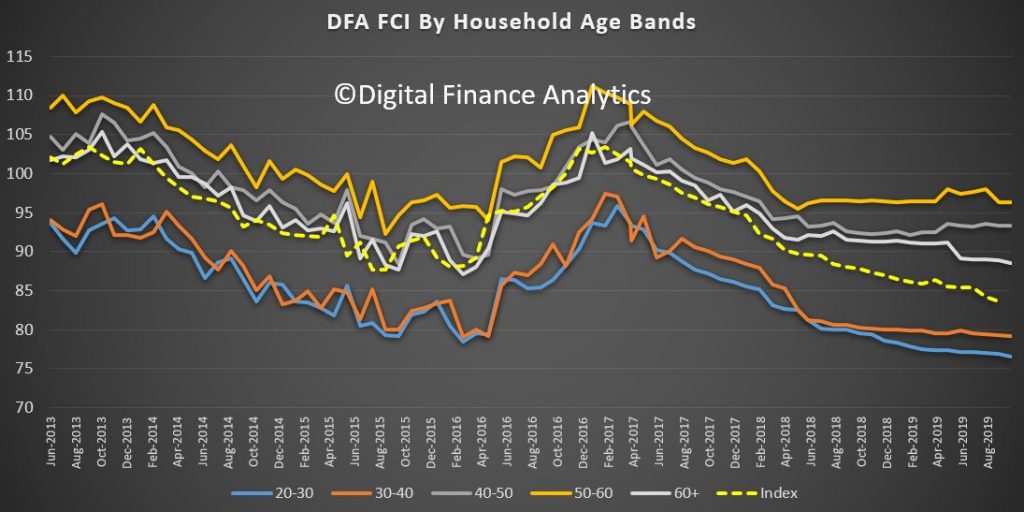
Across the age bands, the falls are mainly among lower aged groups, while those aged 50-60 are feeling more positive thanks to recent stock market rises.

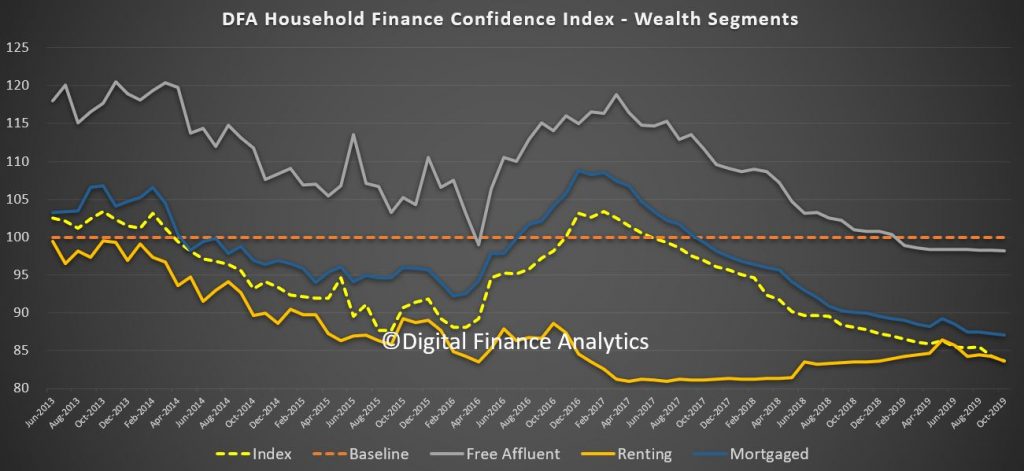
This is also reflected across our wealth segments, with those holding property mortgage free and other financial assets more positive (though still below neutral) compared with mortgage holders and those not holding property at all.

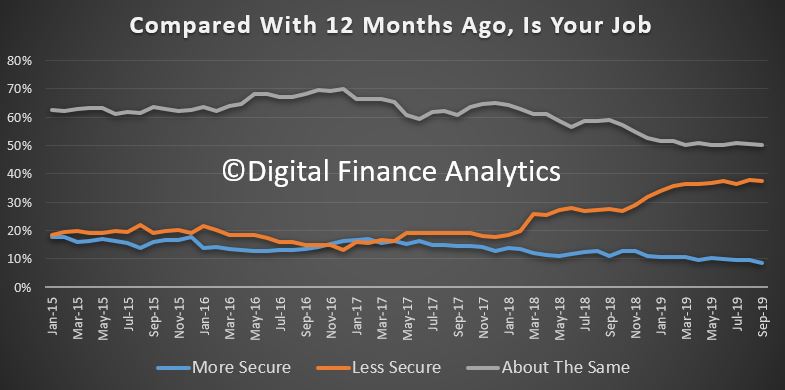
We can then turn to the moving parts within the index, based on our rolling 52,000 household surveys. Employment prospects continue to look shaky, both in terms of under-employment and job security. Jobs in retail and construction and also finance are under-pressure, and the impact of the drought is also hitting some areas. 8% of household felt more secure than a year ago, the lowest read ever in this part of the survey. More households have multiple part-time jobs.

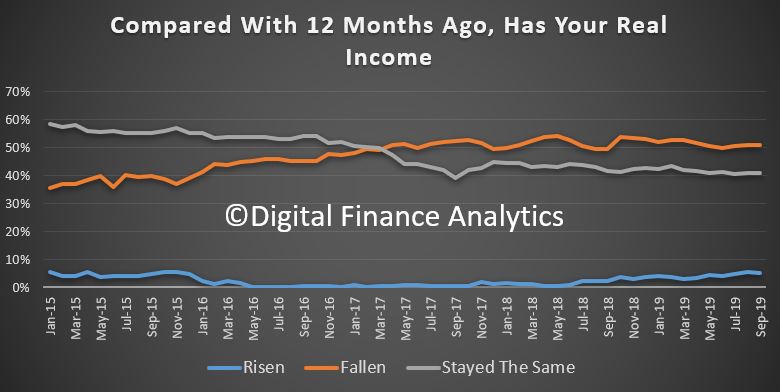
Income remains under pressure, with 51% saying their real incomes have fallen in the past year, while 5% reported an increase, often thanks to switching jobs or employers.

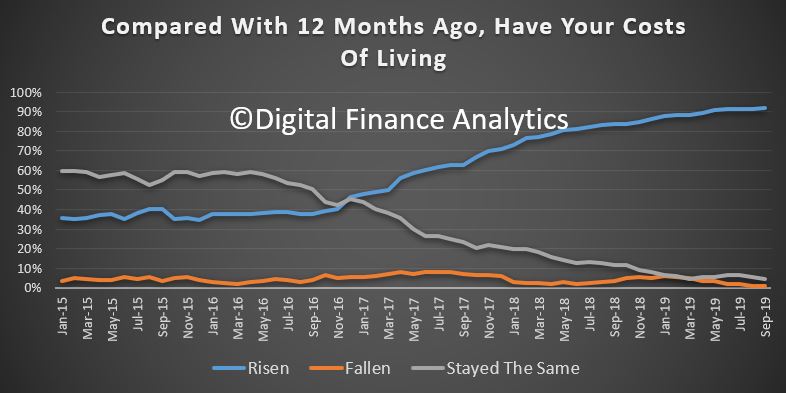
Household budgets are under pressure as costs of living rise, with 91% reporting higher real costs that a year ago, this is a record in our survey. Expenses rose across the board, from child care, health care, school fees and rates. Food costs were higher partly thanks to the drought. There was a small fall in the costs of power, and fuel, but not enough to offset rises elsewhere. Mortgage interest rate falls were blotted up quickly, and the tax refunds where they were received were much lower than people had been expecting.

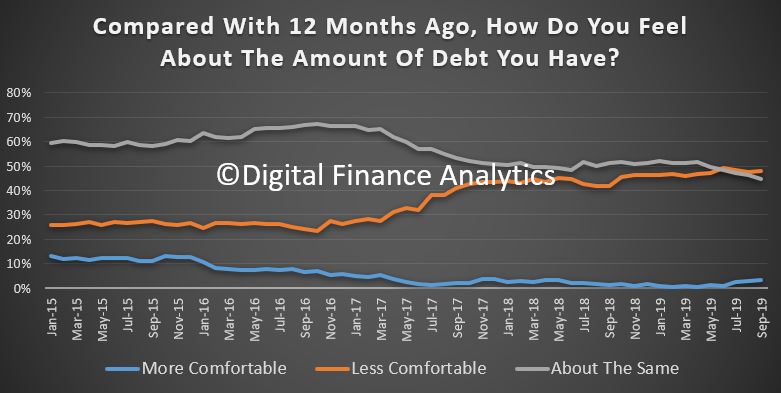
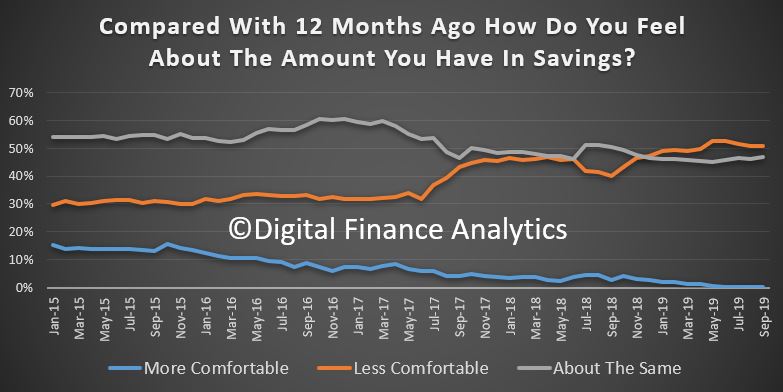
Some households are deleveraging (paying down debt) , while others are more concerned about the amount they owe from mortgages to credit cards and on other forms of credit. 48% of households are less comfortable than a year ago. Lower interest rates are only helping at the margin.

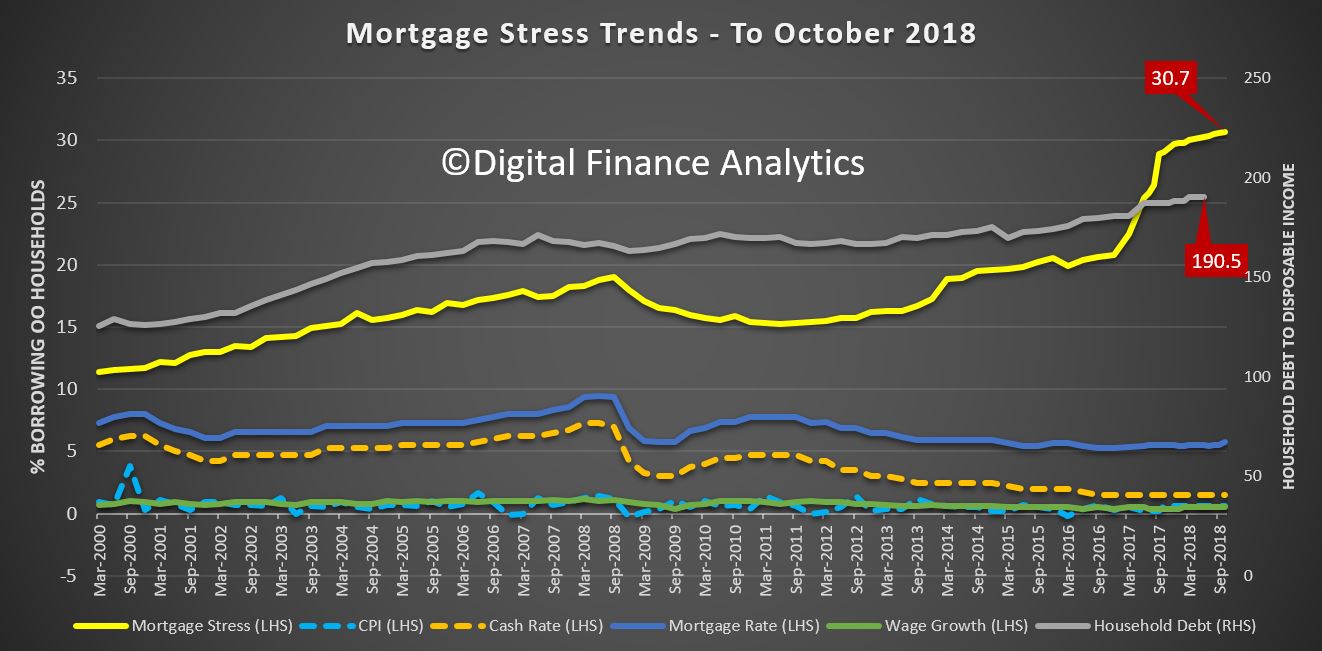
Savings are under pressure from several fronts. Some households are tapping into savings to keep the household budget in check – but that will not be sustainable. Others are seeing returns on term deposits falling away, yet are unwilling to move into higher-risk investment assets. Those in the share markets are enjoying the current bounce, but many expressed concerns about its sustainability. 49% of households are less comfortable than a year ago, while 47% are about the same. Significantly around 27% of households have no savings at all and would have difficulty in pulling $500 together in an emergency. Around half of these households also hold a mortgage. Worth reflecting on this with 32.2% of households in mortgage stress as we also reported today!

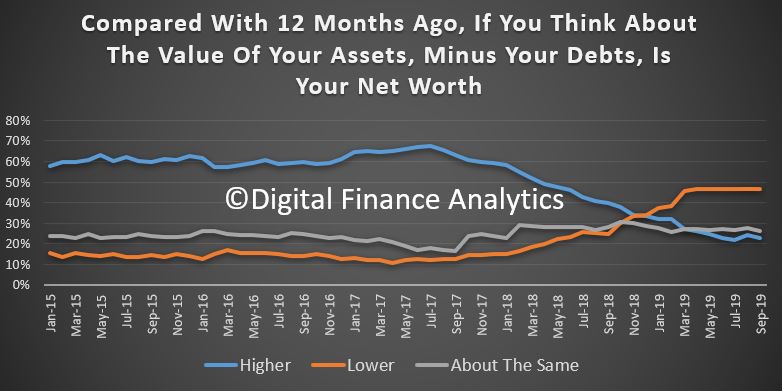
And finally, we consider net worth (assets less liabilities). Here the news is mixed as some households are now convinced their property is worth more citing the recently if narrowly sourced data on rises in Sydney and Melbourne. However other households reported net falls. 24% of households said their net financial position was better than a year ago (up 1.3%), while 45% said they were worse off (down 1.6%). There are also significant regional differences with households in Western Australia and Queensland significantly worse off, while some in inner city areas of Sydney and Melbourne claimed significant advances.

So, overall the status of household confidence continues to weaken, which is consistent with reduced retail activity, and a focus on repaying debt. Unemployment is lurking, but underemployment is real. We also see weaker demand for mortgages ahead, and we will discuss this in more detail in our upcoming household survey release. Without significant economic change, these trends are likely to continue for some time. If the RBA and Government is relying on households to start spending, they will need a very different strategy – including a significant fiscal element. Lower interest rates alone will not cut the mustard.

Yes, But What About Deposit Insurance?

Following on from our show on Deposit Bail-In, we discuss the Deposit Insurance arrangements in Australian and New Zealand.

What happens in a “gone” situation?

https://www.rba.gov.au/publications/bulletin/2011/dec/pdf/bu-1211-5.pdf

https://www.fcs.gov.au/are-your-savings-protected

https://www.moneysmart.gov.au/managing-your-money/banking

https://treasury.govt.nz/publications/resource/questions-and-answers-phase-2-review-reserve-bank-act-second-round-consultation

A Long View Of The Australian Economy

Kudos to Stephen Long from the ABC for an accurate and thoughtful piece on the state of the economy “How a consumer go-slow and a pile of debt is killing the economy“.

I am not just saying this because I featured in the article and news segment on the ABC last night, but because he hits the nail on the head.

In the face of the undeniable weakness, Mr Frydenberg has not dropped the reference to a “strong” economy, instead describing it as “resilient”.

That’s a fair call; a world-record 28 years without a recession is evidence enough

Australia’s weathered the Asian financial crisis of the 1990s, the tech wreck of the 2000s, and the Global Financial Crisis a decade ago without succumbing. But that record has involved some sound management and a lot of luck.

At some stage, the luck will run out.

Alongside spluttering economic growth and households hunkering down at home, a series of risks lurk offshore — a bad Brexit, the US-China trade war, underlying problems in the Chinese economy blowing up among them.

“Any one of those could play us into a GFC 2.0,” says Mr North.

“And if that happens then essentially all bets are off.”

“We are going to see very high levels of unemployment, we’re going to see a lot of households defaulting on their mortgages and that would have a spillover effect on the economy. That would hit the banks and take us into a very dark corner, in my view.”

In recent times, it’s only been population growth that’s kept Australia out of recession. More people have created more demand but high immigration has also helped to suppress wages.

While the pie’s been growing larger, the slices have been getting smaller (leaving aside the distribution of the pie, which is skewed towards those at the top).

Per head, living standards have fallen — a phenomenon that’s been dubbed a “per capita recession”.

The government and the RBA will be banking on the tax cuts which commenced in July and interest rate cuts to lift the economy out of the doldrums. If we’re lucky, things may start to turn around.

But if the luck runs out, there could be far worse to come.

Mortgage Stress Climbs Again in October

We have completed our October 2018 mortgage stress analysis and today we discuss the results.

The latest RBA data on household debt to income to June reached a new high of 190.5.  This high debt level helps to explain the fact that mortgage stress continues to rise. Having crossed the 1 million Rubicon last month, across Australia, more than 1,008,000 households are estimated to be now in mortgage stress (last month 1,003,000). This equates to 30.7% of owner occupied borrowing households.

 In addition, more than 22,000 of these are in severe stress. We estimate that more than 61,000 households risk 30-day default in the next 12 months. We continue to see the impact of flat wages growth, rising living costs and higher real mortgage rates.  Bank losses are likely to rise a little ahead.

Our analysis uses the DFA core market model which combines information from our 52,000 household surveys, public data from the RBA, ABS and APRA; and private data from lenders and aggregators. The data is current to the end of October 2018. We analyse household cash flow based on real incomes, outgoings and mortgage repayments, rather than using an arbitrary 30% of income.

Households are defined as “stressed” when net income (or cash flow) does not cover ongoing costs. They may or may not have access to other available assets, and some have paid ahead, but households in mild stress have little leeway in their cash flows, whereas those in severe stress are unable to meet repayments from current income. In both cases, households manage this deficit by cutting back on spending, putting more on credit cards and seeking to refinance, restructure or sell their home.  Those in severe stress are more likely to be seeking hardship assistance and are often forced to sell.

This rise in stress, which has continued for the past 6 years, should be of no surprise at all.  “Continued rises in living costs – notably child care, school fees and fuel – whilst real incomes continue to fall and underemployment is causing significant pain. Many are dipping into savings to support their finances.”

Indeed, the fact that significant numbers of households have had their potential borrowing power crimped by lending standards belatedly being tightened, and are therefore mortgage prisoners, is significant. More than 40% of those seeking to refinance are now having difficulty. This is strongly aligned to those who are registering as stressed.  These are households urgently trying to reduce their monthly outgoings.

Probability of default extends our mortgage stress analysis by overlaying economic indicators such as employment, future wage growth and cpi changes.  Our Core Market Model also examines the potential of portfolio risk of loss in basis point and value terms. Losses are likely to be higher among more affluent households, contrary to the popular belief that affluent households are well protected.  This is shown in the segment analysis, with some more wealthy households up against it.

Regional analysis shows that NSW has 272,536 households in stress (276,132 last month), VIC 281,922 (276,926 last month), QLD 178,015 (176,528 last month) and WA has 132,827 (132,700 last month). The probability of default over the next 12 months rose, with around 11,630 in WA, around 11,300 in QLD, 15,200 in VIC and 16,200 in NSW.  The largest financial losses relating to bank write-offs reside in NSW ($1.1 billion) from Owner Occupied borrowers) and VIC ($1.74 billion) from Owner Occupied Borrowers, though losses are likely to be highest in WA at 3.6 basis points, which equates to $1,096 million from Owner Occupied borrowers.

Turning to the post codes with the largest counts of households in stress, fifth was Melbourne suburb Berwick and Harkaway, 3806, with 5,267 households in stress and 143 risking default.

In fourth place is Toowoomba and the surrounding area, in Queensland, 4350, with 6,437 households in stress and 256 risking default.

Next in third place is Campbelltown in NSW, 2560, with 6,781 households in stress and 110 risking default.

In second place is Tapping and the surrounding areas in WA, 6065 with 7,409 in stress and 298 risking default

And in first place, the post code with the largest number of households in mortgage stress this month is the area around Chipping Norton and Liverpool, 2170, with 7,732 households in stress and 116 risking default.

As always, it’s worth saying that given flat incomes, and rising costs, and some mortgage rate rises, the pressure will continue, and falling home prices will make things worse. Many people do not keep a cash flow, so they do not know their financial position – drawing one up is the first step and ASIC has some excellent advice on their MoneySmart website. And the other point to make is, if you are in financial distress, you should talk to your lender, they do have an obligation to help in cases of hardship. The worst strategy is simply to ignore the issue and hope it will go away. But in my experience, this is unlikely.

We will update the data again next month.

You can request our media release. Note this will NOT automatically send you our research updates, for that register here.

[contact-form to=’mnorth@digitalfinanceanalytics.com’ subject=’Request The October 2018 Stress Release’][contact-field label=’Name’ type=’name’ required=’1’/][contact-field label=’Email’ type=’email’ required=’1’/][contact-field label=’Email Me The October 2018 Media Release’ type=’radio’ required=’1′ options=’Yes Please’/][contact-field label=”Comment If You Like” type=”textarea”/][/contact-form]

Note that the detailed results from our surveys and analysis are made available to our paying clients.

Are US Rates Going Higher?

The 10-Year US Bond yield is moving higher.  This is important because it has a knock-on effect in the capital markets and so Australian Bank funding costs, potentially putting upward pressure on mortgage rates.

Whilst the US Mortgage rates were only moderately higher today, the move was enough to officially bring them to the highest levels since the (Northern) Spring of 2017.

So this piece from Moody’s is interesting.  Is the markets view that rates won’t go higher credible?

Earnings-sensitive securities have thrived thus far in 2018. Not only was the market value of U.S. common stock recently up by 4.5% since year-end 2017, but a composite high-yield bond spread narrowed by 23 basis points to 336 bp. The latter brings attention to how the accompanying composite speculative-grade bond yield fell from year-end 2017’s 5.82% to a recent 5.72% despite the 5-year Treasury yield’s increase from 2.21% to 2.39%, respectively.

Thus, the latest climb by the 10-year Treasury yield from year-end 2017’s 2.41% to a recent 2.62% is largely in response to the upwardly revised outlook for real returns that are implicit to the equity rally and the drop by the speculative-grade bond yield. The 10-year Treasury yield is likely to continue to trend higher until equity prices stagnate, the high-yield bond spread widens, interest-sensitive spending softens, and the industrial metals price index establishes a recurring slide. In view of how the PHLX index of housing sector share prices has risen by 4.5% thus far in 2018, investors sense that home sales will grow despite the forthcoming rise by mortgage yields.

Moreover, increased confidence in the timely servicing of home mortgage debt has narrowed the gap between the 30-year mortgage yield and its 10-year Treasury yield benchmark from the 172 bp of a year earlier to a recent 152 bp. The latter is the narrowest such difference since the 150 bp of January 2014, which roughly coincided with a peaking of the 10-year Treasury yield amid 2013-2014’s taper tantrum.

Do suppliers of credit to the high-yield bond market and mortgage market correctly sense an impending top for benchmark Treasury yields? If they are wrong and the 10-year Treasury yield quickly climbs above its 2.71% average of the six-months-ended March 2014, they will regret having acquiesced to the atypically thin spreads of mid-January 2018.

Household Debt Burden Rises Once Again – RBA

The RBA has updated its E2 Household Finances Selected Ratios to June 2017. As a result, we see another rise in the ratio of household debt to income, and housing debt to income. Both are at new record levels.

In addition, we see the proportion of income required to service these debts rising, as out of cycle rates rises hit home. These ratios are below their peaks in 2011, when the cash rate was higher, but it highlights the risks in the system should rates rise.

We discuss this further in our September Mortgage Stress Data, to be released shortly.  The debt chickens will come home to roost!

But the policy settings are wrong, debt cannot continue to grow at more than three times cpi or wage growth.


More Evidence Of Households In Financial Stress

A new report released today by the Centre for Social Impact, in partnership with NAB explores the complex reasons why many Australians are facing increasing financial stress. Financial Resilience in Australia 2016 builds on the 2015 report to show that while people are more financially aware, savings are shrinking and economic vulnerability is on the rise.

The overall level of financial resilience in Australia decreased between 2015 to 2016. In 2016, 2.4 million adults were financially vulnerable and there was a significant decrease in the proportion who were financially secure (35.7% to 31.2%).

Looking at the components of financial resilience, between 2015 and 2016: the mean level of economic resources did not significantly change and, in good news, people’s levels of financial knowledge and behaviour significantly increased.

However, people’s levels of access to external resources – financial products and services and social capital – significantly decreased and while savings behaviours were up, the amount of savings people have to rely upon has gone down.

Economic resources: stayed the same overall but there are concerns about savings markers.

  • On average, adults in Australia were better able to access funds in an emergency in 2016 (77.6% in 2015 to 81.4% in 2016). But almost 1 in 5 still could not, or did not know if they could raise $2,000 in a week and this rate was worse than findings by the ABS in 2014 (when approximately 1 in 8 were not able to find money in an emergency).
  • Of those who reported they could raise $2,000 in an emergency, 70.7% would do so through family or friends demonstrating the importance of social capital.
  • While more people were saving in 2016 compared to 2015, less money was being saved relative to people’s income. Almost one in three (31.6%) adults had no savings or were just two pay packets (<1 month of savings) away from serious financial stress if they were to lose their jobs. Like in 2015, almost 1 in 2 reported having less than three months of income saved (46.6 and 45.5% respectively).

Financial products and services: access has gotten worse

  • People were more likely to report having no access to any form of credit in 2016 (25.6%) compared to 2015 (20.2%) and no form of insurance (11.8% in 2016 compared to 8.7% in 2015).
  • A higher proportion of people reported having access to credit through fringe providers in 2016 (5.4%) compared to 2015 (1.7%).
  • There were no differences in the reported level of unmet need for credit overall, between 2015 (3.8%) and 2016 (3.7%). However, 1 in 10 reported having an unmet need for more insurance (10.0% compared to 9.7% in 2015) and an additional 11.6% (compared to 6.4% in 2015) did not know if they needed more insurance.

Financial knowledge and behaviour: has improved

  • Adults in Australia reported having a higher level of both understanding of and confidence using financial products and services in 2016 than in 2015. In 2016, 5.5% reported having no confidence using financial products and services and 4.5% reported no understanding at all, compared to 8.2% and 9.2% respectively in 2015.
  • There was a positive change in the population’s reported approach to seeking financial advice, with more people reported seeking advice at the time of the survey (7.8% in 2016 compared to 4.8% in 2015).
  • More people reported saving regularly in 2016 (60.2%) compared to 2015 (56.4%).

Social capital: has decreased

  • Although social capital overall decreased between 2015 and 2016, more people reported having regular contact with their social connections (68% compared to 36.6%).
  • A lower proportion of the population reported needing community or government support in 2016.
  • However, the proportion of people reporting a need for support but no access to it grew from 3.2% in 2015 to 5.3% in 2016.

Who is doing better? Who is faring worse?

  • Income, educational attainment and employment were all positively associated with financial security
  • Established home owners were also more likely to be financially secure, while people living in very short-term rentals were more likely to be in severe financial stress.
  • Younger people under 35 years of age were less likely than other age groups to experience financial security.
  • A higher proportion of people born in a non-English speaking country were in the severe and high financial stress categories, than people born in an English-speaking country, including Australia.
  • Mental illness was also negatively correlated to financial security, with a higher proportion of people with a mental illness experiencing severe or high financial stress (44.7% compared to 9.3% of people with no mental illness).

The Centre for Social Impact (CSI) is a national research and education centre dedicated to catalysing social change for a better world. CSI is built on the foundation of three of Australia’s leading universities: UNSW Sydney, The University of Western Australia, and Swinburne University of Technology.