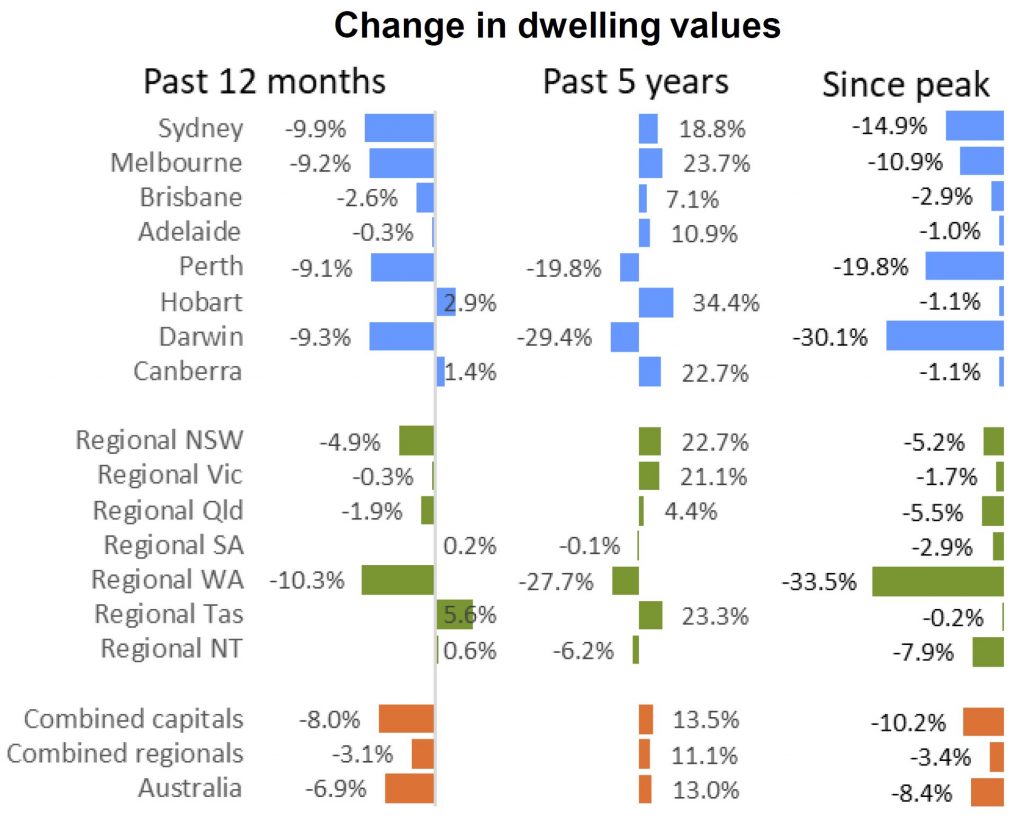
CoreLogic reported a 0.2 per cent fall in national dwelling values, the smallest month-on-month decline in the national series since March 2018, according to their June Home Value Index .
On a quarterly basis, every capital city housing market has recorded a drop in value, highlighting the broad geographic scope of this housing market downturn. Annually, the average fall is 6.9%, but regional WA is down one third from peak 5 years back and Darwin down 30.1%, thanks to the wider economic downturn there.
Sydney and Melbourne dwelling values have recorded their first monthly rise since 2017 with Melbourne values increased 0.2 per cent across the past month, while there was 0.1 per cent growth in Sydney.
According to CoreLogic head of research Tim Lawless, the
June results presented an early sign that lower mortgage rates and
improved sentiment were already having a flow-on effect for housing
market conditions in Sydney and Melbourne, while most other regions of
Australia continued to show relatively soft housing market outcomes.
“The subtle rate of decline was heavily influenced by trends across
Sydney and Melbourne where the pace of falling home values has been
consistently reducing over the year to date,” he said.
“Importantly, the improving conditions through to mid- May were
largely ‘organic’, pre-dating the positive boost in sentiment following
the federal election and interest rate cuts in early June.”
The only other regions to record a rise in housing values over the
month were Hobart (+0.2 per cent), as well as the regional areas of
South Australia (+0.1per cent) and Northern Territory (+0.2 per cent).
The largest falls over the past three months were recorded in Darwin
(-3.6 per cent) and Perth (-2.1 per cent) where the weaker trend has
persisted since mid-2014.
Adelaide recorded the smallest decline amongst the capitals over the quarter, with values down 0.4%.
Across the regional markets, values were 0.4% lower over the month to be down 3.1% for the financial year.
Dwelling values recorded a rise over the June quarter in Regional
South Australia (+0.6 per cent) and Regional Tasmania (+1.3 per cent).
Mr Lawless said although these areas have recorded modest gains over
the quarter, the trend across the regional areas of Australia is
generally “one that is losing momentum”.
We ran our regular live Q&A event last night, and had the biggest audience ever (thanks to all those who took part).
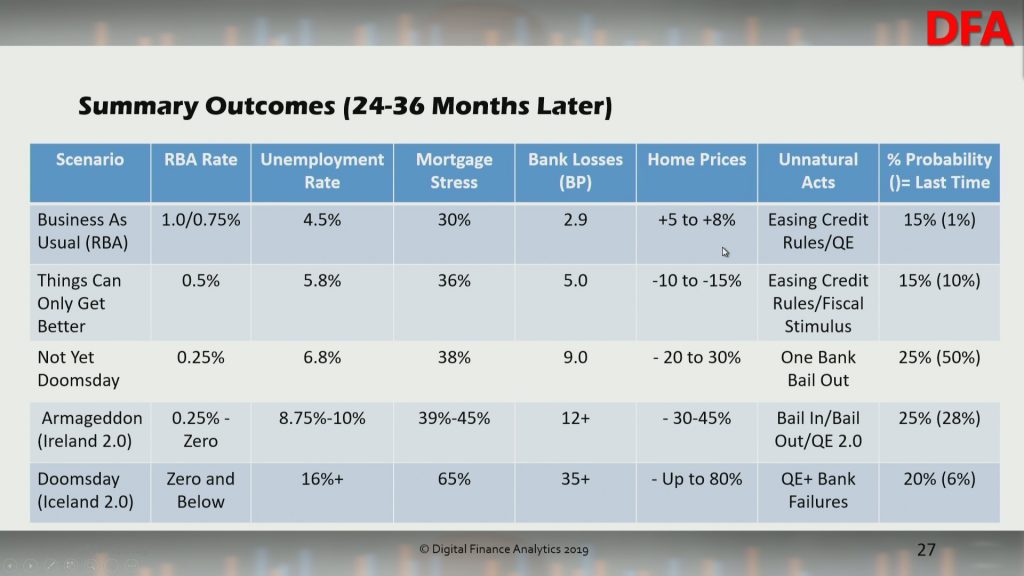
During the show we discussed the latest data from the RBA, ABS and Moody’s, and our updated scenarios. In the current “risk-on” environment, and with the RBA’s pivot to lower rates, QE and lifting the money supply incorporated into our modelling, plus the heightened international risk profiles; there are some big changes to our scenarios.
Given the RBA (and the FED) have flipped to more QE, the future could play out a number of ways over the next 2-3 years. Indeed, if the RBA does get unemployment down to 4.5%, it is possible home prices will be higher by then.
We are expecting a small bounce, but then further falls in home prices as the broader economy weakens, and the risks from an international crisis rise further. But remember average rises or falls mask significant variations. We discuss specific examples on the show where prices have already dropped more than 30%.
You can watch the edited version of the show and our rationale for the scenario revision.
Alternatively, the original stream, including the live chat replay is available.
And we also included a view behind the scenes during the session.
Residential property prices fell 3.0 per cent in the March quarter 2019, according to figures released today by the Australian Bureau of Statistics (ABS).
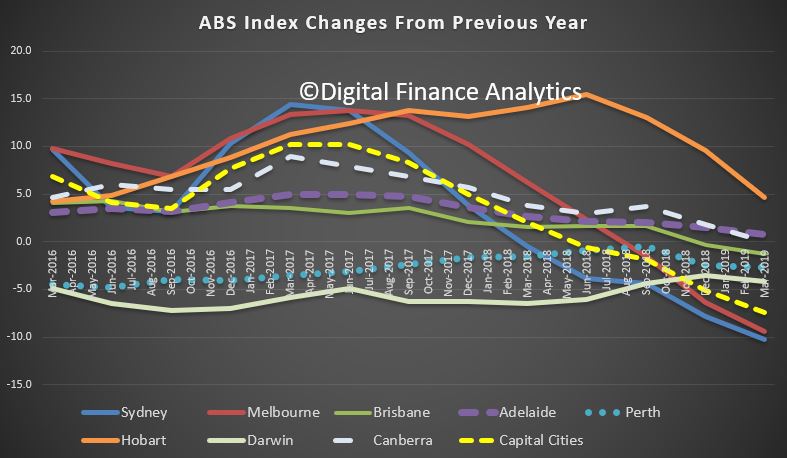
Through the year growth in property prices fell 10.3 per cent in Sydney and 9.4 per cent in Melbourne. Adelaide (0.8 per cent) and Hobart (4.6 per cent) are the only capital cities recording positive through the year growth.
All capital cities recorded falls in property prices in the March quarter 2019, with the larger property markets of Sydney (-3.9 per cent) and Melbourne (-3.8 per cent) continuing to observe the largest falls.
In the March quarter 2019, property prices in Adelaide (-0.2 per cent) and Hobart (-0.4 per cent) recorded their first falls since March quarter 2013 and September quarter 2012 respectively. Falls were also recorded in Brisbane (-1.5 per cent), Perth (-1.1 per cent), Canberra (-0.9 per cent) and Darwin (-1.8 per cent).
ABS Chief Economist, Bruce Hockman said: “These results are in line with soft housing market indicators, with sales transactions and auction clearance rates lower than one year ago, and days on market trending higher.”
“A continuation of tight credit supply and reduced demand from investors and owner occupiers has contributed to weakness in property prices in all capital cities this quarter,” he said.
The total value of Australia’s 10.3 million residential dwellings fell by $172.7 billion to $6.6 trillion in the March quarter 2019. The mean price of dwellings in Australia is now $636,900. The total value of residential dwellings has fallen for four consecutive quarters, down from $6,957.2 billion in the March quarter 2018. The mean price of residential dwellings has now fallen for five consecutive quarters, down from $689,700 in the December quarter 2017.
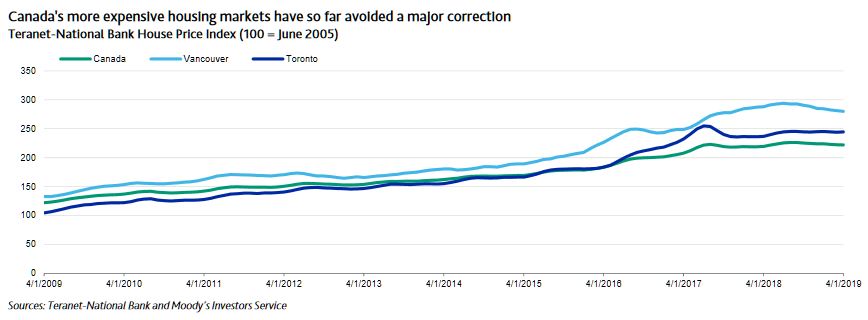
On 14 June, the Canadian Real Estate Association (CREA) reported that May home sales rose 1.9% nationally from April, says Moody’s. The report confirms other recent data suggesting that macro-prudential measures the Canadian government has taken to cool extreme houseprice appreciation over the past five years have been successful in engineering a “soft landing,” easing market concerns that some of the country’s more expensive markets such as Toronto and Vancouver were poised for a major correction. CREA now predicts home sales nationally will rise a sustainable 1.2% in 2019, a reversal from a previous forecast for a drop of 1.6%.
Reducing elevated house-price growth without triggering a severe correction in housing markets supports financial stability in Canada’s banking system and reduces the prospect of rapid consumer deleveraging, which would pressure Canadian bank asset quality. Although Canadian banks’ mortgage portfolios are relatively resilient, unsecured consumer exposures would generate substantial incremental loan losses under the stress of a major housing price correction. This would pressure profitability at the Canadian domestic systemically
important banks (D-SIBs) and be detrimental to their strong credit profiles. The D-SIBs are Bank of Montreal, Bank of Nova Scotia, Canadian Imperial Bank of Commerce, Royal Bank of Canada, The Toronto-Dominion Bank and National Bank of Canada. Rising house prices in the major urban areas of Toronto and Vancouver have been the main driver of the growth in Canadian residential mortgage debt to almost CAD1.9 trillion (about 95% of GDP) as of 31 March 2019. Roughly 50% of domestic banking assets are residential mortgages. Positively, about 85% of Canadian mortgage debt is in disciplined amortizing structures, which are lower risk than interest-only home equity lines of credit (HELOCs).
Policy decisions by the national and several provincial governments, including the tightening of mortgage eligibility requirements, have stabilized prices somewhat in recent quarters. We expect a more sustainable growth rate in housing prices over the next year, as supported by the CREA announcement.
A significant number of Canadian mortgages are explicitly backstopped by the Canadian government through Canada Mortgage and Housing Corporation (CMHC, Aaa stable) insurance, and the loans’ historical credit quality is high. However, federal initiatives to reduce the government’s exposure to housing risk have reduced the proportion of insured mortgages to about 33% at 31 March 2019 from 47% at 31 March 2014.
Structural features of the Canadian mortgage market also buffer banks against the effects of a housing shock: mortgage loans are full recourse, securitization and broker origination levels are low, payments are not tax-deductible and the level of subprime loans is low.
Banks are not invulnerable to losses on mortgages in a stress scenario, but losses would be moderate relative to strong capitalization and earnings. The non-mortgage consumer loans of Canadian banks are relatively more prone to rapid deterioration in the event of an economic shock, especially given high household indebtedness. These exposures also have higher expected loss given defaults than real estate secured debt. We expect increased provisions for credit losses on consumer portfolios over the next year, starting from a low base, with the potential for more significant asset quality deterioration in the event of an economic shock. Evidence of a moderation in housing price growth rates reduces the prospect of this risk.
The report is based on a survey that collected responses from just
over 3,600 Australians across three states – New South Wales, Queensland
and Western Australia – with 75% of responses from metropolitan
locations and 25% from regional areas.
Similar surveys were conducted in 2015 and 2017. This allows for comparisons across the three periods.
Housing costs
The survey asked respondents to estimate the proportion of their
gross income spent on housing costs. Around 40% of all households
reported living rent/mortgage-free (outright owners, young adults living
with parents etc). The chart below shows the distribution across six
bands for the remaining households.
Just under half reported paying over 30% of their income on rent or
mortgage costs. We see little change over the three surveys, although
slightly fewer households are now paying more than 50%.
For 2019, slightly more private renters pay over 30% compared to
owners with a mortgage, but renters are more likely to be in the highest
burden groups. The main difference is 60% of renters are forced to take
on these high housing costs while 72% of owners take them on by choice.
Households are very sensitive to changes in housing costs: 40% of
those surveyed said a 10% increase in costs would have a major impact on
their financial position. The expected impact was greater for renters
than owners with a mortgage (44% compared to 38%). A 3% increase in the
mortgage interest rate would have a major impact on the financial
position of 63% of owners.
The impact of sustaining such costs can be severe: 46% said high
housing costs affected their mental health and 30% their physical
health.
The chart below shows the proportions of households struggling to
meet their housing costs. Again, we see only slight improvement across
the three surveys.
Among all households, 37% reported difficulty regularly meeting
housing costs (at least a few months a year). This rose to around half
of all renters and low-income households and to 56% of one-parent
families.
Housing affordability is not just about paying the rent or mortgage.
It also includes running costs such as utility bills and maintenance.
The survey asked respondents to rate the affordability of their housing
on a ten-point scale and the results were collated into three ranks.
The chart below shows some improvement across surveys in the
proportions of households rating their housing as affordable. These
households are largely outside the lower-income groups.
The deposit gap is the biggest barrier for potential home buyers,
almost double the importance of the next barrier – a lack of stable
employment. Other barriers largely revolve around a lack of suitable
stock.
Help for first home buyers is now embedded. Around three-quarters of
potential purchasers regard government help through the various
mechanisms shown in the chart below as quite or very important while
two-thirds would like access to their superannuation to fund a deposit.
For those without help from the “bank of mum and dad”
these policies can mean the difference between home ownership and many
more years living with parents or renting. It is difficult to see how
such help can be equitably removed from the housing system.
The survey included a number of questions for respondents owning an
investment property and for those thinking about buying one. The capital
gains tax (CGT) discount was more important to investors that negative
gearing. However, only 15% regarded the latter as unimportant.
Around a quarter of investors said they wouldn’t have bought their
property if negative gearing were not available and CGT was half its
current rate. And 28% said they would not buy an investment property in
the absence of negative gearing.
Such results suggest a modest impact on investment demand which could
impact on local housing markets, depending upon the balance between
investors and owner-occupiers in those markets.
Policy development
Between the 2017 and 2019 surveys, house prices and rents fell in large areas of the three states. Yet our analysis shows little impact on affordability for low-income households. Intervention is required to deliver housing affordable to such households.
Large numbers of households are struggling with their housing costs, and not meeting these costs can result in homelessness. This points to the need for more investment in public and community housing.
Ultimately, there is a mismatch between incomes and house prices. Major housing system reform is necessary to redress the balance.
In the meantime, a large and sustained supply of subsidised rental housing and a secure private rental sector that offers a real alternative to ownership are essential components of any future Australian housing system.
Authors: Steven Rowley, Director, Australian Housing and Urban Research Institute, Curtin Research Centre, Curtin University; Alan Duncan, Director, Bankwest Curtin Economics Centre, and Bankwest Research Chair in Economic Policy, Curtin University; Amity James, Senior Lecturer, School of Economics, Finance and Property, Curtin University