Overall, they suggest that development restrictions (interacting with increasing demand) have contributed materially to the significant rise in housing prices in Australia’s largest cities since the late 1990s, pushing prices substantially above the supply costs of their physical inputs.
Although differences in the value of dwelling structures and the physical value of land account for some of the variation in average housing prices across the four cities, zoning effect estimates account for the majority of the differences.
There is also a large gap opening up between apartment sale prices and construction costs over recent years, especially in Sydney. This suggests that zoning constraints are also important in the market for high-density dwellings.
They estimate that zoning restrictions raise detached house prices by 73 per cent of marginal costs in Sydney, 69 per cent in Melbourne, 42 per cent in Brisbane and 54 per cent in Perth.
This is not the amount that house prices would fall in the absence of zoning. Physical land costs are higher in Australian cities (particularly Sydney) than overseas. So even if zoning restrictions were relaxed, housing in Australia would remain expensive relative to cities where zoning is permissive and land is less physically scarce.
Using data from CoreLogic and some supply/dremand modelling they track the difference between the average (or market) price and the marginal (or physical) value of land. Some government policies, – “zoning”, restrict the supply of housing.
Examples include minimum lot sizes, maximum building heights and planning approval processes. Although these restrictions may confer benefits, they also raise the price of housing. This paper attempts to quantify the effect of zoning on housing prices in Australia’s four largest cities.
Anecdotal evidence suggests that zoning can have a huge effect on land values. For example, a 363 hectare site in Wyndam Vale (40 km west of Melbourne) increased in value from $120 million to $400 million following its rezoning from rural to residential (Schlesinger and Tan 2017). Examples like this are common – Appendix A provides more. Such large increases in values as a result of zoning changes are inconsistent with the view that a physical shortage of land itself is the main cause of high land values and housing prices – and instead point towards a high ‘shadow price’ of government permission to build dwellings as a likely explanation. It is difficult, however, to gauge how representative these anecdotes are, or to analyse how they change over time or place.
To estimate the effect of zoning, we consider the cost of a marginal increase in the number and density of dwellings for a given area and given population (hence a reduction in average household size). This means that we do not include the costs involved in increasing the footprint or size of a city, such as provision of extra roads and utilities, as a cost of supplying housing.
Figure 2 shows a decomposition of property prices back to 1999. To extend our estimates of structure value back in time, we adjust the estimates from Table 1 by movements in the producer price index (PPI) – output of house construction series for each city’s corresponding state, and by movements in the average floor area of houses sold in each city. To estimate the value of physical land over time, we estimate separate regressions for each year back to 1999.
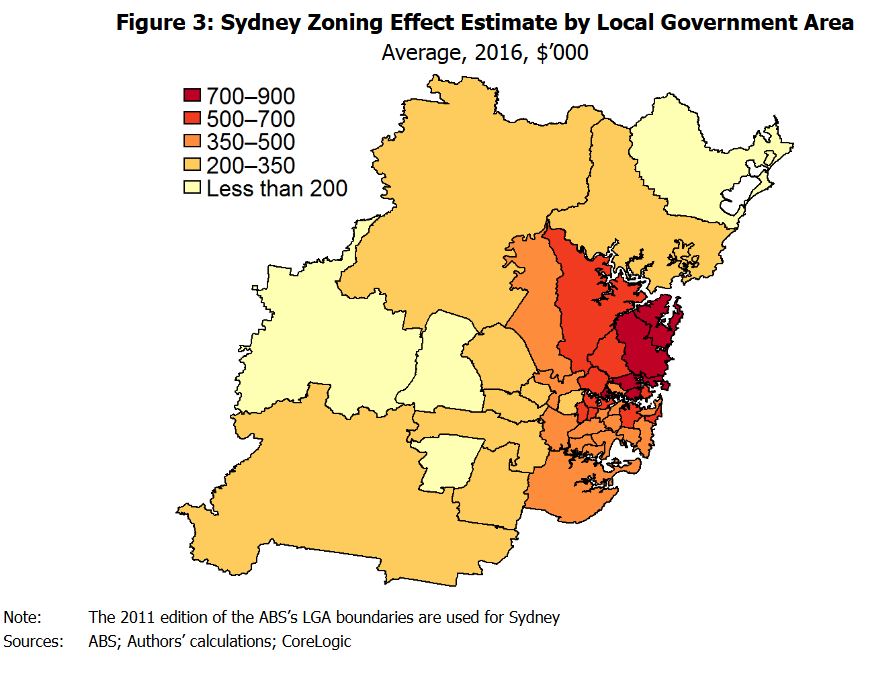
Figures 3–4 show estimates of the zoning effect for the average property in local government areas (LGAs). We split property prices into structure values and land values in each LGA, using the CoreLogic data on property prices and the valuer general estimates for land values for each LGA (as this allows structure value to vary across LGAs for reasons other than just floor area).19 We then estimate physical land values by running separate hedonic regressions for each LGA of the form of our large regression in Section 4.20 Our estimate of the zoning effect by LGA is then the remaining portion of land value not accounted for by the physical value.
If housing demand continues to grow, as seems likely, then existing zoning restrictions will bind more tightly and place continuing upward pressure on housing prices. Policy changes that make zoning restrictions less binding, whether directly (e.g. increasing building height limits) or indirectly, via reducing underlying demand for land in areas where restrictions are binding (e.g. improving transport infrastructure), could reduce this upward pressure on housing prices.
So much of Australia’s history and success is built on immigration. Migrants have benefited incumbent Australians by raising incomes, increasing innovation, contributing to government budgets, smoothing over population ageing and diversifying our social fabric. But it is also true that immigration is affecting house prices and rents.
Australian governments are squandering the gains from migration with poor housing and infrastructure policies. Our new report, Housing affordability: re-imagining the Australian dream, shows what’s at stake. Unless the states reform their planning systems to allow more housing to be built, the Commonwealth should consider tapping the brakes on Australia’s migrant intake.
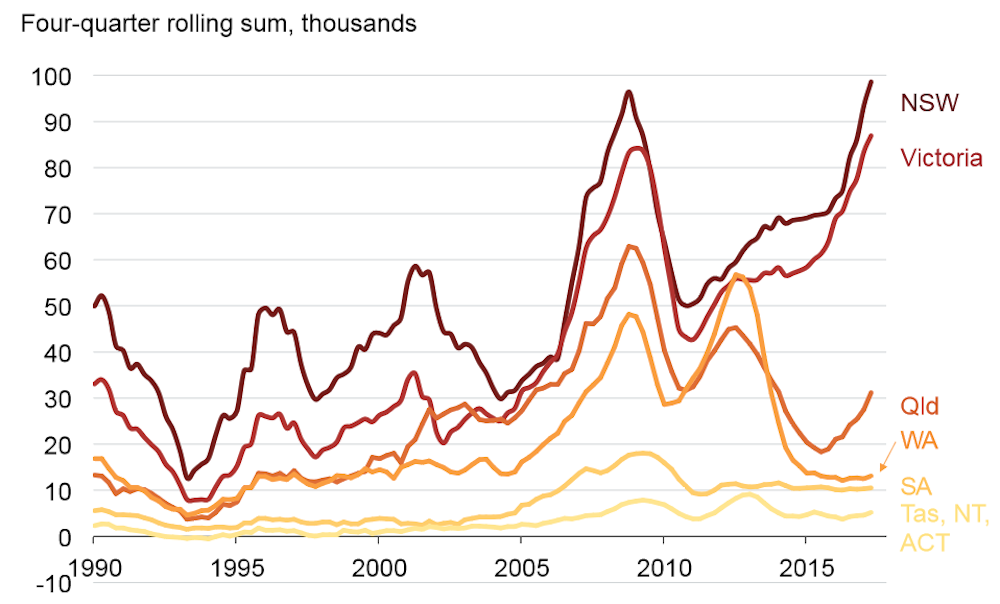
Since 2005, net overseas migration – which includes the increase in temporary migrants – has averaged 200,000 people per year, up from 100,000 in the previous decade. It is predicted to be around 240,000 per year over the next few years.
Immigrants are more likely to move to Australia’s big cities than existing residents, which increases demand for scarce urban housing. In 2011, 86% of immigrants lived in major cities, compared to 65% of the Australian-born population.
Chart 1. Migration has jumped, and so have capital city populations
Grattan Institute, Author provided
Not surprisingly, several studies have found that migration increases house prices, especially when there are constraints on building enough new homes.
The pick-up in immigration coincides with Australia’s most recent housing price boom. Sydney and Melbourne are taking more migrants than ever. Australian house prices have increased 50% in the past five years, and by 70% in Sydney.
Chart 2: Net overseas migration into NSW and Victoria is at record levels
Grattan Institute (Data source: ABS 3101.0 – Australian Demographic Statistics), Author provided
Of course immigration isn’t the only factor driving up house prices and rents. Housing also costs more because incomes rose, interest rates fell and banks made it easier to get a loan. But adding 2 million migrants in the past decade has clearly increased how many new homes are needed.
We haven’t built enough homes
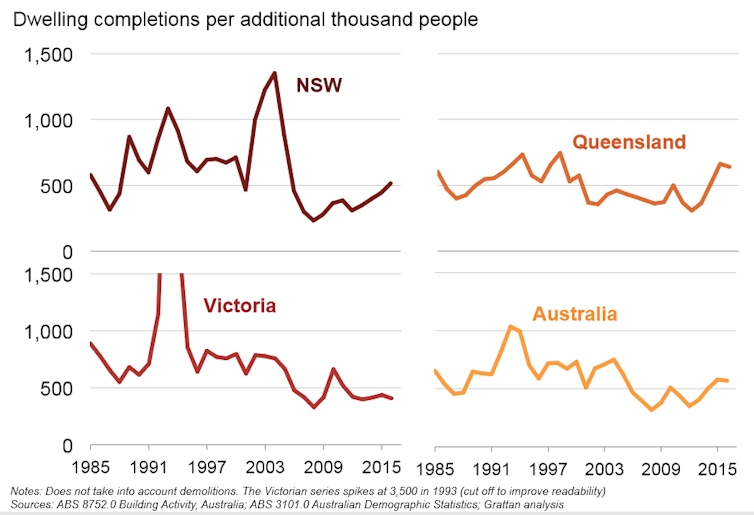
Housing demand from immigration shouldn’t lead to higher prices if enough dwellings are built quickly and at low cost. In post-war Australia, record rates of home building matched rapid population growth. House prices barely moved.
But over the last decade, home building did not keep pace with increases in demand, and prices rose. Through the 1990s, Australian cities built about 800 new homes for every extra 1,000 people. They built half as many over the past eight years.
We estimate somewhere between 450 and 550 new homes are needed for each 1,000 new residents, after accounting for demolitions. And because more families are breaking up and the population is ageing, more homes are needed to accommodate households with fewer members.
Chart 3: Housing construction lagged population in the last decade, but has picked up
Grattan Institute, Author provided
Only in the past couple of years has construction started to match population growth, especially in Sydney. It’s no coincidence that Sydney house prices have finally moderated in the past six months.
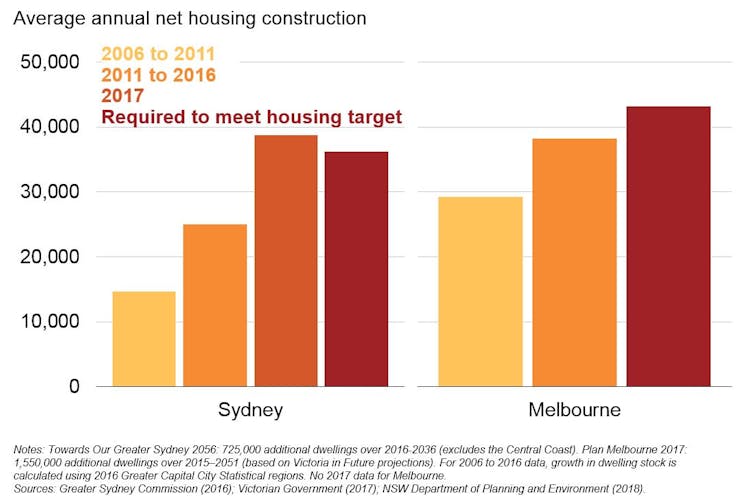
But the backlog of a decade of undersupply remains. Development at today’s record rates is the bare minimum needed to meet record population growth built into Sydney’s and Melbourne’s housing supply targets over the next 40 years.
Chart 4: Strong housing construction will need to be maintained to meet city plan housing targets
Grattan Institute
So what should governments do?
Building more housing will improve affordability the most – but slowly. Even at current record construction rates, new housing increases the stock of dwellings by only 2% each year. But building an extra 50,000 homes a year nationwide for a decade would lead to national house prices between 5% and 20% lower than otherwise. Do it for longer and prices will fall even further.
State governments need to fix planning rules to allow more housing to be built in inner and middle-ring suburbs. More small-scale urban infill projects should be allowed without council planning approval. And state governments should allow denser development “as of right” along key transport corridors. The Commonwealth can help with financial incentives for these reforms.
But the politics of planning in our major cities is fraught. Most people in established middle suburbs already own their houses. Prospective residents who don’t already live there can’t vote in council elections, and their interests are largely unrepresented.
If we want to maintain current migration levels, along with their economic, social and budgetary benefits, we need to do better at planning to allow more housing to be built.
What does this mean for the migrant intake?
The Australian government should develop a population policy, as the Productivity Commission recommended. It should articulate the appropriate level of migration given its economic, budgetary and social benefits and costs. This should include how it affects the Australian community living with the reality of land use planning policy – and contrasting this with the effect of optimal planning policy.
If planning and infrastructure policies don’t improve, the government should consider cutting the migration intake. This would reduce demand for housing, but would also reduce the incomes of existing residents.
The best policy is probably to continue with Australia’s demand-driven, relatively high-skill migration and to build enough homes for the growing population. But Australia is in a world of third-best policy: rapid migration and restricted housing supply are imposing big costs on people who don’t already own their homes. If the states are not going to reform planning rules to increase the number of homes built, then the Australian government should consider whether reducing migration is the lesser evil.
Any reduction should be modest and targeted at the parts of the migration program that provide the smallest benefit to Australian residents and migrants themselves. Balancing these interests is difficult, because each part of the program has different economic, social and budgetary costs and benefits.
Cutting back family reunion visas would have substantial social costs. Limiting skilled migration would hurt the economy and many businesses. Restricting growth in international students would reduce universities’ incomes.
There are also broader costs to cutting the migrant intake. It would hit the Commonwealth budget in the short term. Most migrants are of working age and pay full rates of personal income tax. And many temporary migrants, such as 457 visa holders, can’t draw on a range of government services and benefits, including welfare and Medicare. More importantly, cutting back on younger, skilled migrants is likely to hurt the budget and the economy in the long term.
But there is no point denying that housing affordability is worse because of a combination of rapid immigration and poor planning policy. Rather than tackling these issues, much of the debate has focused on policies that are unlikely to make a real difference. Unless governments own up to the real problems, and start explaining the policy changes that will make a real difference, Australia’s housing affordability woes are likely to get worse.
Authors; John Daley, Chief Executive Officer, Grattan Institute; Brendan Coates, Fellow, Grattan Institute; Trent Wiltshire, Associate, Grattan Institute
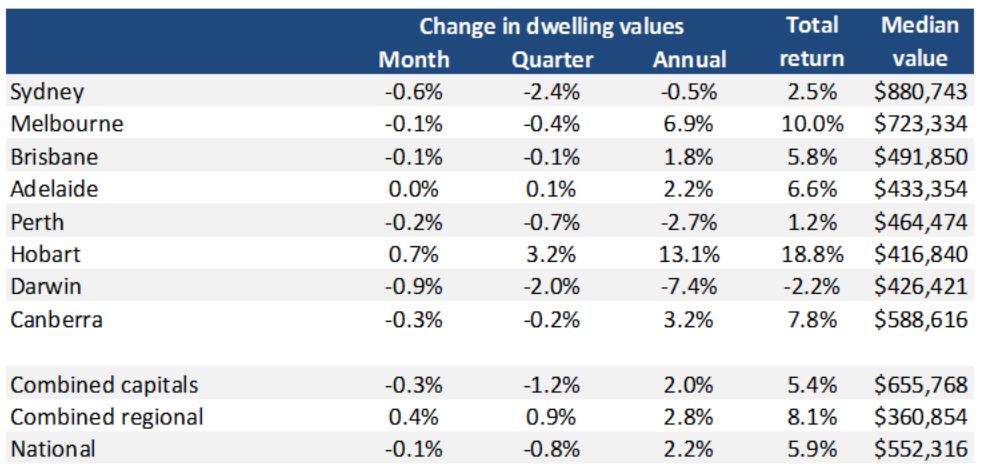
According to the CoreLogic Home Value Index results out today, dwelling values edged lower across most capital cities over the month, with broad based falls weighing down dwelling values nationally for the fifth consecutive month.
The 0.1% decline in national dwelling values in February 2018 was more moderate than the 0.3% declines recorded over each of the previous two months, however, it marked the first time national values had fallen for five consecutive months since March 2016. There continues to be a divergence between capital city and regional markets, with the combined capital city index falling by -0.3% over the month, compared to a 0.4% increase in combined regional values.
Month-on-month falls were generally mild but broad based Over the month, values fell across every capital city except Hobart (+0.7%) and Adelaide (steady), with the largest monthly decline recorded across Darwin (-0.9%) and Sydney (-0.6%). Values were lower in Melbourne (-0.1%), Brisbane (-0.1%), Perth (-0.2%), and Canberra (-0.3%).
The rate of decline eased over the second half of February although values have fallen in most capital cities during February, the CoreLogic daily index indicates that the rate of decline eased late in the month, in line with improving auction clearance rates. Sydney, Melbourne and Perth all recorded more moderate falls in values throughout February than they did in January.
CoreLogic head of research, Tim Lawless, said, “The overall softening in the market becomes more evident when looking at the change in values over the past three months.”
Over the three months to February 2018, Adelaide (0.1%) and Hobart (3.2%) were the only capital cities in which values rose. Sydney, which has been the strongest market for value growth over recent years, saw the largest fall in values over the three month period, down -2.4%. Sydney was followed by Darwin, which has been persistently weak over recent years, and saw values fall by a further -2.0% over the quarter.
Regional markets outperforming the capitals While most individual capital cities recorded declines in values over the past three months, in the regional areas of the country the results were very different; regional dwelling values increased by 0.9% over the three months and values were higher in the regional areas of all states except for Western Australia.
If you had $1 billion to spend on safe real estate assets, where would you look to buy?
For many funds, financial institutions, and wealthy individuals, the perception is that the world’s financial centers are the places to be. After all, world-class cities like New York, London, and Hong Kong will never go out of style, and their extremely robust and high-density city centers limit the supply of quality assets to buy.
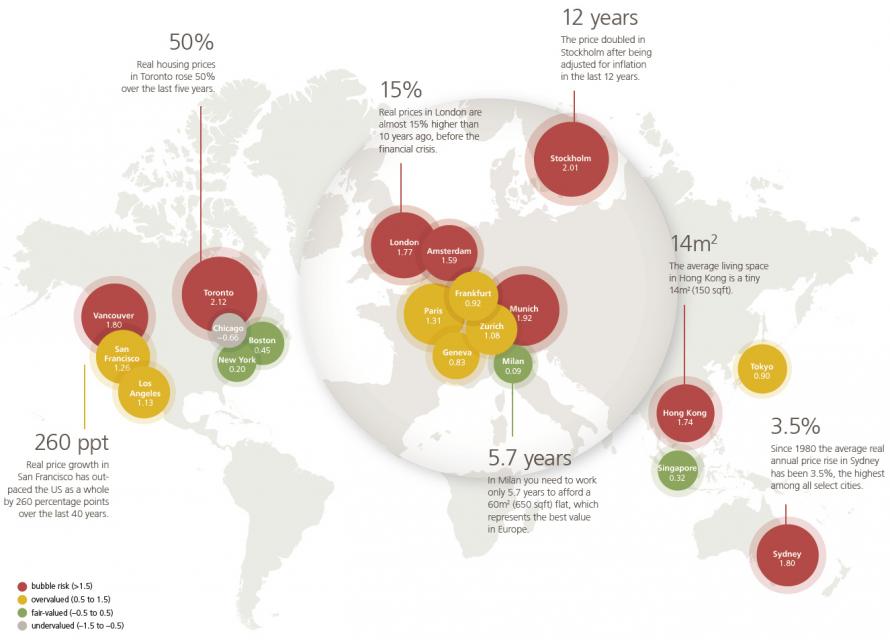
According to UBS, certain cities have seen prices rise at rates that are potentially not sustainable – and eight of these financial centers are at risk of having real estate bubbles that could eventually deflate.
Global Real Estate Bubble Index
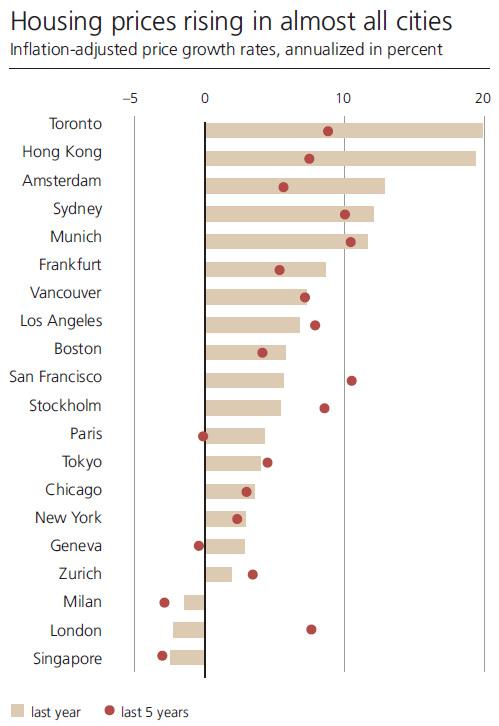
Every year, UBS publishes the Global Real Estate Bubble Index, and the most recent edition shows several key markets in bubble territory.
The bank highlights Toronto as the biggest potential bubble risk, noting that real prices have doubled over 13 years, while real rents and real income have only increased 5% and 10% respectively.
However, the largest city in Canada was certainly not the only global financial center with real estate appreciating at rapid rates in the last year.
In Munich, Toronto, Amsterdam, Sydney and Hong Kong, prices rose more than 10% in the last year alone.
Annual increases at a 10% clip would lead to the doubling of prices every seven years, something the bank says is unsustainable.
In the last year, there were three key markets where prices did not rise: London, Milan, and Singapore.
London is particularly notable, since it holds more millionaires than any other city in the world and is rated as the #1 financial center globally.
There is a rising chorus demanding that APRA loosen their rules for mortgage lending in the face of slipping home prices. This despite the RBA’s recent comments about the risks in the system, especially relating to investor and interest only loans. But this is unlikely, and in fact more tightening, either by a rate rise, or macroprudential will be needed to contain the risks in the system. The latter is more likely.
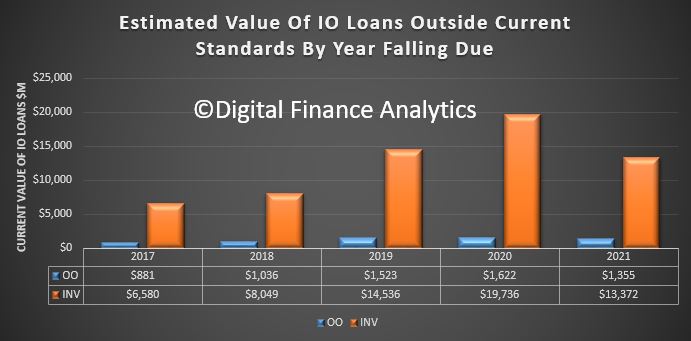
Some of this will come from the lenders directly. For example, last week ANZ said it will be regarding all interest-only loan renewals as credit critical event requiring full income verification from 5 March. If loans failed this assessment these loans would revert to P&I loans (with of course higher repayment terms). We are already seeing a number of forced switches, or forced sales thanks to the tighter IO rules more generally. This is just the start. More than $60 billion of IO loans are outside current underwriting standards on our estimates.
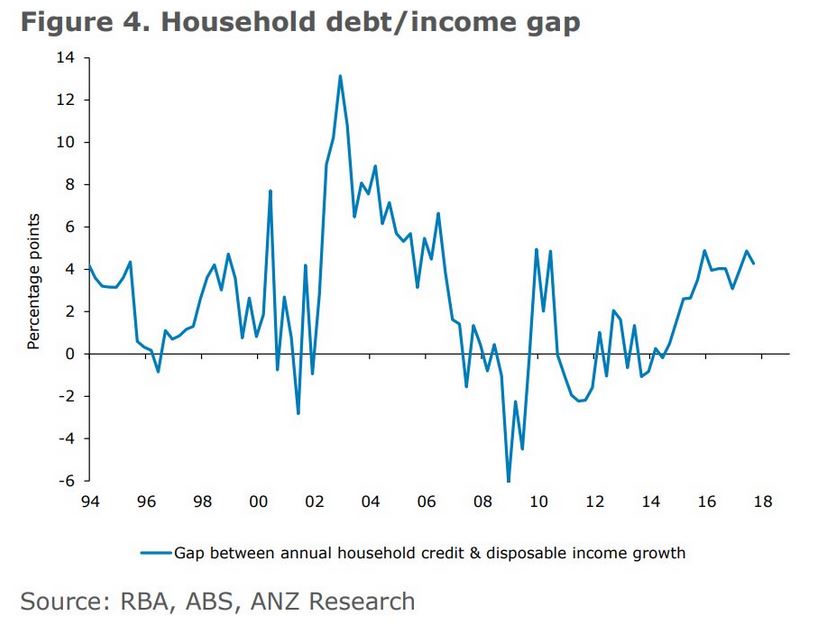
But, as ANZ has pointed out in a separate note from David Plank, Head of Australian Economics at ANZ; household leverage is still increasing, this despite a moderation in housing credit growth over the past year. Household debt continues to grow faster than disposable income.
With household debt being close to double disposable income it will actually require the growth in household debt to slow well below that of income in order for the ratio of household debt to income to stabilise, let alone fall.
In fact, he questions whether financial stability has really being improved so far, when interest rates are so very low.
A key concern we have with the RBA’s comfort with recent household debt trends is whether the slowdown in household debt growth is likely to be sustained with interest rates so low.
Our analysis on the debt/income gap suggests that the RBA’s comfort with how things are evolving on the debt front may be misplaced.
The first sign of this will be clear evidence of recovery in house prices, possibly already underway, which will likely be followed by a reacceleration in debt growth.
If things develop in this fashion it will be interesting to see whether the RBA maintains its focus on clear progress toward the mid-point of the inflation target range as the key to the setting of interest rates.
We suspect that the first port of call to any signs of a reacceleration in household debt will be additional macro-prudential policy…
In other words expect more tightening before the cash rate goes up.
Australia should cut its immigration intake, according to Tony Abbott in a recent speech at the Sydney Institute. Abbott explicitly cites economic theory in his arguments: “It’s a basic law of economics that increasing the supply of labour depresses wages; and that increasing demand for housing boosts price.”
But this economic analysis is too basic. Yes, supply matters. But so does demand.
And while migrants do live in houses, the federal government’s fondness for stoking demand and the inactivity of state governments in increasing supply are the real issues affecting affordability.
The economy isn’t a fixed pie
Let’s take Abbott’s claims about immigration one by one, starting with wages.
It’s true that if you increase labour supply that, holding other factors that affect wages constant, wages will decline. However, those other factors are rarely constant.
Notably, if the demand for labour is increasing by more than supply (including new migrants), then wages will rise.
This is a big part of the story when it comes to the relationship between wages and migration in Australia. Large migrant numbers have been an almost constant feature of Australia’s economy since the end of the second world war, if not earlier.
But these migrants typically arrived in the midst of economic growth and rising demand for labour. This is particularly true in recent decades, when we have had one of the longest periods of unbroken growth in the history of the developed world.
In our study of the Australian labour market, we found no relationship between immigration rates and poor outcomes for incumbent Australian workers in terms of wages or jobs.
Australia uses a point system for migration that targets skilled migrants in areas of high labour demand. Business is suffering in these areas. Migrants into these sectors don’t take jobs from anybody else because they are meeting previously unmet demand.
These migrants receive a higher wage than they would in their place of origin, and they allow their new employers to reduce costs. This ultimately leads to lower prices for consumers. Just about everybody benefits.
There’s an idea called the “lump of labour fallacy”, which holds that there is a certain amount of work to be done in an economy, and if you bring in more labour it will increase competition for those jobs.
But migrants also bring capital, investing in houses, appliances, businesses, education and many other things. This increases economic activity and the number of jobs available.
Furthermore, innovation has been shown to be strongly linked to immigration. In the United States, for instance, immigrants apply for patents at twice the rate of non-immigrants. And a large number of studies show that immigrants are over-represented in patents, patent impact and innovative activity in a wide range of countries.
We don’t entirely know why this is. It could be that innovative countries attract migrants, or it could be than migrants help innovation. It’s likely that the effect goes both ways and is a strong argument against curtailing immigration.
Abbott’s comments are more reasonable in the case of housing affordability because here all other things really are held constant. Specifically, studies show that housing demand is overheated in part by federal government policies (negative gearing and capital gains tax exemptions, for instance) and state governments not doing enough to increase supply.
Governments have responded to high housing prices by further stoking demand, suggesting that people dip into their superannuation, for instance.
In the wake of Abbott’s speech there has been speculation that our current immigration numbers could exacerbate the pressures of automation, artificial intelligence and other labour-saving innovations.
But our understanding of these forces is nascent at best. In previous instances of major technological disruption, like the industrial revolution, the long-run effects on employment were negligible. When ATMs debuted, for example, many bank tellers lost their jobs. But the cost of branches also declined, new branches opened and total employment did not decline.
In his speech, Abbott said that the government needs policies that are principled, practical and popular. What would be popular is if governments across the country could fix our myriad policy problems. Abbott identified some of the big ones – wages, infrastructure and housing affordability.
What would be practical is to identify the causes of these problems and address these directly. Immigration is certainly not a major cause. It would be principled to undertake evidence-based analysis regarding what the causes are and how to address them.
A lot of that has already been done, notably by the Grattan Institute. What remains is for governments to do the politically difficult work of facing the facts.
Authors: Robert Breunig, Professor of Economics, Crawford School of Public Policy, Australian National University; Mark Fabian, Postgraduate student, Australian National University
Recent events have the potential to create a revolution in Australian Finance. We explore the 72 hours that changed banking forever.
Welcome to the Property Imperative Weekly to 10th February 2018.Watch the video or read the transcript.
In our latest weekly digest, we start with the batch of new reports, all initiated by the current Australian Government – and which combined have the potential to shake up the Financial Services sector, and reduce the excessive market power which the four major incumbents have enjoyed for years.
On Wednesday, the Productivity Commission, Australian Government’s independent research and advisory body released its draft report into Competition in the Australian Financial System. It’s a Doozy, and if the final report, after consultation takes a similar track it could fundamentally change the landscape in Australia. They leave no stone unturned, and yes, customers are at a significant disadvantage. Big Banks, Regulators and Government all cop it, and rightly so. They say, Australia’s financial system is without a champion among the existing regulators — no agency is tasked with overseeing and promoting competition in the financial system. It has also found that competition is weakest in markets for small business credit, lenders’ mortgage insurance, consumer credit insurance and pet insurance. The report demonstrates the inter-linkages between difference financial entities, and their links to the four majors. They criticised mortgage brokers and financial advisers for poor advice (influenced by commission and ownership structures) and the regulatory environment, where the shadowy Council of Finance Regulators (RBA, ASIC, APRA and Treasury) do not even release minutes of the meetings which set policy direction. You can watch our separate video blog on this.
On Thursday, the Treasurer released draft legislation to require the big four banks to participate fully in the credit reporting system by 1 July 2018. They say this measure will give lenders access to a deeper, richer set of data enabling them to better assess a borrower’s true credit position and their ability to pay a loan. This removes the current strategic advantage which the majors have thanks to the credit data asymmetry, and the current negative reporting. We note that there is no explicit consumer protection in this bill, relating to potential inaccuracies of data going into a credit record. This is, in our view a significant gap, especially as the proposed bulk uploading will require large volumes of data to be transferred. It does however smaller lenders to access information which up to now they could not, so creating a more level playing field. Consumers may benefit, but they should also beware of the implications of the proposals.
On Friday, Treasurer Morrison released the report by King & Wood Mallesons partner Scott Farrell in to open banking which aims to give consumers greater access to, and control over, their data and which mirrors developments in the UK. This “open banking” regime mean that customers, including small businesses, can opt to instruct their bank to send data to a competitor, so it can be used to price or offer an alternative product or service. Great news for smaller players and fintechs, and possibly for customers too. Bad news for the major players. The report recommends that the open banking regime should apply to all banks, though with the major banks to join it first. For non-banks and fintechs, the report wants a “graduated, risk-based accreditation standard”. Superannuation funds and insurers are not included for now. In terms of implementation, data holders should be required to allow customers to share information with eligible parties via a dedicated application programming interface, not screen scraping. A period of approximately 12 months between the announcement of a final Government decision on Open Banking and the Commencement Date should be allowed for implementation. From the Commencement Date, the four major Australian banks should be obliged to comply with a direction to share data under Open Banking. The remaining Authorised Deposit-taking Institutions should be obliged to share data from 12 months after the Commencement Date, unless the ACCC determines that a later date is more appropriate.
Then of course the Royal Commission in Financial Services starts this coming week. We discussed this on ABC The Business on Thursday. Lending Practice is on the agenda, highly relevant given the new UBS research (they of liar loans) suggesting that incomes of many more affluent households are significantly overstated on mortgage application forms. And The BEAR – the bank executive behaviour regime legalisation – passed the Senate, and as a result of amendments, Small and medium banking institutions have until 1 July 2019 to prepare for the BEAR while it will commence for the major banks on 1 July 2018.
APRA Chairman Wayne Byers spoke at the A50 Australian Economic Forum, Sydney. Significantly, he says the temporary measures taken to address too-free mortgage lending will morph into the more permanent focus on among other things, further strengthening of borrower serviceability assessments by lenders, strengthened capital requirements for mortgage lending, and the comprehensive credit reporting being mandated by the Government.
Adelaide Bank is ahead of the curve, as it introducing an alert system that will monitor property borrowers that are struggling with their repayments. The bank and its subsidiaries and affiliates will compare monthly mortgage repayments with borrowers’ income ratios. In addition, extra scrutiny will be applied where the loan-to-income ratio exceeds five times or monthly mortgage repayments exceed 35% of a borrower’s income.
But combined, data sharing, positive credit and banking competition and regulation are all up in the air, or are already coming into force and in each case it appears the big four incumbents are the losers, as they are forced to share customer data, and competition begins to put their excessive profitability under pressure. It highlights the dominance which our big banks have had in recent years, and the range of reforms which are in train. The face of Australian Banking is set to change, and we think customers will benefit. But wait for the rear-guard actions and heavy lobbying which will take place ahead.
Of course the RBA left the cash rate on hold this week, and signalled the next move will likely be up, but not for some time. Retail turnover for December fell 0.5% according to the ABS seasonally adjusted. This is the headline which will get all the coverage, but the trend estimate rose 0.2 per cent in December 2017 following a rise of 0.2 per cent in November 2017. Compared to December 2016 the trend estimate rose 2.0 per cent. This is in line with average income growth, but not good news for retailers.
The latest Housing Finance Data from the ABS shows a fall in flows in December. In trend terms, the total value of dwelling finance commitments excluding alterations and additions fell 0.1% or $31 million. Owner occupied housing commitments rose 0.1% while investment housing commitments fell 0.5%. Owner occupied flows were worth $14.8 billion, and down 0.3% last month, while owner occupied refinancing was $6.2 billion, up 1.2% or $73 million. Investment flows were worth 11.9 billion, and fell 0.5% or $62 million. The percentage of loans for investment, excluding refinancing was 45%, down from 49% in Dec 2016. Refinancing was 29.5% of OO transactions, up from 29.2% last month. Momentum fell in NSW and VIC, the two major states. In original terms, the number of first home buyer commitments as a percentage of total owner occupied housing finance commitments fell to 17.9% in December 2017 from 18.0% in November 2017 – the number of transactions fell by 1,300 compared with last month. But the ABS warns that the First Time Buyer data may be revised and users should take care when interpreting recent ABS first home buyer statistics. The ABS plans to release a new publication which will see Housing Finance, Australia (5609.0) and Lending Finance, Australia (5671.0) combined into a single, simpler publication called Lending to Households and Businesses, Australia (5601.0).
We continue to have data issues with mortgage lending, with the RBA in their new Statement on Monetary Policy saying it now appears unnecessary to adjust the published growth rates to undo the effect of regular switching flows between owner occupied and investment loans as they have been doing for the past couple of years. So now investor loan growth on a 6-month basis has been restated to just 2%. More fluff in the numbers! Additionally, the RBA will publish data on aggregate switching flows to assist with the understanding of this switching behaviour.
More data this week highlighting the pressures on households. National Australia Bank’s latest Consumer Behaviour Survey, shows the degree of anxiety being caused by not only cost of living pressures but also health, job security, retirement funding as well as Australian politics. Of all the things bothering Australian households in early 2018, nothing surpasses cost of living pressures. Over 50% of low income earners reported some form of hardship, with almost one in two 18 to 49-year-olds being effected.
Despite improved job conditions and households reporting healthier financial buffers, the overall financial comfort of Australians is not advancing, according to ME’s latest Household Financial Comfort Report. In its latest survey, ME’s Household Financial Comfort Index remained stuck at 5.49 out of 10, with improvements in some measures of financial comfort linked to better employment conditions – e.g. a greater ability to maintain a lifestyle if income was lost for three months – offset by a fall in comfort with living expenses.
We released the January 2018 update of our Household Financial Confidence Index, using data from our rolling 52,000 household surveys. The news is not good, with a further fall in the composite index to 95.1, compared with 95.7 last month. This is below the neutral setting, and is the eighth consecutive monthly fall below 100. Costs of living pressures are very real, with 73% of households recording a rise, up 1.5% from last month, and only 3% a fall in their living costs. A litany of costs, from school fees, child care, fuel, electricity and rates all hit home. You can watch our separate video on this.
We also published updated data on net rental yields this week, using data from our household surveys. Gross yield is the actual rental stream to property value, net rental is rental payments less the costs of funding the mortgage, management fees and other expenses. This is calculated before any tax offsets or rebates. The latest results were featured in an AFR article. The results are pretty stark, and shows that many property investors are underwater in cash flow terms – not good when capital values are also sliding in some places. Looking at rental returns by states – Hobart and Darwin are the winners; Melbourne, and the rest of Victoria, then Sydney and the rest of NSW the losers. The returns vary between units and houses, with units doing somewhat better, and we find some significant variations at a post code level. But we found that more affluent households are doing significantly better in terms of net rental returns, compared with those in more financially pressured household groups. Batting Urban households, those who live in the urban fringe on the edge of our cities are doing the worst. This is explained by the types of properties people are buying, and their ability to select the right proposition. Running an investment property well takes skill and experience, especially in the current rising interest rate and low capital growth environment. Another reason why prospective property investors need to be careful just now.
Finally, we saw market volatility surge, as markets around the world gyrated following the “good news” on US Jobs last week, which signalled higher interest rates. In our recent video blog we discussed whether this is a blip, or something more substantive. We believe it points to structural issues which will take time to play out, so expect more uncertainly, on top of the correction which we have already had. This will put more upward pressure on interest rates, and also on bank funding here.
Overall then, a week which underscores the uncertainly across the finance sector, and households. This will not abate anytime soon, so brace for a bumpy ride. And those managing our large banks will need to adapt to a fundamentally different, more competitive landscape, so they are in for some sleepless nights.
If you found this useful, do like the post, add a comment and subscribe to receive future updates. Many thanks for taking the time to watch.
Global economic growth continues to improve. While global inflation remains subdued, there are some signs of emerging pressures. Commodity prices have increased, although agricultural prices are relatively soft. International bond yields have increased since November but remain relatively low. Equity markets have been strong, although volatility has increased recently. Monetary policy remains easy in the advanced economies but is gradually becoming less stimulatory.
The exchange rate has firmed since the November Statement, due in large part to a weak US dollar. We assume the trade weighted exchange rate will ease over the projection period.
GDP growth eased over the second half of 2017 but is expected to strengthen, driven by accommodative monetary policy, a high terms of trade, government spending and population growth.
Labour market conditions continue to tighten. Compared to the November Statement, the growth profile is weaker in the near term but stronger in the medium term.
The Bank has revised its November estimates of the impact of government policies on economic activity based on Treasury’s HYEFU. The net impact of these policies has been revised down in the near term. The Kiwibuild programme contributes to residential investment growth from 2019.
House price inflation has increased somewhat over the past few months but housing credit growth continues to moderate.
The Bank says ” Bank funding costs eased slightly in the second half of 2017. Consistent with the decline in funding costs and a fall in the two-year swap rate, the average two-year mortgage rate has declined by around 15 basis points since June 2017. In contrast, most other mortgage rates have remained relatively stable. Mortgage rates are higher than a year ago across all terms, but remain low relative to history”.
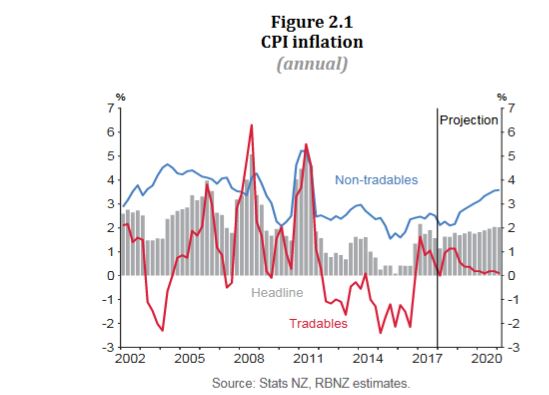
Annual CPI inflation in December was lower than expected at 1.6 percent, due to weakness in manufactured goods prices.
While oil and food prices have recently increased, traded goods inflation is projected to remain subdued through the forecast period. Non-tradable inflation is moderate but expected to increase in line with increasing capacity pressures. Overall, CPI inflation is forecast to trend upwards towards the midpoint of the target range. Longer-term inflation expectations are well anchored at 2 percent.
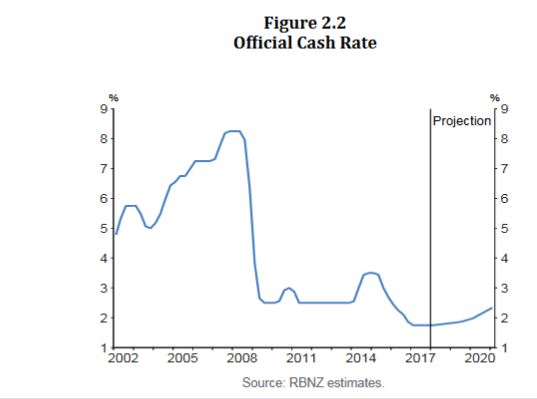
Monetary policy will remain accommodative for a considerable period. Numerous uncertainties remain and policy may need to adjust accordingly.
So now we come to it. Australia’s future is totally locked into the housing market. If prices continue to fall (to begin to correct the massive over swing) , the macroprudential settings may be eased, and the RBA may cut the cash rate to stimulate the already over high household debt (200%).
Or in other words, once again the property sector becomes a political football. The question is does the “independent” RBA have the intestinal fortitude to resist the chorus. We simply have to get housing under control, as the longer term harm in not so doing will cripple us down the track .
In an AFR interview, the Treasurer signals that the macro-prudential lending controls could be eased.
Financial regulators may dial back home lending restrictions which have helped clamp down on rampant property price growth, if the recent slowdown in property values descends into sharper-than-anticipated falls, the federal Treasurer has signalled.
The government was “closely watching” the cooling residential real estate market Scott Morrison said.
Mr Morrison said he was meeting regularly with the Australian Prudential Regulation Authority – led by chairman Wayne Byres – and Reserve Bank of Australia – headed by governor Philip Lowe – to discuss the Council of Financial Regulators’ process.
The council, comprising the heads of APRA, RBA, the Australian Securities and Investments Commission and Mr Morrison’s Treasury Secretary, John Fraser, meets at least quarterly and is the guiding body informing APRA’s home lending rules for banks.
Mr Morrison said APRA’s restrictions over the past year to control lending to investors and to cap interest only loans had been “very effective” in achieving a “soft landing”.
But he signalled the rules were open to revision according to market conditions.
And elsewhere, Credit Suisse analysts are forecasting a large miss in Australian economic growth for the December quarter and residential investment could fall a lot sooner-than-expected if house prices weaken further, requiring a CUT in official interest rates. From Business Insider.
Credit Suisse analysts are forecasting a large miss in Australian economic growth for the December quarter.
And the recent housing downturn forms a central part of their analysis, as consumers reduce spending amid cooling house prices and other areas of the economy fail to pick up the slack.
The consensus forecast is for Q4 economic growth to come in around 0.9%, leaving annual growth in a range between 2.75% and 3.25%. The data is scheduled for release on March 7.
“We believe that the actual number is likely to come in south of 0.5%, taking year-ended growth below 2.4%,” Credit Suisse said.
The chart below shows the bank’s GDP tracker, which is pointing to softer growth in the near-term:
This chart shows each of the components Credit Suisse uses in the tracker to calculate its GDP forecasts:
“We remain of the view that without timely rate cuts, house prices are on an L-shaped trajectory, meaning that consumption and employment growth could slow sharply, while residential and infrastructure investment flatten out,” Credit Suisse said.
So when it comes to Australia’s near-term growth prospects and the outlook for interest rates, “much turns on the housing outlook”.
The analysts said the recent decline in foreign investment — along with tighter bank lending standards in the wake of the latest APRA restrictions — were two key factors in the recent house price-action.
“If the RBA is satisfied that eventually, foreign buying will return and banks will relax their lending standards, perhaps a short-term downturn is tolerable without cutting rates.”
“But if officials cannot see a recovery in house prices over the next few years, there is more urgency to cut rates, because the direct and indirect effects of housing weakness are too big to ignore.”
They noted the result was partly due to monthly volatility after a sharp rise in November, but said recent numbers are indicative of a broader downtrend.
“It appears that fundamentals are now re-asseting themselves. Consistent with past experience, building approvals are now coming off their highs with house prices, albeit with a slight delay.”
“The bad news is that residential investment could fall a lot sooner-than-expected if house prices weaken further.”
“This is over and above the negative wealth and credit effects on consumer spending from falling house prices.”
In view of that, it’s “hard to see a silver lining without rate cuts”.
The Home Price Crunch is happening now, but how low will prices go and which areas will get hit the worst? Welcome to the Property Imperative Weekly to 3rd February 2018.
Welcome to our digest of the latest finance and property news. Watch the video or read the transcript.
There was lots of new data this week, after the summer break. NAB released their Q4 2017 Property Survey and it showed that property dynamics are shifting. They see property prices easing as foreign buyers lose interest, and a big rotation from the east coast. Tight credit will be a significant constraint. National housing market sentiment as measured by the NAB Residential Property Index, was unchanged in Q4, as big gains in SA and NT and WA (but still negative) offset easing sentiment in the key Eastern states (NSW and VIC). Confidence levels also turned down, led by NSW and VIC, but SA and NT were big improvers. First home buyers (especially those buying for owner occupation) continue raising their profile in new and established housing markets, with their share of demand reaching new survey highs. In contrast, the share of foreign buyers continued to fall in all states, except for new property in QLD and established housing in VIC, with property experts predicting further reductions over the next 12 months. House prices are forecast to rise by just 0.7% (previously 3.4%) and remain subdued in 2019 (0.8%). Apartments will under-perform, reflecting large stock additions and softer outlook for foreign demand.
Both CoreLogic and Domain released updated property price data this week. It is worth comparing the two sets of results as there are some significant variations, and this highlights the fact that these numbers are more rubbery than many would care to admit. Overall, though the trends are pretty clear. Sydney prices are sliding, along with Brisbane, and the rate of slide is increasing though it does vary between houses and apartments, with the latter slipping further. For example, Brisbane unit prices have continued their downward slide, down to $386,000; a fall of 2.2 per cent for the quarter and 4.4 per cent for the year. Here units are actually at a four-year low. Momentum in Melbourne is slowing though the median value was up 3.2 per cent to $904,000 in the December quarter, according to Domain. Perth and Darwin remains in negative territory. Domain said Darwin was the country’s worst performer with a 7.4 per cent drop in its median house price to $566,000 and a 14 per cent plunge in its unit price to $395,000, thanks to a slowing resources sector. It also hit Perth, with a house median fall of 2.5 per cent to $557,000, and its units 1.7 per cent to $369,000. On the other hand, prices in Hobart and Canberra are up over the past year and Hobart is the winner, but is it 17% or 12%, a large variation between the two data providers? And is Canberra 8% or 4%? It depends on which data you look at. Also, these are much smaller markets, so overall prices nationally are on their way down. My take out is that these numbers are dynamic, and should not be taken too seriously, though the trend is probably the best indicator. Perhaps their respective analysts can explain the variations between the two. I for one would love to understand the differences. The ABS will provide another view on price movements, but not for several months.
The latest ABS data on dwellings approvals to December 2017 shows that the number of dwellings approved fell 1.7 per cent in December 2017, in trend terms, and has fallen for three months. Approvals for private sector houses have remained stable, with just under 10,000 houses approved in December 2017, but the fall was in apartments, especially in NSW and QLD. More evidence of the impact of the rise in current supply of apartments, and why high rise apartment values are on the slide. Also, the ABC highlighted the fact that Real estate sales companies are using big commissions to tempt mortgage brokers, financial planners and accountants to sell overpriced properties to unsuspecting clients. This is a way to offload the surplus of high-rise apartments, and looks to be on the rise, another indicator of risks in the property sector.
In other economic news, the ABS released the latest Consumer Price Index (CPI) which rose 0.6 per cent in the December quarter 2017. Annual inflation in most East Coast cities rose above 2.0 per cent, due in part to the strength in prices related to Housing. This follows a rise of 0.6 per cent in the September quarter 2017. However, there were some changes in methodology which may have impacted the results. Softer economic conditions in Darwin and Perth have resulted in annual inflation remaining subdued at 1.0 and 0.8 per cent respectively. Many commentators used this data to push out their forecast of when then RBA may lift the cash rate – but my view is we should watch the international interest rate scene, as this is where the action will be.
Whilst the FED held their target rate this week, there is more evidence of further rate rises ahead. Most analysts suggest 2-3 hikes this year, but the latest employment data may suggest even more. The benchmark T10 bond yield continues to rise and is at its highest since 2014, and now close to that peak then of about 3%. Have no doubt interest rates are on their way up. This will put more pressure on funding costs around the world, and put pressure on mortgage rates here. In fact Alan Greenspan, the former Fed Chair, speaking about the US economy said “there are two bubbles: We have a stock market bubble, and we have a bond market bubble”. “Irrational exuberance” is back! He said we’re working, obviously, toward a major increase in long-term interest rates, and that has a very important impact, on the whole structure of the economy. Greenspan said. As a share of GDP, “debt has been rising very significantly” and “we’re just not paying enough attention to that.” US rate hikes will lift international capital market prices, putting more pressure on local bank margins.
We published our latest mortgage stress research, to January 2018, Across Australia, more than 924,000 households are estimated to be now in mortgage stress compared with 921,000 last month. This equates to 29.8% of borrowing households. In addition, more than 20,000 of these are in severe stress, down 4,000 from last month. We estimate that more than 51,500 households risk 30-day default in the next 12 months, down 500 from last month. We expect bank portfolio losses to be around 2.7 basis points, though with losses in WA are likely to rise to 4.9 basis points. Some households have benefited from refinancing to cheaper owner occupied loans, giving them a little more wriggle room in terms of cash flow. The typical transaction has saved up to 45 basis points or $187 each month on a $500,000 repayment mortgage. You can watch our separate video blog on the results, where we count down the top 10 most stressed postcodes.
But the post code with the highest count of stressed households, once again is NSW post code 2170, the area around Liverpool, Warwick Farm and Chipping Norton, which is around 27 kilometres west of Sydney. There are 7,375 households in mortgage stress here, up by more than 1,000 compared with last month. The average home price is $815,000 compared with $385,000 in 2010. There are around 27,000 families in the area, with an average age of 34. The average income is $5,950. 36% have a mortgage and the average repayment is about $2,000 each month, which is more than 33% of average incomes.
We continue to see mortgage stress still strongly associated with fast growing suburbs, where households have bought property relatively recently, often on the urban fringe. The ranges of incomes and property prices vary, but note that it is not necessarily those on the lowest incomes who are most stretched. Banks have been more willing to lend to these perceived lower risk households but the leverage effect of larger mortgages has a significant impact and the risks are underestimated.
The latest data from The Australian Financial Security Authority, for the December 2017 quarter shows a significant rise in personal insolvency – a bellwether for the financial stress within the Australian community. The total number of personal insolvencies in the December quarter 2017 was 7,578 and increased by 7.4% compared to the December quarter 2016. This year-on-year rise follows a rise of 8.0% in the September quarter 2017.
This is in stark contrast to the latest business conditions survey from NAB. They say that the business confidence index bounced 4pts to +11 index points, the highest level since July 2017, perhaps driven by a stronger global economic backdrop and closes the gap between confidence and business conditions. Business confidence is strongest in trend terms in Queensland and SA and to a lesser extent NSW. Confidence is also reasonable in WA, and is in line with business conditions in the state. Victoria and Tasmania meanwhile are reporting levels of confidence which are lower than their reported level business conditions. But the employment index suggests employment growth may ease back from current extraordinary heights.
The RBA credit aggregates data reported that lending for housing grew 6.3% for the 12 months to December 2017, the same as the previous year, and the monthly growth was 0.4%. Business lending was just 0.2% in December and 3.2% for the year, down on the 5.6% the previous year. Personal credit was flat in December, but down 1.1% over the past year, compared with a fall of 0.9% last year. This is in stark contrast to the Pay Day Loan sector, which is growing fast – at more than 10%, as we discussed on our Blog recently (and not included in the RBA data). Investor loans still make up around 36% of all loans, and a further $1.1 billion of loans were reclassified in the month between investment and owner occupied loans, and in total more than 10% of the investor mortgage book has been reclassified since 2015.
The latest data from APRA, the monthly banking stats for ADI’s shows a growth in total home loan balances to $1.6 trillion, up 0.5%. Within that, lending for owner occupation rose 0.59% from last month to $1.047 trillion while investment loans rose 0.32% to $553 billion. 34.56% of the portfolio are for investment purposes. The portfolio movements within institutions show that Westpac is taking the lion’s share of investment loans (we suggest this involves significant refinancing of existing loans), CBA investment balances fell, while most other players were chasing owner occupied loans. Note the AMP Bank, which looks like a reclassification exercise, and which will distort the numbers – $1.1 billion were reclassified, as we discussed a few moments ago.
Standing back, the momentum in lending is surprisingly strong, and reinforces the need to continue to tighten lending standards. This does not gel with recent home price falls, so something is going to give. Either we will see home prices start to lift, or mortgage momentum will sag. Either way, we are clearly in uncertain territory. Given the CoreLogic mortgage leading indicator stats were down, we suspect lending momentum will slide, following lower home prices. We will publish our Household Finance Confidence Index this coming week where we get an updated read on household intentions. But in the major eastern states at least, don’t bank on future home price growth.
If you found this useful, do like the post, leave a comment or subscribe for future updates. By the way, our special post on Bitcoin will be out in the next few days, we have had to update it based on recent market gyrations.

 Overall, they suggest that development restrictions (interacting with increasing demand) have contributed materially to the significant rise in housing prices in Australia’s largest cities since the late 1990s, pushing prices substantially above the supply costs of their physical inputs.