The ABS Residential Price Series also includes transaction data across the country, separated between houses, and other (described as attached). In some cases units may fall into the house bucket, according to the ABS supporting information, due to weaknesses in the data.
We are able to look at the transaction trends, across each state, and they show that to December 2017, the latest date of publication, the volume of settlements overall are significantly lower.
Here is the all Australia plot. The blue area shows the count of houses, the yellow area the volume of transfers for other than houses. We also plot the annualised growth rates. It shows apartment transfers are down more than 7%, and houses down 6.5% to December 2017.
Looking at the individual markets, Sydney both house and unit transfers are more than 8% down to December 2017.
Across the rest of NSW, house transfers are down 3.8% and unit transfers are down 5.8%.
Turning to Melbourne, still seen by many as the “leading market”, houses are down 7.8% and units and apartments, down 10.4% to December 2017.
Across the rest of the state, units were down 8.4% and houses down 7.1%.
So up to Brisbane, where both house and unit transfers have fallen by more than 7% to December 2017.
We can also see falls across the rest of the state, again looking at houses and unit transfers, both of which fell by more than 7%.
Next we go to South Australia. Here in this smaller, yet slightly more buoyant market units were up in Adelaide by 1.2%, whilst house transfers were down 2.8%.
Across the rest of SA, unit transfers were up 5.1% while houses were down 3.8%.
Then across to WA. Here of course property has been under pressure for some time, following a peak in 2009-10 and 2013. In Perth, unit transfers were down 1% and houses up 1.6%.
Across the rest of WA both unit and houses grew by 3.6% and 2.5% respectively.
In Tasmania, another “growth” state, transfers in Hobart were down 3.7% for units, and 7.7% for houses to December 2017
Beyond Hobart, across the rest of the state, house transfers were down 5.1% and units were down 6.9%.
In Darwin, unit transfers rose by 2%, while houses fell 4.7% to December 2017.
Across the rest of NT, unit transfers fell 6.8% and houses rose 2%
Finally, in Canberra, houses fell a significant 7.2% to December 2017, and units a massive 16.5%.
Standing back we see that units in particular have lost momentum, thanks to the lack of momentum in the investment sector, in particular. But more importantly, this data was set before the more recent lending tightening has hit, so expect to see more falls in transaction volumes ahead.
Welcome to the Property Imperative Weekly to 07 April 2018.
Watch the video, or read the transcript.
In this week’s digest of finance and property news, we start with Paul Keating’s (he of the recession we had to have fame), comment that the housing boom is really over at the recent AFR conference.
He said that the banks were facing tighter controls as a result of the Basel rules on capital adequacy, while financial regulators had had a “gutful” of them. This was likely to lead to changes that would restrict the banks’ ability to lend. He cited APRA’s recent interventions in interest only loans as one example, as they restrict their growth. Keating also said the royal commission into misconduct in the banking and financial services sector would also “make life harder” for the banks and pointed out that banks did not really want to lend to business these days and would “rather just do housing loans”. Finally, he spoke of the “misincentives” within the big banks to grow their business by writing new mortgages, including having a high proportion of interest-only lending.
Anna Bligh speaking at the AFR event, marked last Tuesday her first year as CEO of the Australian Banking Association (ABA) – but said she feels “like 500 years” have already passed. Commenting on the Royal Commission she warned that credit could become tighter ahead. The was she said an opportunity for a major reset, not only in how we do banking but how we think about it, its place in our lives, its role in our economy and, most of all, it’s trustworthiness”.
At the same conference, Rod Simms the Chair of the ACCC speech “Synchronised swimming versus competition in banking” He discussed the results of their recent investigation into mortgage pricing, and also discussed the broader issues of competition versus financial stability in banking. He warned that the industry should be aware of, and respond to, the fact that the drive for consumers to get a better deal out of banking is shared by many beyond the ACCC. Every household in Australia is watching. You can watch our video blog on this for more details.
He specifically called out a lack of vigorous mortgage price competition between the five big Banks, hence “synchronised swimming”. Indeed, he says discounting is not synonymous with vigorous price competition. They saw evidence of communications “referring to the need to avoid disrupting mutually beneficial pricing outcomes”.
He also said residential mortgages and personal banking more generally make one of the strongest cases for data portability and data access by customers to overcome the inertia of changing lenders.
Finally, on competition. he says if we continue to insulate our major banks from the consequences of their poor decisions, we risk stifling the cultural change many say is needed within our major banks to put the needs of their customers first. Vigorous competition is a powerful mechanism for driving improved efficiency, and also for driving improved price and service offerings to customers. It can in fact lead to better stability outcomes.
This puts the ACCC at odds with APRA who recent again stated their preference for financial stability over competition – yet in fact these two elements are not necessarily polar opposites!
Then there was the report from the good people at UBS has published further analysis of the mortgage market, arguing that the Royal Commission outcomes are likely to drive a further material tightening in mortgage underwriting. As a result, they think households “borrowing power” could drop by ~35%, mainly thanks to changes to analysis of expenses, as the HEM benchmark, so much critised in the Inquiry, is revised. Their starting point assumes a family of four has living expenses equal to the HEM ‘Basic’ benchmark of $32,400 p.a. (ie less than the Old Age Pension). This is broadly consistent with the Major banks’ lending practices through 2017. As a result, the borrowing limits provided by the banks’ home loan calculators fell by ~35% (Loan-to-Income ratio fell from ~5-6x to ~3-4x). This leads to a reduction in housing credit and a further potential fall in home prices.
Our latest mortgage stress data, which was picked by Channel Nine and 2GB, thanks to Ross Greenwood, Across Australia, more than 956,000 households are estimated to be now in mortgage stress (last month 924,500). This equates to 30.0% of households. In addition, more than 21,000 of these are in severe stress, no change from last month. We estimate that more than 55,000 households risk 30-day default in the next 12 months. We expect bank portfolio losses to be around 2.8 basis points, though with losses in WA are higher at 4.9 basis points. Flat wages growth, rising living costs and higher real mortgage rates are all adding to the burden. This is not sustainable and we are expecting lending growth to continue to moderate in the months ahead as underwriting standards are tightened and home prices fall further”. The latest household debt to income ratio is now at a record 188.6. You can watch our separate video blog on this important topic.
ABS data this week showed The number of dwellings approved in Australia fell for the fifth straight month in February 2018 in trend terms with a 0.1 per cent decline. Approvals for private sector houses have remained stable at around 10,000 for a number of months. But unit approvals have fallen for five months. Overall, building activity continues to slow from its record high in 2016. And the sizeable fall in the number of apartments and high density dwellings being approved comes at a time when a near record volume are currently under construction. If you assume 18-24 months between approval and completion, then we still have 150,000 or more units, mainly in the eastern urban centres to come on stream. More downward pressure on home prices. This helps to explain the rise in 100% loans on offer via some developers plus additional incentives to try to shift already built, or under construction property.
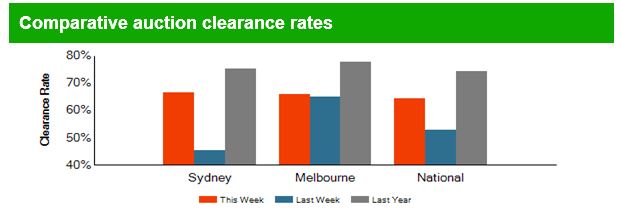
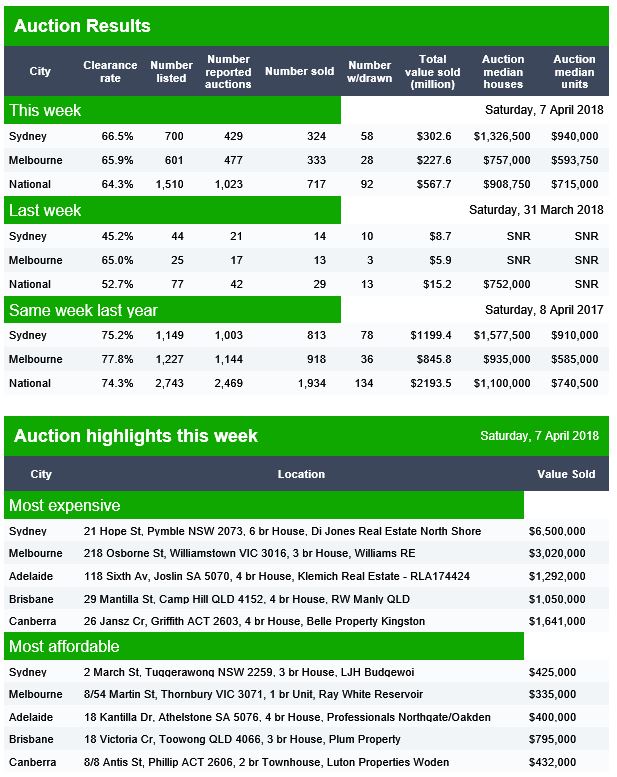
CoreLogic reported last week’s Easter period slowdown saw 670 homes taken to auction across the combined capital cities, down significantly on the week prior when a record number of auctions were held (3,990). The lower volumes last week returned a higher final clearance rate, with 64.8 per cent of homes selling, increasing on the 62.7 per cent the previous week. Both clearance rate and auctions volumes fell across Melbourne last week, with only 152 held and 65.5 per cent clearing, down on the week prior when 2,071 auctions were held across the city returning a slightly higher 65.8 per cent success rate.
Sydney had the highest volume of auctions of all the capital city auction markets last week, with 394 held and a clearance rate of 67.9 per cent, increasing on the previous week’s 61.1 per cent across a higher 1,383 auctions.
Across the smaller capital cities, clearance rates improved week-on-week in Canberra, Perth and Tasmania; however, volumes were significantly lower across each market last week compared to the week prior.
Across the non-capital city auction markets, the Geelong region recorded the strongest clearance rate last week with 100 per cent of the 20 auction results reporting as successful.
The number of homes scheduled to go to auction this week will increase across the combined capital cities with 1,679 currently being tracked by CoreLogic, up from last week when only 670 auctions were held over the Easter period slowdown.
Melbourne is expected to see the most significant increase in volumes this, with 669 properties scheduled for auction, up from 152 auctions held last week. In Sydney, 725 homes are set to go to auction this week, increasing on the 394 held last week.
Outside of Sydney and Melbourne, each of the remaining capital cities will see a higher number of auctions this week compared to last week.
Overall auction activity is set to be lower than one year ago, when 3,517 were held over what was the pre-Easter week last year.
Finally, with local news all looking quite negative, let’s look across to the USA as the most powerful banker in the world, JPMorgan Chase CEO Jamie Dimon, just released his annual letter to shareholders. Given his bank’s massive size (it earned $24.4 billion on $103.6 billion in revenue last year) and reach (it’s a giant in consumer/commercial banking, investment banking and wealth management), Dimon has his figure on the financial pulse.
He says that’s while the US economy seems healthy today and he’s bullish for the “next year or so” he admits that the US is facing some serious economic headwinds.
For one, he’s concerned the unwinding of quantitative easing (QE) could have unintended consequences. Remember- QE is just a fancy name for the trillions of dollars that the Federal Reserve conjured out of thin air.
He said – Since QE has never been done on this scale and we don’t completely know the myriad effects it has had on asset prices, confidence, capital expenditures and other factors, we cannot possibly know all of the effects of its reversal.
We have to deal with the possibility that at one point, the Federal Reserve and other central banks may have to take more drastic action than they currently anticipate – reacting to the markets, not guiding the markets.
And of course the DOW finished the week on a down trend, down 2.34%, and wiping out all the value gained this year, and volatility is way up. Here is a plot of the DOW.
This extreme volatility does suggest the bull market is nearing its end… if it hasn’t ended already. Dimon seems pretty sure we’re in for more volatility and higher interest rates. One scenario that would require higher rates from the Fed is higher inflation:
If growth in America is accelerating, which it seems to be, and any remaining slack in the labor markets is disappearing – and wages start going up, as do commodity prices – then it is not an unreasonable possibility that inflation could go higher than people might expect.
As a result, the Federal Reserve will also need to raise rates faster and higher than people might expect. In this case, markets will get more volatile as all asset prices adjust to a new and maybe not-so-positive environment.
Now– here’s the important part. For the past ten years, the largest buyer of US government debt was the Federal Reserve. But now that QE has ended, the US government just lost its biggest lender.
Dimon thinks other major buyers, including foreign central banks, the Chinese, etc. could also reduce their purchases of US government debt. That, coupled with the US government’s ongoing trade deficits (which will be funded by issuing debt), could also lead to higher rates…
So we could be going into a situation where the Fed will have to raise rates faster and/ or sell more securities, which certainly could lead to more uncertainty and market volatility. Whether this would lead to a recession or not, we don’t know.
We’ll leave you with one final point from Jamie Dimon. He acknowledges markets have a mind of their own, regardless of what the fundamentals say. And he sees a real risk “that volatile and declining markets can lead to a market panic.”
Financial markets have a life of their own and are sometimes barely connected to the real economy (most people don’t pay much attention to the financial markets nor do the markets affect them very much). Volatile markets and/or declining markets generally have been a reaction to the economic environment. Most of the major downturns in the market since the Great Depression reflect negative future expectations due to a potential or real recession. In almost all of these cases, stock markets fell, credit losses increased and credit spreads rose, among other disruptions. The biggest negative effect of volatile markets is that it can create market panic, which could start to slow the growth of the real economy. Because the experience of 2009 is so recent, there is always a chance that people may overreact.
Dimon cautioned investors that interest rates could rise much sooner than they expect. If inflation suddenly comes roaring back. Indeed, it’s entirely possible the 10-year could break above 4% in the near future as inflation returns to 2% and the Fed shrinks its balance sheet.
Dimon also cast a wary eye toward exchange-traded funds, which have seen their popularity multiply since the financial crisis. There are now many ETF products that are considerably more liquid than their underlying assets. In fact far more money than before (about $9 trillion of assets, which represents about 30% of total mutual fund long-term assets) is managed passively in index funds or ETFs (both of which are very easy to get out of). Some of these funds provide far more liquidity to the customer than the underlying assets in the fund, and it is reasonable to worry about what would happen if these funds went into large liquidation.
And Finally America’s net debt currently stands at 77% of GDP (this is already historically high but not unprecedented). The chart below also shows the Congressional Budget Office’s estimate of the total U.S. debt to GDP, assuming a 2% real GDP growth rate. Hopefully, with the right policies they can grow faster than 2%. But more debt does seem on the cards.
And to add to that perspective, we spoke about the recent Brookings report which highlighted the rise in non conforming housing debt in the USA. debt as lending standards are once again being loosened, and risks to mortgage services are rising.
The authors quote former Ginnie Mae president Ted Tozer concerning the stress between Ginnie Mae and their nonbank counterparties.
… Today almost two thirds of Ginnie Mae guaranteed securities are issued by independent mortgage banks. And independent mortgage bankers are using some of the most sophisticated financial engineering that this industry has ever seen. We are also seeing greater dependence on credit lines, securitization involving multiple players, and more frequent trading of servicing rights and all of these things have created a new and challenging environment for Ginnie Mae. . . . In other words, the risk is a lot higher and business models of our issuers are a lot more complex. Add in sharply higher annual volumes, and these risks are amplified many times over. . . . Also, we have depended on sheer luck. Luck that the economy does not fall into recession and increase mortgage delinquencies. Luck that our independent mortgage bankers remain able to access their lines of credit. And luck that nothing critical falls through the cracks…
They say that goldfish have the shortest memory in the Animal Kingdom… something like 3-seconds. But not even a decade after these loans nearly brought down the entire global economy, SUBPRIME IS BACK. In fact it’s one of the fastest growing investments among banks in the United States. Over the last twelve months the subprime volume among US banks doubled, and it’s already on pace to double again this year.
More people are becoming heavily indebted by buying rental properties and shared accommodation is flourishing, as third party tech platforms help people find a place without a real estate agent.
A new report from the Australian Housing and Urban Research Institute explains how the private rental market is changing over time for both landlords and tenants.
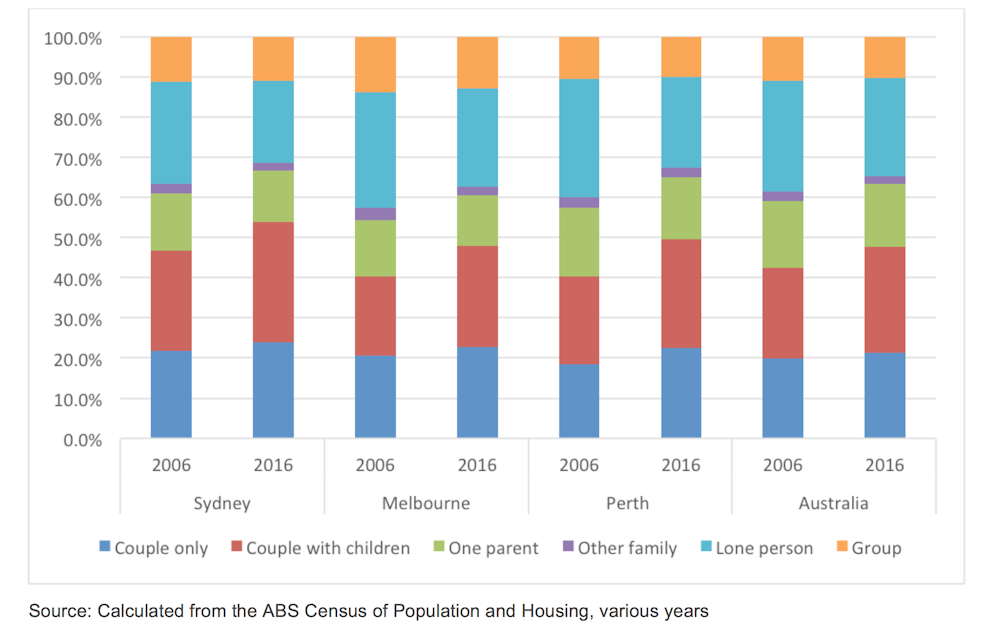
Over the 10 years to 2016, the number of renters grew 38% – twice the rate of household growth. More renters now are couples, or couples with children, so it seems the sector is shaking its image of unstable housing or perhaps these people are left with few other options.
Households by type, 2006 and 2016
Author provided (No reuse)
The report analyses data from the 2016 Census, the 2013-14 Survey of Income and Housing and the 2014 Household, Income and Labour Dynamics in Australia (HILDA) Survey. It also draws on interviews conducted with 42 people involved in all aspects of the private rental sector: financing, provision, access and management.
Rental property ownership also grew. We found the number of households with an interest in a rental property grew and the number that own multiple properties grew slightly as well.
But the typical landlord is still the conventional “mum and dad” investor. Two-thirds of rental investor households have two incomes, and 39% have children.
However they are also mostly high-income and high-wealth households: 60% are in both the highest income and highest wealth bracket. Interestingly, about one in eight landlords is themselves a private renter.
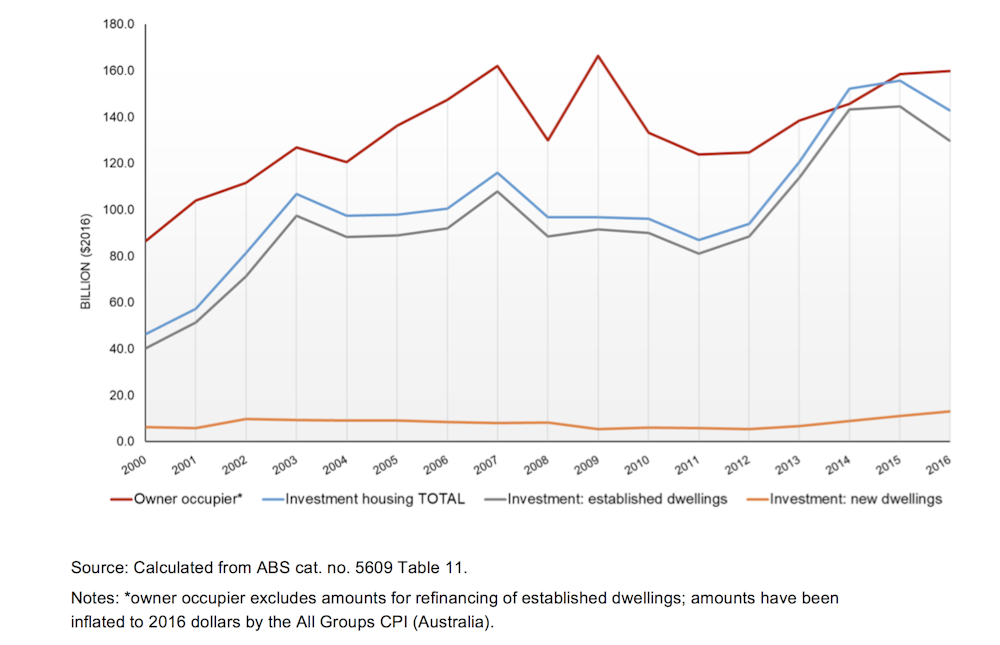
Housing finance ($A), 2000 – 2016
Author provided (No reuse)
The biggest change in ownership is in finances: owners of rental properties are relying more heavily on debt.
Financing rental properties
The people we interviewed highlighted the Australian Prudential Regulation Authorities’ (APRA) guidance to lenders on loan serviceability calculations as having the greatest impact on overall investment levels and investor decisions.
Adding to the complexity is the proliferation of intermediaries, such as mortgage brokers and wealth advisers. These advisers are telling borrowers what lenders and loan products to use to maximise their borrowing power and negotiate lender and regulator requirements.
Houses are the most commonly rented in Australia, but everywhere rental markets are moving away from this and towards dwellings like apartments.
There’s now more diversity in rental properties too. For example the building of high-rise student accommodation, “new generation boarding houses” and granny flats.
These allow landlords to house more people in the one building, increasing revenue and making management more efficient.
The informal sector of shared accommodation appears to be flourishing, like improvising shared rooms and lodging-style accommodation in apartments and houses.
Finding a rental
People have moved from finding rentals in real estate agents’ high street offices and onto online platforms. New third-parties like apps and other digital platforms offer non-cash alternative bond products, schedule property inspections, collect rents, and organise repairs.
Even though these technological innovations avoid agents, they have in fact increased their share of private rental sector management. Agents themselves are use these platforms to change their businesses, and the structure of their industry.
Our research found that revenue from an agency’s property management business (its “rent roll”) has become increasingly important. Some players in the industry are consolidating their businesses around it, to make higher profits from tech-enabled efficiencies.
However, the real estate business still depends on building personal relationships, particularly in high-end markets.
The new tech platforms of the private rental sector raise issues for tenants too, particularly in terms of the personal information they collect. For example, one of the online platform operators told us they looked forward to using applicants’ information to score or rank applicants. Another one of the new alternative bond providers uses automatic “trust scoring” of personal information to price its product.
These innovations may be convenient to use, and may give some tenants an advantage in accessing housing – but at the expense of others who are already disadvantaged.
Rental properties meeting demand?
If the private rental sector is going to meet the demand for settled housing, governments will have to intervene. This can’t be left to technological innovation, or higher income renters exercising their consumer power.
Federal or state governments could create public registers of landlords, or licensing requirements, to police landlords who are not “fit and proper” and exclude them from the sector.
There could also be stronger laws around tenancy conditions and protections for tenants against retaliatory action. The Poverty Inquiry in the 1970s set the basic model of our present laws and they haven’t changed much.
Tenants’ personal information also needs to be protected, to properly take account of the rise of the online application platforms; another is the informal sector, which is currently in a regulatory blindspot.
The popular emphasis on “mum and dad” investors diminishes expectations of landlords. Rental property investment should be regarded as a business that requires skill and effort. As for-profit providers of housing services, landlords should be held to standards that ensure the right to a dignified home life.
Author: Chris Martin, Research Fellow, City Housing, UNSW
Digital platforms are offering people who couldn’t afford a house on their own, the opportunity to divvy up the costs with others. But co-ownership of real estate can be a risky and potentially costly business.
In an environment of high residential prices where families are becoming a smaller proportion of households, and permanent relationships are giving way to transient and more distant connections, digital platforms for co-ownership are filling an emerging need.
Co-ownership permits a whole range of sharing options. For example, it allows an occupant to be a part owner in their own home even if they cannot afford to buy the whole thing. It also permits an investor to take a smaller position as a promise of a better relationship with the tenant.
However, buying or selling a property involves legal, financial, statutory and agency costs that mean that even moving across the road can cost about half a year’s income. This means that you need to be sure of what you are doing and reasonably confident that you will not be changing your mind about your investment too quickly.
Digital platforms like Kohab are using the legal relationship known as “tenancy in common” to facilitate co-ownership. It permits the separate parties to have a defined share of the house and to transfer their interests independently.
But this still presents considerable practical risks. Someone wanting to sell their share of a house is likely to find a limited market of other people willing to take over the part ownership, and they are likely to have a weaker negotiating position in selling.
The remaining co-owners of a house also have no control over who the incoming partner will be. This may limit their preferences in relation to how the property should be managed. It can make remaining with the investment uncomfortable and lead to even more turnover of ownership and the prospects of sale at a discount.
How co-ownership has changed over the years
Shared real estate ownership has been evolving for some time. The strata title system was introduced over 50 years ago when it became necessary for single buildings to be owned by multiple people.
Company title co-ownership was unpopular because the co-owners did not always agree on how to manage their property. It was also unpopular because sale of part-interests was difficult and often settled at a discount to true value.
However, it overcame the problems of management and resale that dogged the earlier company title. This approach used company shares to split ownership of a property between several investors.
Australia was later an innovator in the development of property trusts that applied the company model, but with someone to manage the the shared ownership of complex properties.
These property trusts have blossomed as an investment and are now commonly known by their US name – real estate investment trusts. These trusts usually focus on commercial buildings where they provide a vehicle for small investors to access property investment in major real estate assets.
Where digital platforms come in
Online applications such as DomaCom or BrickX have brought the trust model online and applied it to smaller properties that are not usually the target of these traditional trusts. BrickX for example divides its selected investment properties into 10,000 “bricks” and allows investors to buy bricks.
This permits up to 10,000 owners for an individual property. It also allows small investors to spread their funds across multiple properties to control their risks. DomaCom follows a different strategy to achieve the same goal of allowing a large number of investors to be involved in individual managed investment properties.
Then there’s new apps like Kohab. Its point of difference is that it operates on a smaller and perhaps more intimate scale.
It does not rely on a crowdfunding approach, but uses its online platform to connect owner/occupiers and investors for the purpose of co-ownership. It does not produce real estate investment trusts, but does facilitate the co-ownership of individual dwellings by more than one owner.
In capital cities it is getting harder for individuals and families to afford properties. Co-ownership with others, either as shared occupants, or distant investors, is one way to cross the rent/buy gap. But it’s not without risk
Author: Garrick Small, Associate Professor, CQUniversity Australia
In a further sign of loosening of rules in the US, the Board of Governors of the Federal Reserve System, the Federal Deposit Insurance Corporation, and the Office of the Comptroller of the Currency issued a final rule that increases the threshold for commercial real estate transactions requiring an appraisal from $250,000 to $500,000.
They say the increased threshold will not pose a threat to the safety and soundness of financial institutions. “Commenters opposing an increase to the commercial real estate appraisal threshold asserted that an increase would elevate risks to financial institutions, the banking system, borrowers, small business owners, commercial property owners, and taxpayers. Several of these commenters asserted that the increased risk would not be justified by burden relief”.
The agencies originally proposed to raise the threshold, which has been in place since 1994, to $400,000, but determined that a $500,000 threshold will materially reduce regulatory burden and the number of transactions that require an appraisal. The agencies also determined that the increased threshold will not pose a threat to the safety and soundness of financial institutions.
The final rule allows a financial institution to use an evaluation rather than an appraisal for commercial real estate transactions exempted by the $500,000 threshold. Evaluations provide a market value estimate of the real estate pledged as collateral, but do not have to comply with the Uniform Standards of Professional Appraiser Practices and do not require completion by a state licensed or certified appraiser.
The final rule responds, in part, to concerns financial industry representatives raised that the current threshold level had not kept pace with price appreciation in the commercial real estate market in the 24 years since the threshold was established and about regulatory burden during the Economic Growth and Regulatory Paperwork Reduction Act review process completed in March 2017.
Welcome to the Property Imperative Weekly to 31st March 2018.
Watch the video or read the transcript.
In this week’s review of property and finance news we start with the latest CoreLogic data on home price movements.
Looking at their weekly index, after last week’s brief lift, values fell 0.17% in the past week and as a result Sydney home values have now declined by a cumulative 4.2% over the past 29-weeks, with values also down 4.1% over the past 34 weeks. Sydney’s quarterly growth rate remains firmly negative, down 1.8% according to CoreLogic and annual growth is also down 2.2%.
More granular analysis shows the most significant falls in higher value property, and also in high-rise apartments. Our own analysis, and feedback from our followers is that asking prices are falling quite consistently now, and the same trend is to be see in Brisbane and Melbourne, our largest markets. This despite continued strong migration. We see two trends emerging, more people getting desperate to sell, so putting their property on the market, and having to accept a deeper discount to close a sale.
As we showed this week in our separate videos on the latest results from our surveys, down traders in particular are seeking to release capital now, and there are more than 1 million who want to transact. On the other hand investors are fleeing, though some are now also being forced to sell thanks to the switch from interest only to more expensive principal and interest loans.
This is all consistent with the latest auction results, which Corelogic also reported. They said that volumes last week broke a new record with 3,990 homes taken to auction across the combined capital cities in the lead up to Easter, which exceeded the previous high of 3,908 over the week ending 30th November 2014. The preliminary clearance rate was reported at 65.5%, but the final auction clearance rate fell to 62.7 per cent last week, down from 66.0 per cent across 3,136 auctions the previous week. Over the same week last year, 3,171 auctions were held, returning a significantly stronger clearance rate (74.5 per cent).
CoreLogic said that Melbourne’s clearance rate last week was 65.8 per cent across 2,071 auctions, making it the busiest week on record for the city. In comparison, there were 1,653 auctions held across the city over the previous week, returning a clearance rate of 68.7 per cent. This time last year, 1,607 homes were taken to auction, and a clearance rate of 78.9 per cent was recorded. Sydney was host to 1,383 auctions last week, the most auctions held across the city since the week leading up to Easter 2017 (1,436), while over the previous week, 1,093 auctions were held. The clearance rate for Sydney fell to 61.1 per cent, down from 64.8 per cent over the previous week, while this time last year, Sydney’s clearance rate was a stronger 75.8 per cent.
Across the smaller auction markets, auction volumes increased week-on-week, however looking at clearance rates, Adelaide (64.6 per cent) and Canberra (69.1 per cent) were the only cities to see a slight rise in the clearance rate over the week.
The Gold Coast region was the busiest non-capital city region last week with 87 homes taken to auction, while Geelong recorded the highest clearance rate at 79.7 per cent across 75 auctions.
Given the upcoming Easter long weekend, auction volumes are much lower this week with only 540 capital city auctions scheduled; significantly lower than last week when 3,990 auctions were held across the combined capital cities.
The next question to consider is the growth in credit. As we discussed in a separate blog, credit for housing, especially owner occupied mortgages is still running hot. The smoothed 12 months trends from the RBA, out last Thursday, shows annualised owner occupied growth registering 8.1%, up from last month, investor lending falling again down to 2.8% annualised, and business credit at just 3.6%
Looking at the relative value of lending, in seasonally adjusted terms, owner occupied credit rose 0.71% to $1.15 trillion, up $8.08 billion, while investment lending rose 0.12% to $588.3 billion, up just 0.69 billion. Business lending rose 0.17% to $905 billion, up 1.55 billion and personal credit fell 0.15%, down 0.22 billion to $152.2 billion.
Note that the proportion of investment loans fell again down to 33.9%, and the proportion of business lending to all lending remained at 32.4%, and continues to fall from last year. In other words, it is owner occupied housing which is driving credit growth higher – if this reverses, there is a real risk total credit grow will run into reverse. Again, we see the regulators wishing to continue to drive credit higher, to support growth and GDP, yet also piling on more risks, when households are already terribly exposed. They keep hoping business investment and growth will kick in, but their forward projections look “courageous”. Remember it was housing consumption and Government spending on infrastructure which supported the last GDP numbers, not business investment.
Now, let’s compare the total housing lending from the RBA of $1.74 trillion, which includes the non-banks (though delayed, and partial data), with the APRA $1.61 trillion. The gap, $130 billion shows the non-bank sector is growing, as historically, the gap has been closer to $110 billion. This confirms the non-bank sector is active, filling the gap left by banks tightening. Non-banks have weaker controls on their lending, despite the new APRA supervision responsibilities. This is an emerging area of additional risk, as some non-banks are ready and willing to write interest only and non-conforming loans, supported by both new patterns of securitisation (up 13% in recent times) and substantial investment funds from a range of local and international investors and hedge funds.
Once again, we see the regulators late to the party. This continues the US 2005-6 playbook where non-conforming loans also rose prior to the crash. We are no different.
The ABS released more census data this week, and focussed on the relative advantage and disadvantage across the country. Ku-ring-gai on Sydney’s upper north shore is Australia’s most advantaged Local Government Area (LGA). Another Sydney LGA, Mosman, which includes the affluent suburbs of Balmoral, Beauty Point and Clifton Gardens, has also been ranked among the most advantaged. In fact, SEIFA data shows the 10 most advantaged LGAs in Australia are all located around the Northern and Eastern areas of Sydney Harbour and in coastal Perth.
The most disadvantaged LGA is Cherbourg, approximately 250 kilometres north-west of Brisbane (QLD), followed by West Daly (NT). The 10 most disadvantaged LGAs in Australia can be found in Queensland and the Northern Territory.
The latest data has found that more than 30 per cent of people born in China, South Africa and Malaysia live in advantaged areas and less than 10 per cent reside in disadvantaged areas. Meanwhile, 40 per cent of Vietnamese-born live in disadvantaged areas and only a small proportion (11 per cent) live in advantaged areas.
People of Aboriginal and/or Torres Strait Islander origin are more likely to live in the most disadvantaged areas with 48 per cent living in the bottom fifth most disadvantaged LGAs, compared to 18 per cent of non-Indigenous people. Overall, only 5.4 per cent of Aboriginal and/or Torres Strait Islander people live in areas of high relative advantage compared with 22 per cent of non-Indigenous people.
What the ABS did not show is that there is a strong correlation of those defined as advantaged to valuable real estate – home price rises have both catalysed the economic disparities across the country, and of course show the venerability that more wealthy areas have should home prices fall further. The paper value of property is largely illusory, and of course only crystallises when sold.
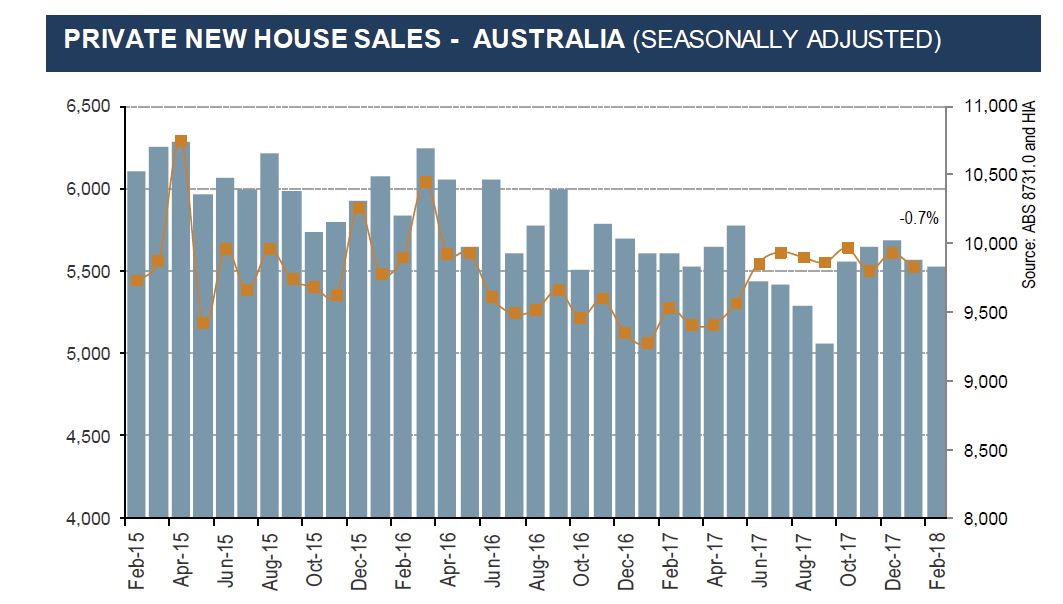
The HIA reported that new home sales declined for the second consecutive month during February 2018 overall, but the markets were patchy, based on results contained in the latest edition of their New Home Sales report – a monthly survey of the largest volume home builders in the five largest states.
Despite the fact that the overall volume of sales declined during February, reductions only occurred in two of the five states covered by the HIA New Home Sales Report – the magnitude of these reductions outweighed the increases which took place elsewhere. The largest fall was in Queensland (-16.3 per cent) with a 9.9 per cent contraction recorded in WA. The largest increase in sales was in NSW (+11.7 per cent), followed by SA (+10.3 per cent) and Victoria (+4.8 per cent).
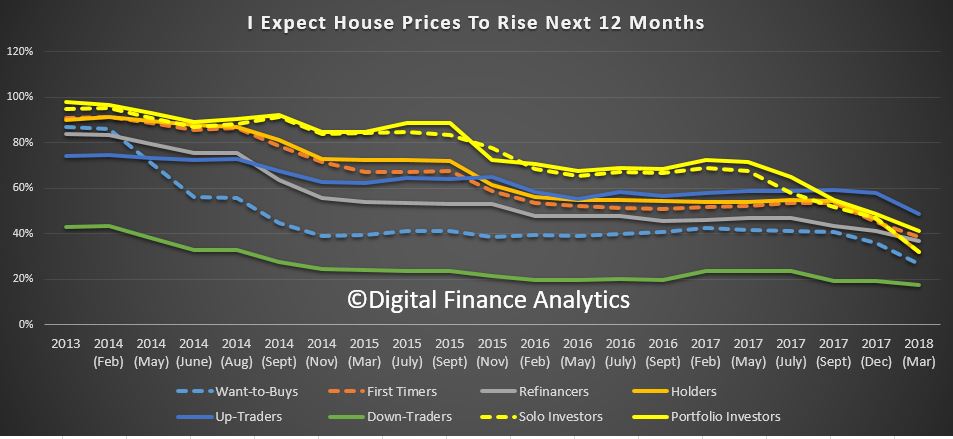
Finally, we walked through our survey results in a series of separate videos, but in summary, the latest release of the Digital Finance Analytics Household Survey to end March 2018, helps to explain why we think home prices are set to fall further by drawing on our 52,000 sample, from across Australia.
This chart, which looks across our property segments, shows that both portfolio property investors (who hold multiple properties) and solo investors (who hold one, or perhaps two) intentions to transact are tanking, down 8% since December 2017. This is because credit is less available, capital growth has stalled, and in fact only the tax breaks remain as an incentive! This decline started in 2015, but is accelerating. Remember that around one thirrd of mortgages are for investment purposes, so as this demand dissipates, the floor on prices starts to shatter.
Whilst there are offsetting rises from down traders (who are seeking to release capital before prices fall further) and first time buyers (who are being “bribed” by first owner grants) there is a significant net fall in demand. This pattern is seen across the country, but is most prevalent in our two biggest markets of Sydney and Melbourne.
Refinancing is up a little, thanks to the attractive discounts being offered by many lenders, and the prime driver is to reduce monthly repayments, as currently household finances are under pressure. We release the latest mortgage stress analysis in a few days.
And if you want to think about the consequences of all this, then watch our commentary on the Four Scenarios which portrays how the property and finance sector may play out, and compare the comments from APRA with those in Ireland in 2007 in our latest video blog – they are eerily similar, and we all know what happened there!
The outlook for finance and property in Australia in decidedly uncertain.
The HIA says sales of new detached houses declined for the second consecutive month during February 2018 overall, but the markets were patchy, based on results contained in the latest edition of their New Home Sales report – a monthly survey of the largest volume home builders in the five largest states.
Despite the fact that the overall volume of sales declined during February, reductions only occurred in two of the five states covered by the HIA New Home Sales Report – the magnitude of these reductions outweighed the increases which took place elsewhere. The largest fall was in Queensland (-16.3 per cent) with a 9.9 per cent contraction recorded in WA. The largest increase in sales was in NSW (+11.7 per cent), followed by SA (+10.3 per cent) and Victoria (+4.8 per cent).
“The decline in new house sales during the first two months of 2018 is consistent with our expectation that residential building activity will move lower over the next 12 months.
“Tighter restrictions around investor lending and heavier obstacles to foreign investor participation are contributing to the weaker conditions in new dwelling construction.
“New house sales in NSW saw decent growth during February. There were several favourable changes made by the NSW government relating to First Home Buyers last year and these have been beneficial to the state’s housing industry.
“Our forecast is that new home sales will trend downwards during 2018 in line with new home building activity. We expect things to bottom out in late 2019 before modest growth resumes,” concluded HIA Senior Economist Shane Garrett.
The latest release of the Digital Finance Analytics Household Survey to end March 2018, helps to explain why we think home prices are set to fall further. We discussed four housing and property scenarios in a recent video blog.
But drawing on our 52,000 sample, from across Australia, today we will walk through the top-level survey findings, before later drilling into the segment specific data in later posts. You can read about our household segmentation models here. This analysis of course then feeds into our Property Imperative Report, which we publish twice each year as a summary of our research and analysis. The last edition – volume 9 – from 2017 is still available on request.
Read the transcript. or watch the video.
The first chart, which looks across our property segments, shows that both portfolio property investors (who hold multiple properties) and solo investors (who hold one, or perhaps two) intentions to transact are tanking, down 8% since December 2017. As we will see later, this is because credit is less available, capital growth has stalled, and in fact only the tax breaks remain as an incentive! This decline started in 2015, but is accelerating. Remember that 35% of mortgages are for investment purposes, so as this demand dissipates, the floor on prices starts to shatter.
Whilst there are offsetting rises from down traders (who are seeking to release capital before prices fall further) and first time buyers (who are being “bribed” by first owner grants) there is a significant net fall in demand. This pattern is seen across the country, but is most prevalent in our two biggest markets of Sydney and Melbourne.
Refinancing is up a little, thanks to the attractive discounts being offered by many lenders, and as we will see the prime driver is to reduce monthly repayments, as currently household finances are under pressure. We release the latest mortgage stress analysis in a few days.
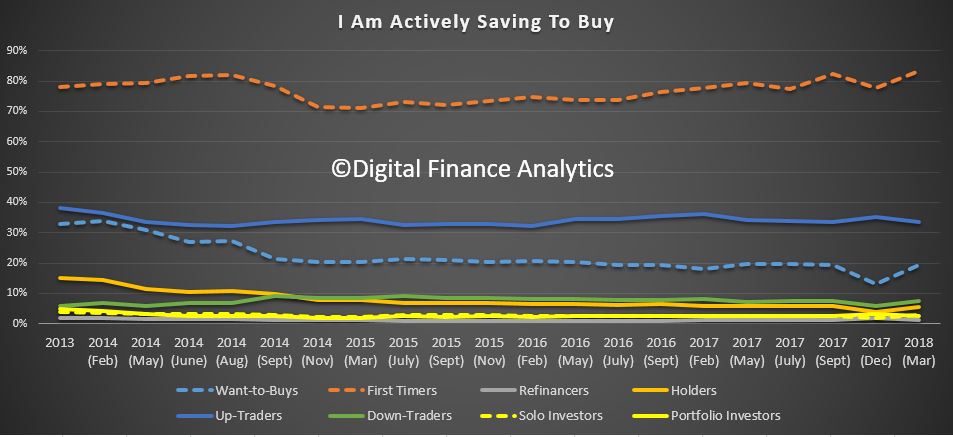
First time buyers and those wanting to buy, are saving a little more in an attempt to access the market, and those planning to trade up are also still putting some funds aside, otherwise, there is little evidence of concerted attempts to save cash for property transactions.
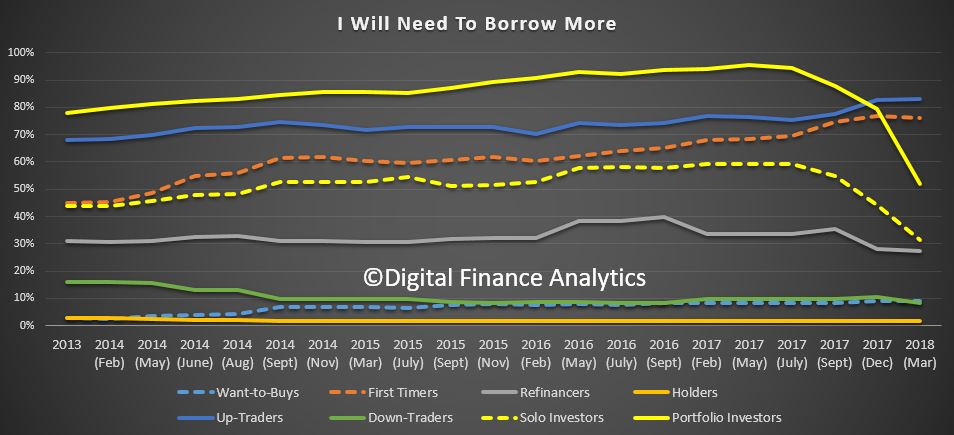
Turning for demand for credit, we see is crashing, especially in the investment segments. There was a 12% fall in the solo property investor group and an amazing 27% fall in the portfolio investor segment. One of the clearest messages from the survey is how much lending standards just got tighter, with an average 20% drop in “borrowing power” compared with a few months ago. As a result many first time buyers and investors simply cannot get credit, because they cannot meet the tighter requirements. The outfall from the Royal Commission will simply exacerbate the situation. There is a strong link between home prices and credit supply, so this will put further downward pressure on property values.
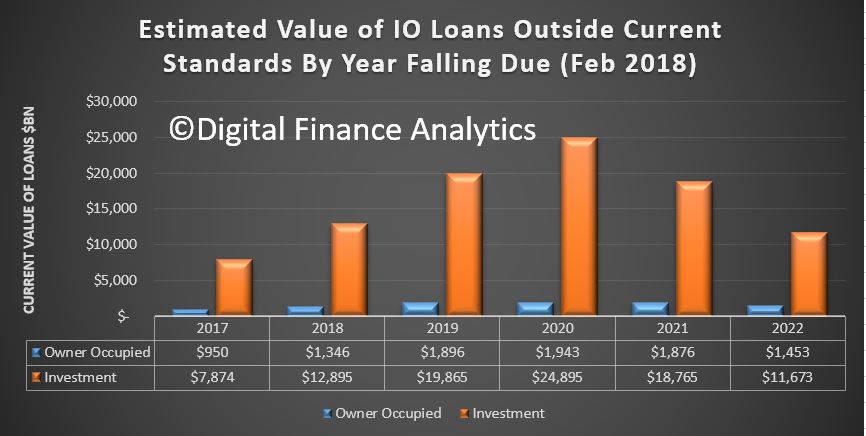
Refinancing households are tending not now to seek to release additional capital from their properties, as part of a refinance deal. We also note a rise in those being forced to refinance from interest only loans to principal and interest loans, and our latest modelling still is tracking an estimated $100 billion problem.
We find that ever fewer households are expecting home prices to rise, this registered across the board – but the trajectory down is strongest among investors. No segment is more bullish on prices compared with last year. This falling trend is strongest in Sydney, but Melbourne appears to be following about 6 months later. Households in Perth and Hobart are more bullish, but only slightly, and this was not enough to prevent the general decline. Remember WA has seen prices slide in recent years.
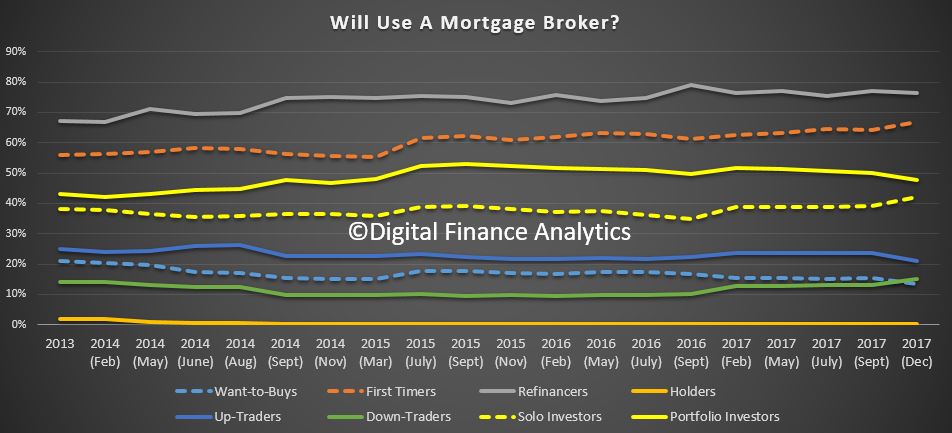
Households use of mortgage brokers appears pretty consistent (even if the volume of transactions is falling). Those seeking to refinance are most likely to approach a broker, followed by first time buyers.
Next time we will look in more detail at the underlying drivers by segments. But current home prices appear to have no visible means of support – they are going to fall further.