Super and personal tax tweaks will drive more people into the property market

From The Conversation.

Australia’s federal government clearly sees its program of annual reductions in the company tax rate as the core element in its plan for “jobs and growth”.

There is now a large – though by no means uncontested – body of evidence to support the contention that reductions in company tax rates can support faster rates of GDP growth and higher wages. It does this by stimulating higher levels of investment and hence higher levels of labour productivity.

But there is very little evidence supporting the favouring of small businesses over large in this regard. The significant preference which both this budget and its predecessor have extended to small businesses appears to owe much more to a desire to bow before small business than to any unambiguous economic rationale.

Small businesses have accounted for only 18% of the increase in employment over the most recent five years for which data are available, while firms with more than 200 employees – which the ABS defines as “large” – have accounted for 52% of the increase in total employment over the past five years, despite accounting for less than 32% of total employment. And large businesses are more likely to engage in “innovative activities” than small ones, especially ones with four or fewer employees.

In other words, if the government wanted to cut company taxes in a way that was most likely to result in increased job creation or higher levels of innovation (assuming that cutting company taxes would have that effect), it should have cut company taxes for large companies ahead of small ones. But that would have been exceedingly difficult, politically, in the current climate.

Mixed messages

The other key element of the government’s ten year enterprise tax plan is the increase in the tax threshold for the second-top marginal rate from $80,000 to $87,000. The government says this will prevent “average full time wage earners … from moving into the second highest tax bracket”. But when you consider the difference between gross and taxable incomes, and that most people use deductions to reduce their taxable income, $87,000 is far from average.

The budget seems to be saying to people with taxable incomes of less than $80,000 – if you want to pay less tax, get yourself a negatively-geared property investment.

The budget is also arguably saying the same thing to people with taxable incomes of more than $250,000, people who have already contributed $500,000 to superannuation over the course of their lifetimes, or people who already have at least $1.6mn in their superannuation accounts. The message is if you put any more into superannuation, we are going to tax you more, but if you put it into a negatively-geared property investment, we won’t touch you, because (in the words of the Treasurer’s Budget Speech), “that would increase the tax burden on Australians just trying to invest and provide a future for their families”.

I am quite comfortable with the budget’s proposed changes to superannuation arrangements. But I can’t see why people – even wealthy people – who are “just trying to invest” through superannuation should be singled out for less generous tax treatment, while people who are doing exactly the same thing through negatively geared property (or other) investments should remain unscathed.

The Treasurer reportedly toyed with the idea of limiting “excesses and abuses” of negative gearing, with caps on claims. This would have more or less exactly paralleled what the budget seeks to do with regard to superannuation.

The decision not to go down that path was reportedly “a political – and not an economic – move”.

But it has, and will have, economic consequences.

Combined with the Reserve Bank’s latest cut in official interest rates, the budget’s decisions and non-decisions with regard to income tax cuts, superannuation and negative gearing are likely to encourage more Australians to borrow more money in order to invest in the property market. At a time when Australia has one of the developed world’s highest ratios of household debt to GDP or personal income, and amongst the developed world’s most expensive residential real estate.

Author: Saul Eslake, Vice-Chancellor’s Fellow, University of Tasmania

ABC Four Corners Does The Housing Boom

Last night the ABC aired a programme on the housing boom. It focused on the impact property investors are having on driving home prices higher and making access to property ever more difficult for owner occupied purchasers who are trying to enter the market. Whilst there was little that was new to followers of this blog, one segment looking at the high rate of vacant units in the Melbourne high-rise developments was striking.

Also, there was evidence of applications being “tweaked” to make incomes higher, such that a loan would pass underwriting muster. Some are suggesting this is a prevalent practice, and links to poor bank culture.

You can read the transcript across at the ABC site, and watch the programme (if you are not Geo-blocked).

Here is the segment on Melbourne’s ghost apartments.

I think the missing element for me was the fact that this is an intentional strategy, led by the Reserve Bank to make housing, and households do the heavy lifting as the mining boom fades. No surprise then that loan to income ratios are off.

The long term implications of this policy have yet to come home to roost.

Auction Clearance Rates Up This Week

From Core Logic RP Data.

Preliminary results show 71.3 per cent of the 2,231 reported results were successful this week, up marginally from a final auction clearance rate of 69.7 per cent last week and lower when compared to one year ago (78.6 per cent). This week 2,651 capital city auctions were held, much higher than last week when 1,565 were held and comparable with the same time last year (2,540). Each individual capital city market has seen a rise in auction volumes over the week, while clearance rates have been somewhat varied.

20160502 Capital City

Foreign Investors in Victoria Get Stamp Duty Hit

The 2016/17 Victorian Budget will increase the stamp duty surcharge on foreign buyers of residential real estate from 3 per cent to 7 per cent, and apply to contracts signed on or after 1 July 2016. The land tax surcharge on absentee owners will also rise from 0.5 per cent to 1.5 per cent from the 2017 land tax year. The measures are expected to raise $486 million over the next four years. Treasurer Tim Pallas said “No Victorians will pay these surcharges. This is about ensuring foreign owners pay their fair share.”

The Andrews Labor Government is taking action to ensure foreign buyers of residential real estate contribute their fair share to the liveability of our state.

It is only fair that foreign buyers – who do not pay taxes such as payroll tax and GST – fairly contributed to the maintenance and development of government services and infrastructure, just like Victorian taxpayers do.

There have been sustained and strong levels of foreign purchasing of residential real estate in recent years. This increase will ensure a fair and equitable contribution is made by foreign purchasers of Victorian real estate.

Victoria’s surcharges on foreign owners of residential real estate have been in operation since 1 July 2015 and have had little impact on foreign demand for Victorian dwellings.

Rents continue to rise despite national building boom

From Australian Broker.

Rents in most capital cities continue to rise due to an ongoing shortage of rental properties, according to the March Domain.com.au Rental Report.

Unit rents increased in Sydney, Melbourne, Brisbane, Hobart and Canberra over the March quarter, the report revealed.

Domain.com.au senior economist Dr. Andrew Wilson says rents remain at record levels despite the recent national apartment building boom intending to provide more available rental stock to capital city markets.

“Despite the recent influx of home building, we can expect to see upward pressure on both house and unit rents in most capital cities continuing in the foreseeable future.

“However, the clear exceptions to tight capital city rental markets are Perth and Darwin. Rents in these cities continue to fall reflecting the impact of the downturn in the resource economy and the end of the significant rental demand driven by a fly-in fly-out workforce.”

In Sydney, median unit rents increased sharply over the March quarter. The median unit rent was recorded at $520 per week, whilst for houses it was $530. Sydney unit rents have now increased by 4% over the past year.

Weekly median prices for houses remained unchanged over the March quarter, however, have increased by 1.9% over the year.

“Despite the significant numbers of new apartments entering the market, Sydney unit rents bounced back this quarter with a sharp 4% increase in the median weekly rental. This increase offers no relief for tenants with house rents remaining at record highs and already low vacancy rates continuing to tighten,” Dr Wilson said.

In Melbourne, median weekly unit rentals increased to $380 over the March quarter, reflecting a 4.1% annual increase – the highest unit rental growth rate of all capitals.

Melbourne house rents consolidated at the record $400 per week, an increase of 2.6% over the year.

“It has been a positive quarter for investors in Melbourne with unit rents now rising to record levels and vacancy rates falling, despite an unprecedented new apartment boom. Melbourne house rents remain at peak values as well, with low vacancy rates indicating no relief in sight for tenants,” Dr Wilson said.

House and unit rents in Brisbane increased by 2.5% and 2.7% respectively over the past year. In Adelaide, unit rents remained unchanged while house rents climbed by 2.9%.

House rents rose by a massive 6.1% in Hobart while unit rents rose by 1.8% over the year.  In Canberra, house rents increased by 4.4% over the past year with unit rents up by 1.3%.

Rents in Perth and Darwin, however, declined over the year. The median weekly house rent fell by 11.1% in Perth and unit rents fell by 9.1%. Darwin house and unit rents also fell steeply over the past year, down 15.4% and 13.5% respectively.

New Edition of “The Property Imperative” Just Released

The updated edition of “The Property Imperative”, our flagship report on the residential housing sector, which includes survey data to March 2016 is now available free on request.

From the introduction:

The Property Imperative is published twice each year, drawing data from our ongoing consumer surveys, research and blog. This edition dates from March 2016 and offers our latest perspectives on the ever-changing residential property sector.

As usual, we begin by describing the current state of the market by looking at the activities of different household groups using our recent primary research and other available data.

In this edition, we also look at rental yields, household interest rate sensitivity and the role of mortgage brokers, plus data on negative gearing.

Residential property remains in the cross-hairs of many players who wish to influence the economic, fiscal and social outcomes of Australia. In policy terms, debates around negative gearing and capital gains tax breaks for investment properties have hotted up.

By way of context, the Australian residential property market of 9.53 million dwellings is currently valued at over $5.86 trillion and includes houses, semi-detached dwellings, townhouses, terrace houses, flats, units and apartments. In the past 10 years the total value has more than doubled. It is one of the most significant elements driving the economy, and as a result it is influenced by state and federal policy makers, the Reserve Bank (RBA), banking competition and regulation and other factors. Indeed, the RBA is “banking” on property as a critical element in the current economic transition.

According to the RBA, as at January 2016, total housing loans were a record $1.53 trillion. There are more than 5.4 million housing loans outstanding with an average balance of about $249,000. Approximately 64% of total loan stock is for owner occupied housing, while 36% is for investment purposes. In recent months there has been a restatement of the mix between owner occupied and investment loans, and as a result the true blend is hard to decipher.

The RBA continues to highlight their concerns about potential excesses in the housing market. In addition, Australian Prudential Regulation Authority (APRA) has been tightening regulation of the banks, in terms of supervision of lending standards, the imposition of speed limits on investment lending and has raised capital requirements for some bank. The latest RBA minutes indicates their view is these regulatory changes are slowing investment lending somewhat, though we observe that demand remains, and in absolute terms, borrowing interest rates are low.

As a result, momentum in the market has changed, with growth in investment lending relatively static, but counterpointed by a massive focus on owner occupied refinancing and the rise of differential pricing. In addition, 37% of new loans issued were interest-only loans, a drop from 46% last year as the regulators have been bearing down on the banks’ lending standards.

The story of residential property is far from over!

Request a copy of the report here. Please note this is an archived edition now, so if you are after this version – volume 6 please specify so in the comment section of the request form. Otherwise you will receive the latest edition.


Here’s what David Cameron could learn from a history of social housing

From The Conversation.

There’s a housing crisis engulfing the UK, and London is at its epicentre. In his recent vow to regenerate over 100 so-called “sink estates”, David Cameron would have us understand that public housing has failed: that the result is poor people, living in poorly designed homes, that were poorly managed. But this version of history is not definitive – nor even particularly accurate.

So what can history tell us about what works and what doesn’t, when it comes to housing? As planners and politicians cast about for solutions to the current crisis, the answer may well be found at their feet – or rather, under them.

In 1892, parliament realised that the building of the Blackwall Tunnel would require hundreds of homes to be demolished. This resulted in a new act of parliament, which stated that no work could commence on the tunnel until those evicted had been rehoused. And so, with private builders unable to supply these new homes, the first council housing in London was built.

But while the new estates sheltered those displaced by construction, their rent was still relatively expensive, so the nation’s poor and vulnerable remained in the private rented sector. So-called “slum landlords” routinely exploited the high demand for housing, leaving vulnerable tenants with substandard and overcrowded accommodation.

The pioneers of housing philanthropy – Joseph Rowntree, George Peabody and Octavia Hill, to name a few – battled to tackle poor housing conditions, homelessness and poverty. But it was often difficult to attract the required support from investors for philanthropic housing projects, when the alternative profits from being a slum landlord were so high.

Meanwhile, the government’s view was that – whatever the solution to the urban housing crisis may be – it most certainly was not state-owned housing. The parallels with 2016 are obvious.

Search for solutions

But all that rapidly changed in the first half of the 20th century – particularly following World War I and World War II – as successive governments took greater responsibility for the social welfare of citizens. Building programmes were supported by government grants and subsidies, which allowed rents to drop below market levels and made housing available to lower income households.

The vision of Anuerin Bevan – a key architect of the NHS – was that council housing, owned and managed by local authorities and built to a high standard, would be home to a diverse range of social classes. Bevan’s vision was not achieved in its entirety: some architectural design and building materials did not meet the needs of residents. Even so, by the 1960s, more than 500,000 flats had been added to the housing stock in London alone.

Worse for wear. sarflondondunc, CC BY-NC-ND

From the late 1970s, council housing was seen as increasingly problematic. As well as an ideological shift away from state provision, the government had concerns about the cost of maintaining council-owned houses, and the higher concentration of poor and vulnerable citizens living in them. It appeared that the 20th century’s use of council housing to provide accommodation for lower income households would not be a 21st-century solution.

Instead, the Thatcher government’s Right to Buy policy for council tenants sought to cement the UK as a nation of home owners. As well as being sold off, council housing stock was transferred to housing associations or arms length management organisations. Together with housing cooperatives and mutuals, these new arrangements became known as “social housing” and “registered social landlords”.

The idea was that housing associations would be able to borrow on the markets to invest in their housing stock – making them less dependent on government funding – and that tenants would have a strong influence about housing management decisions. Tenant participation was certainly strengthened in all forms of social housing, particularly where associations were local and community-based. Greater private investment was also secured to enhance housing quality.

Yesterday’s issues today

In 2010, the coalition government began referring to “registered providers of housing”, dropping the “social” altogether. That said, it should be noted that in other countries in the UK, housing policy has moved in different directions since the issue was devolved to the governments of Scotland, Northern Ireland and Wales.

Now, the Conservative government is introducing the Right to Buy for housing association tenants, as well as implementing fixed-term tenancies and the policy that tenants on higher incomes should pay more rent or leave. This all sounds like the final death knell for mixed income, long-term and secure public housing. In its place comes “affordable housing” – a term which is stretched to describe homes costing up to £450,000.

The current housing crisis is displacing lower income families from many parts of our cities. Young people have much worse housing prospects than their parents. Recent research says that in less than ten years time, only the rich will own their homes. And new cases of slum landlords have been reported in London. It is 2016 but, when it comes to housing, in many ways it could actually be 1891.

The key difference now is that we can look to the past for lessons. We have learned that private developers and landlords cannot be the entire solution. We know how to deliver very large scale housing programmes in periods of debt and austerity. And we can do so again now – while avoiding the pitfalls – with a diversity of social housing models and new roles for private developers, landlords and investors.

Author: John Flint, Professor of Town and Regional Planning, University of Sheffield

The Dynamics of US Mortgage Debt in Default

Research from the USA highlights the fact that when house prices fall, and household debt is high, the rise in defaults is more correlated to  the number of households falling behind in their mortgage payments that the debts of those already in default.

From St. Louis Fed Research

The large decrease in US house prices between 2006 and 2011 led to a dramatic increase in mortgage debt defaults. Since then, the share of mortgage debt in default has decreased significantly and is now close to the pre-2006 level. In this essay, we argue that these fluctuations are predominantly the consequence of changes in the number of households falling behind in their mortgage payments (the extensive margin) and not changes in the amount of debt of those in default (the intensive margin). On average, the extensive margin accounts for 78 percent of the increase in the 2006-09 period and 93 percent of the decrease in the 2011-15 period. This information may be useful in designing prudential policies to mitigate mortgage default.

The analysis is performed using data from the Federal Reserve Bank of New York Consumer Credit Panel/Equifax. In our measure of default, we consider all households with mortgage payments 120 or more days late. Figure 1 shows the share of mortgage debt in default, which fluctuated between 0.7 percent and 1 percent in the 1999-2006 period and then jumped to 7.5 percent in 2009. The figure also shows the evolution of house prices, whose collapse coincided with increasing mortgage defaults. In a recent article, Hatchondo, Martinez, and Sánchez (2015) show how these two series are related: A rapid decrease in house prices causes a sharp increase in mortgage defaults because more households find themselves with negative home equity (“under water”), and some of these households find it beneficial to default after a negative shock to income (i.e., unemployment).

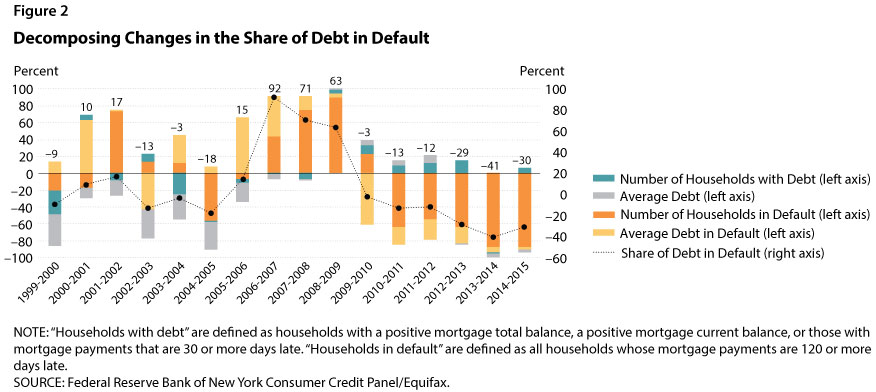
We decompose the changes in the share of debt in default into changes in four different components: average debt in default, number of households in default, average debt, and number of households with debt. Basically, since

we can compute the percentage change (%∆) in the share of debt in default as follows:

Figure 2 shows the results of the decomposition by year; the four colors in each column represent the changes in the four components. The percentage value (shown on the left vertical axis) illustrates the change in the share of debt in default generated by the changes in a particular component. According to the previous equations, the summation of changes in the four components equals the changes in the share of debt in default (represented by the values for the black dots as shown on the right axis). For example, the black dot for 2006-07 has a value of 92, which indicates that the share of debt in default increased by 92 percent in that time period.

There are three interesting findings. First, and most importantly, we find that fluctuations in the number of households in default accounted for most of the fluctuations in the share of debt in default (shown by the size of the orange part of the bars in Figure 2). The share of households in default was very large not only for the years when defaults were increasing (2006 to 2009), but also for the subsequent years when the share of debt in default decreased slowly but steadily. The changes in the number of households in default confirm our earlier claim that the drastic decline in house prices between 2006 and 2009 caused negative home equity for more households. For some of these households a negative income shock triggered default, thus leading to the sharp increase in mortgage debt default. Another reason for this pattern is the delay in foreclosure proceedings that started during the Great Recession. Chan et al. (2015) show that borrowers’ knowledge of a possible long delay between the formal notice of foreclosure and the actual foreclosure sale date affects the likelihood of default: Borrowers who anticipate a longer period of “free rent” have a greater incentive to default on their mortgages.

Second, our results indicate that from 2003 to 2007 the average amount of debt (the gray part of the bars in Figure 2) exerted downward pressure on the share of debt in default. That is, since the average amount of debt was increasing, if the other three components had not increased, the share of debt in default would have decreased.

Finally, we find that the average amount of debt in default (the yellow part of the bars in Figure 2) was important in the 2006-08 period. This finding indicates that part of the increase in the share of debt in default during that period was actually due to an increase in the amount of the debt of households in default. This increase is in line with the fact that the decline in house prices affected households with larger debt (not necessarily subprime loans) that were not falling into default before 2006. When house prices plummeted in 2006, more households from this group defaulted. Later in the recession, the importance of the average amount of debt was overtaken by the number of households in default as more and more households with similar characteristics chose to default.

To summarize, the rapid increases in mortgage debt in default between 2006 and 2011 captured the attention of the public, policymakers, and researchers. It is important to understand the main forces driving the default increase, especially in designing prudential policies that minimize mortgage default such as those analyzed by Hatchondo, Martinez, and Sánchez (2015). The decomposition exercise in this essay suggests that the evolution of the share of mortgage debt in default can be accounted for mostly by changes in the number of households in default rather than changes in the overall amount of mortgage debt and the number of households with mortgages. Changes in the amount of debt in default also played a nonnegligible role, especially during the pre-crisis to early crisis periods.

OO Housing Finance Bounces Back – Refinance Anyone?

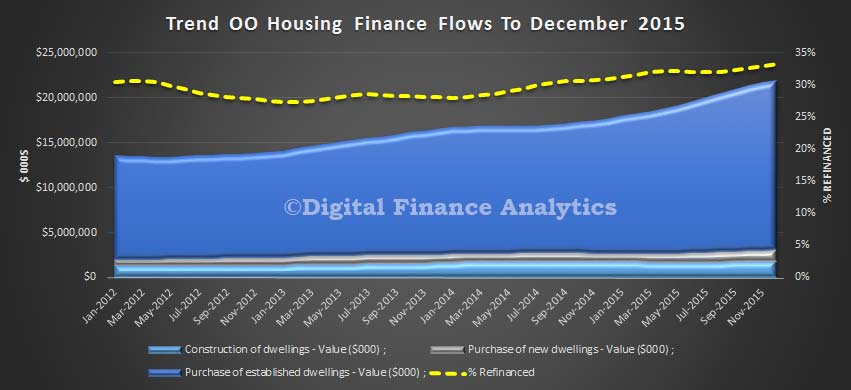
The latest ABS data to December 2015 shows that in the month, trend owner occupied lending grew 1.3%, seasonally adjusted, with $21.3 bn of loans being written.  Construction loans grew 1.4% ($1.9 bn), purchase of new dwellings grew 1.7% ($1.3bn) and purchase of established dwellings by 1.28% ($18.75bn). Refinance continued to grow, with 33% of loans written in the month churned, up 2.3% to $7.29bn.  Overall owner occupied lending, net of refinance grew just 0.8%.

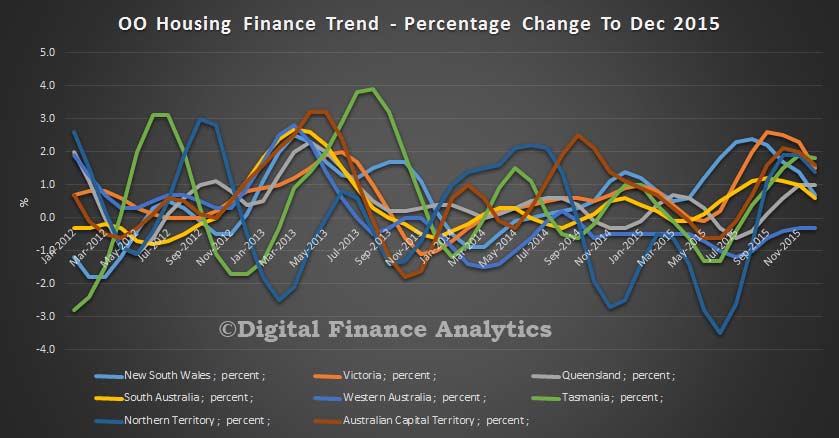
OO-Trends-Dec-2015Looking at state trends, VIC led the way, up 1.5%, QLD at 1%, NSW at 0.7%, SA 0.6%, and WA down 0.3%. But startlingly, TAS reported a rise of 1.8% and NT a rise of 1.4%. The ACT was 1.6% higher. So, WA apart, owner occupied lending grew in every state.

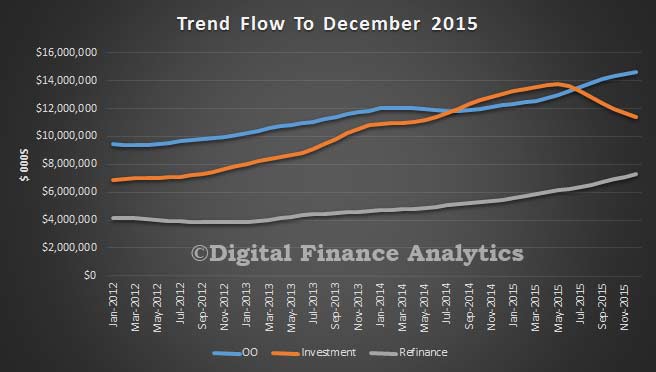
State-Trend-Change-Dec-2015Total finance, including investment loans grew by just 0.025%, investment loans fell 2.36% to 11.4 bn. We see the clear focus of lending is to owner occupied borrowers, and a massive focus on churning loans. We also see a significant rise in the number of fixed rate deals, as households lock in low rates, with the number of deals up 17.2%, whilst secured revolving loans fell 9.8%. This reflects the cheap loan special offers which are currently in the market.

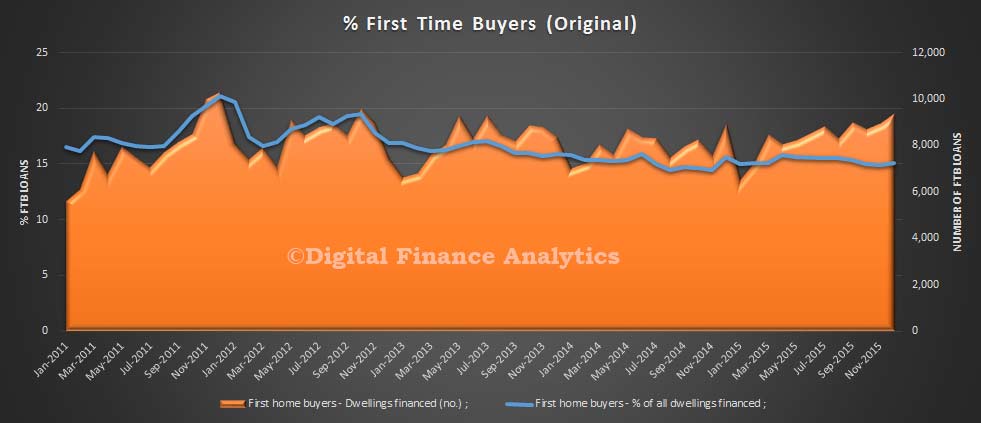
Trend-Flow-Dec-2015First time buyer OO loans grew in December, with a rise of 4.6% on the previous month to make up 15.1% of new loans. This is faster than for non-first time buyer loans, here the number of loans grew 3.1%. The average loan size fell a little in the month, reflecting tighter lending criteria. This is original data, not trend smoothed.

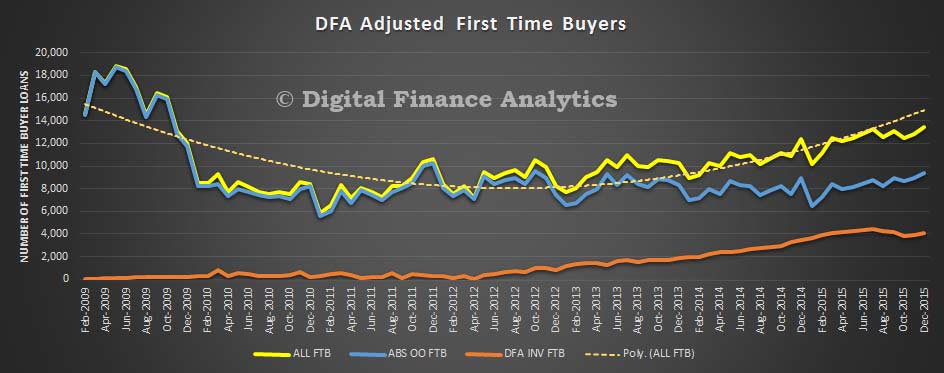
FTB-Orignal-Dec-2015Overlaying first time investors, from our surveys, overall first time buyers were more active, still wanting to get on the property ladder one way or the other. FTB investors grew by 6.5% in the month, after a couple of slow months before. Overall, about 14,000 first time buyer deals were done.

FTB-All-Dec-2015

Owner Occupied Demand Stronger – ME Bank

ME’s latest Property Buying Intentions Report indicates demand for residential property may remain strong over the next 12 months despite prudential changes and tightening of lending criteria for some home buyers. The Report shows a big jump in demand for property by owner occupiers potentially offsetting falling demand by investors, while buyers continue to outnumber sellers.

ME-Property-Jan-2016-2According to the Report:

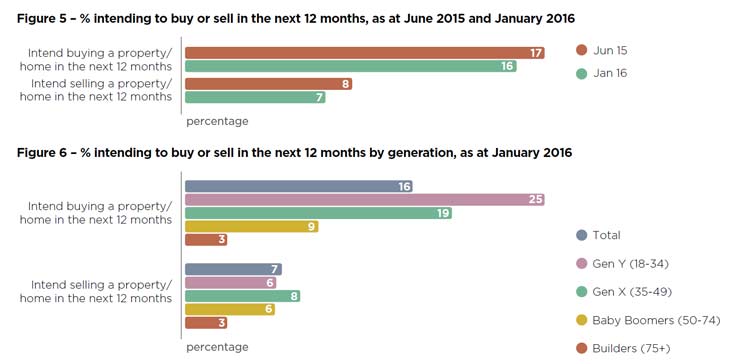
  • In the six months to December 2015, the proportion of Australians intending to buy a property/home fell 1 point to 17%, matched by a correspondingly small fall in the proportion intending to sell a property/home (down 1 point to 7%). Buyers continue to outnumber sellers by more than two-to-one.
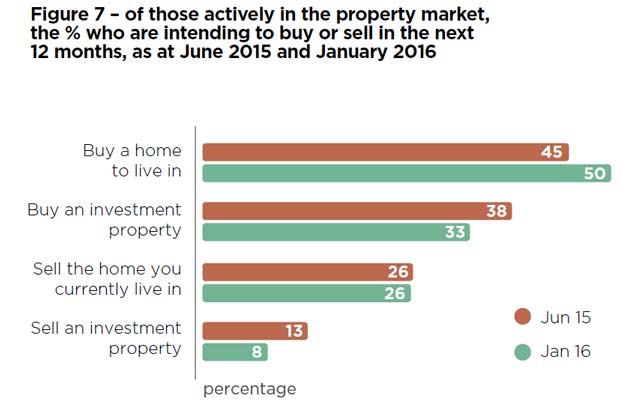
  • Over the same six month period and among those actively looking to buy and/or sell property during 2016, there was a 5 point increase to 50% in the proportion looking to buy a home to live in (owner occupier buyers) offsetting a 5 point fall to 33% in the proportion looking to buy an investment property (investor buyers).
  • Also among those active in the property market, planned sales by home owners remained unchanged over the six months to December at 26%, while there were fewer intended sellers of investment properties (down 5 points to 8%).

ME-Jan-2016-1ME Treasurer, John Caelli, said notwithstanding other factors, the findings indicate property demand pressures from buyers may remain strong over the next 12 months. “While recent tightening in bank prudential regulations and lending criteria have reduced the proportion of investor buyers, overall demand for property may remain strong due to increased demand by owner occupier buyers. “Demand expectations from buyers may also remain strong due to unmet demand from owner occupiers supported by continued low borrowing costs and recent improvements in the labour market.”

Other findings

  • 23% of Gen Y are saving to buy a property to live in and 25% intend to buy a property to live in in the next 12 months, the most of any age group.
  • 10% of Gen X are saving to buy an investment property and 8% intend to buy an investment property in the next 12 months, the most of any age group.
  • The proportion of first home buyers has increased slightly to 22% in the six months to December 2015, up 1 point.
  • Of those actively looking to buy or sell a home to live in in the 12 months, 19% are downsizers, 22% are upgraders and 59% are looking for property with a similar price point.

About the House Buying Intentions Report

ME commissioned DBM Consultants to conduct an online survey of approximately 1,500 Australians aged 18 years and older who do not work in the market research or public relations industries. The population sample was weighted according to ABS statistics on household composition, age, state and employment status to ensure that the results reflected Australian households.