Property Demand Confirmed By Auction Clearance Rates

According to CoreLogic RP Data, the preliminary clearance rate across the combined capital cities rose this week, up from 69.5 per cent the previous week to 70.0 per cent. The level of activity across the capital city auction market was similar to the previous week, with 1,863 auctions held this week, compared to 1,876 last week. Auction activity remains well below the comparable week last year, however, when 2,599 capital city auctions were held and 79.1 per cent cleared. After ANZAC weekend last year, there were five consecutive weeks of more than 2,200 auctions held across the combined capitals; however the same activity hasn’t been replicated this year.

20160523 capital city

High-Rise Post Code Lending Throttled Back

Macquarie is the latest lender to tighten lending criteria on post codes where there are a number of new high rise apartments being built. In a note to brokers, they say that effective now, the LVR ceiling will be dialed back to 70%. Latest approval data shows that at least 200,000 units will flow into the market in coming months, at a time when demand may be slowing, thanks to tighter lending criteria and a reduction in foreign investor loans. Often people will be buying off the plan, and committing to a price, months before the property is built.  Macquarie is also tightening a number of other lending criteria.  Below are some of the hot spots which we have mapped for Melbourne, Sydney, Brisbane, Gold Coast and Cains.

MelRisk SydRisk GoldRisk BrisRisksCairnsRisk


AMP Capital finds strong correlation between direct and listed real estate over the long term

Investors seeking exposure to real estate should consider listed as well as direct given  the returns, diversification and volatility of the asset classes are very similar over the long term, according to AMP Capital.

Don’t tell me it’s not real  estate, a white paper written by AMP Capital Co-Head of Global Listed Real  Estate James Maydew, demonstrates the correlation between listed and direct real estate increases significantly as the investment horizon lengthens. The daily liquidity of listed real estate,  however, means it behaves more like equities if they only invest in the short term.

Mr Maydew said: “Real estate, both listed and direct, is a long-term investment by the very nature of leases that are contractually committed to and the longevity  of the physical assets. The two asset  classes are essentially the same over five years and beyond as the returns are driven by the underlying real estate cash flows they have in common. For investors who want to maximise risk adjusted returns, an asset allocation between both listed and direct should be utilised at different points in the cycle.  Listed real estate can also be a useful proxy for direct for investors  who want to get set in real estate but who are struggling to deploy their capital  given global competition for quality assets.”

The  paper also highlights how listed real estate can be used by investors as a harbinger of what the direct market is likely to do. Analysis of whether real estate investment  trusts (REITs) are trading at a premium or discount to net asset value (NAV) has proven to be an accurate predictor of how the direct market will move in the coming year.

Mr  Maydew explained: “Put very simply, if a REIT trades at a premium to its NAV,  the market believes its assets will appreciate above levels indicated by market  pricing of the underlying direct real estate.  If we look at listed real estate in the US since 1988, whenever prices have been at a premium to NAV, direct real estate appreciated 96 per cent of the time in the following 12 months.”

Globally,  listed real estate is currently trading at a discount to NAV.  The biggest discounts are in Asia, with the US and the UK markets also trading at a discount.  Australian REITs are trading at a slight  premium, with larger premiums ascribed to Continental Europe and the Japanese REIT market.

Mr  Maydew added: “In individual markets where listed real estate is trading at a discount to NAV, the best management teams are taking advantage of strong  pricing in direct real estate markets, selling on-core assets and utilising the proceeds to either de-lever balance sheets or shrink their equity base by returning capital to investors.”

Don’t tell me it’s not real  estate is the first of a series of AMP Capital whitepapers on listed real  estate.  Mr Maydew noted: “More global investors are allocating to listed real estate and they are hungry for knowledge and insights about the asset class.  We intend to release a number of white papers this year on the sector  more broadly as well as a range of diverse individual investment themes such as senior living REITs, shopping malls and the impact of disruptive technology on  real estate.”

The paper can be downloaded here.

Australia may not have the ‘full picture’ of what foreign buyers own

From Australian Broker.

With about one out of four developments bought by foreigners, it is possible that sales of new residential properties to offshore buyers could be much higher than what local banks estimate, according to ratings agency Fitch Ratings. This could raise risk for banks and the economy.

Fitch Ratings’ Andrea Jaehne claims that there was an increase in foreign buyers since 2010, with data from the Foreign Investment Review Board showing an eightfold increase in approvals up to 2015. It is difficult to know the true number of properties sold offshore because there is no required approval for foreigners buying apartments off the plan.

“The condition is they have to market the property into the local market, but often you find them selling it off in Hong Kong, Singapore, and Shanghai,” Jaehne said in a Sydney conference yesterday. “We don’t have a full picture of who is buying this property.”

Foreign buying in some pockets of Sydney and Melbourne is believed to be much higher than the 25 per cent conservative estimate of most banks, with up to 80 per cent of some apartment developments sold directly to offshore buyers.

Regulators and banks have responded to concerns about foreign buyers pushing up property prices by restricting lending for investment properties. This led to dwindling Chinese investors, despite the fact that around 250,000 new apartments are set to hit the market over the next two years.

“Vendors aren’t as confident as they were 12 months ago,” said analyst Cameron Kusher from CoreLogic RP Data. “The rate of price growth is slowing, and people are holding out until the election is done, and then after that, they’ll hold out until spring.”

As a result, Fitch has issued a rare downgrade of five residential mortgage-backed bonds.

So What’s On The Mind Of Property Investors?

Continuing the update of the latest household survey results, today we look at the investment housing sector. Having seen some months of reduced investment lending activity, the most recent ABS data showed a resurgence of investment lending. We think this will continue. As we reported yesterday, we recorded a spike in the proportion of households who were considering an investment property. Looking across all investors, they say it is the tax effective nature of the investment which drives the demand, coupled with appreciating property values. These together provides better returns than savings accounts or shares. The low costs of finance also helps.

May16-Survey-Investors--There are a number of barriers which might stop investors from transacting. Last time the prospect of potential budget changes registered, whereas this time the proportion of investor households who cited this as a reason to avoid transacting dissipated. We see a similar trend relating to changes in regulation. On the other hand, there was a rise in those unable to get funding – from below 5% last year to more than 15% this year, reflecting tighter underwriting requirement. So not everyone can get what they want. Results of the election are in the “Other” category, and hardly registered. Investors seem to assume no change in government. High home prices appear to be less of a barrier now.

May16-Survey-Investor-Barrieres--Looking at solo investors – those who only have one or two investment properties, the prospect of better returns than other investment vehicles is the strongest driver, and the recent cash rate cut has underscored this even more. We see evidence of older investors turning to property instead of bank term deposits (and we see a switch from term deposits to call savings accounts as part of the picture), because of the very low interest rates on offer.

May16-Survey-Super--

Households who are portfolio investors maintain a basket of investment properties. There are 193,000 households in this group (up by 2,000 from the previous survey). The median number of properties held by these households is eight. Some have more than 20!

In addition, we continue to see a rise in those investing via a SMSF (we have yet to detect an impact on the $1.6m cap which was announced in the budget, which of course is only applicable to those in draw down mode, and even then is still tax efficient).

Super-InvestorsHouseholds looking to invest via a SMSF seems to be getting information from a mortgage broker (24%) or internet sources (22%). Financial Planners (7%) lag behind Accountants (14%) and Real Estate Agents (11%).

May16-Survey-SMSFInPty--  Finally, we still find that those who do investment via SMSF do not tend to put all their super savings into property.

Super-Investors-SharesNext time we will look at the latest data relating to first time buyers.

Demand For Property Roars Back To Life

The results from the just updated Digital Finance Analytics Household Surveys shows that after a few wobbly months, demand for property has strengthened. The latest results supplement those found in the Property Imperative Report, which is still available on request. According to the results, lower interest rates, the removal of the negative gearing “risk”, no budget changes, and lower returns from alternative investments all lead to the same conclusion – buy property. We also note that property price rise expectations have risen for some. Over the next few days we will discuss our segment specific findings – looking especially at investors and first time buyers. Today, however we summarise the main trends.

In response to the question, are you expecting to transact in the next 12 months, we see a larger proportion of investors and refinancers expect to be active. Solo investors showed the largest movement compared with the February 2016 data.

May16-Survey-Transact-More than half of households expect property prices to continue to rise in the next 12 months. Uptraders increased their expectations, compared with February, others were a little less bullish. But a fair degree of optimism reigns.

May16-Survey--Prices-Looking at borrowing requirements, we see that demand for more credit remains strong – the 7% growth rate in credit will likely continue. Demand is strongest among investors, but we also see a spike in the refinance sector. This is driven by finance availability, lower and discounted rates and capital extraction.

May16-Survey--BorrowFirst time buyers are saving the hardest, but uptraders also saving.

May16-Survey-Saving-Looking at the barriers to purchase, we see that the availability of finance is now impacting more than 12% of households wishing to transact. This reflects tighter underwriting criteria now in play. Fear of unemployment has fallen as a factor, whilst the expectation of future rate rises has diminished significantly. High prices are still a significant factor.

May16-Survey-Barriers--Finally in this overview, we see that the propensity to use a mortgage brokers remains strong among investors, refinancers and first time buyers.

May16-Survey-Broker--   Next time we will look in more detail at our segment specific analysis. You can read about our segmentation methodology here.

Record high unit construction increases settlement risk

According to CoreLogic RP Data, the recent boom in unit construction has seen record-high levels of unit approvals and construction culminating in a substantial volume of new unit stock, much of which will settle over the next 24 months.

CoreLogic’s new settlement risk report looks at the number of units due to settle over the next 6, 12, 18 and 24 months. This is based on the expected completion of new developments coupled with the number of units being built in these developments.

The first table highlights the number of unit sales over the 12 months to April 2016, the average number of annual unit sales over the five years to April 2016 and the anticipated number of unit completions over the 12 month to April 2017 and 24 months to April 2018. Across the combined capital cities there are 92,102 new units set for completion over the next 12 months with that figure rising to 231,129 over the next 24 months.

Number of expected unit settlement, data to April

2016-05-16--img1

Looking at the expected new unit supply, Sydney and Melbourne predictably have the greatest increases in stock over the next two years. If you compare the volume of stock expected to settle over the next 12 and 24 months to the average number of unit sales annually over the past five years, you can see a big disconnect, particularly in the four largest capital cities. The historic sales figures include sales of both existing and new units keeping in mind that new stock, usually accounts for a smaller slice of total sales than resales of existing stock.

The large volume of new stock, coupled with an ever-growing supply of existing stock which resells means that historic high levels of unit settlements are due to occur over the next two years in most cities. In fact, in Melbourne and Brisbane even a recurrence of the peak year for sales over the next two years wouldn’t represent enough demand to cater for all of the new units set to settle over the coming 24 months.

The second table highlights the SA3 regions nationally that have the highest number of anticipated unit settlements over the next 24 months. Given the much higher number of unit settlements in Sydney and Melbourne, these cities dominate this list with eight and 12 of the regions listed respectively. In Queensland, three regions from Brisbane and one from the Gold Coast are listed while one Perth region is also listed.

SA3 regions nationally with the most expected unit completions over
24 months to Apr-18

2016-05-16--img2

If we compare the capital cities, it becomes evident that most of the stock in Melbourne, Brisbane and Perth is located in inner-city (within 10km radius of the city). Taking a look at Sydney, the new unit supply is more geographically diverse. Yes, there are a lot of new units in inner city areas but there are also plenty in outer areas like Parramatta, Strathfield, Auburn and Kogarah-Rockdale. In some respects this spreads some of the risk around the city rather than other cities where new supply is much more centralised.

The large volume of new unit settlements over the next two years does raise some potential concerns, namely:

  • In many regions, capital growth for units has been substantially lower than that for houses. Many off-the-plan unit buyers would have expected a level of capital growth between contract and settlement.
  • Mortgage lenders have recently tightened their lending criteria and subsequently some people who have committed to purchasing off-the-plan units may not be able to borrow as much as they could at the time of signing the contract.
  • Units are much more likely to be owned by investors. Not only have lenders recently tightened mortgage criteria, they have also increased mortgage rates for investors.
  • Many of the units are coming up for settlement in similar locations and will compete with existing unit stock. With so much stock coming on-line at once there is an increasing concern as to whether settlement valuations will actually meet the contract price of these units.
  • To compound the situation, three of the four largest banks have announced they will no longer be lending to home buyers from overseas which could result in a larger number of contracts not progressing through to settlement, considering a larger proportion of off-the-plan unit sales are to overseas buyers.

Auction Clearances Higher This Week

According to CoreLogic RP Data, whilst auction activity has eased slightly this week, with 1,824 capital city auctions held, down from 2,230 last week, preliminary clearance rate across the combined capital cities strengthened slightly this week, from 67.7 per cent the previous week to 68.9 per cent. One year ago, along with the higher volume of auctions, the clearance rate was also stronger at 77.5 per cent.

20160516 Capital city

Chinese interest in Aussie property up 87% in a year

From Australian Broker.

Property purchase enquiries from Chinese buyers increased by 87% in 2015, according to new data.

The data released by online Chinese property portal Juwai.com show that Chinese buyers made enquires worth USD$34.9 billion over the year, with Victoria ranking as the most popular state.

The top five cities where Chinese buyers directed their property purchase enquires were Melbourne, Sydney, Brisbane, Adelaide and the Gold Coast. Enquiries for Melbourne property increased by 177% in 2015.

Chinese buyers are active across the entire range of prices, but that more than half of Chinese buyers are seeking property in the $200,000 to $500,000 range.

Super and personal tax tweaks will drive more people into the property market

From The Conversation.

Australia’s federal government clearly sees its program of annual reductions in the company tax rate as the core element in its plan for “jobs and growth”.

There is now a large – though by no means uncontested – body of evidence to support the contention that reductions in company tax rates can support faster rates of GDP growth and higher wages. It does this by stimulating higher levels of investment and hence higher levels of labour productivity.

But there is very little evidence supporting the favouring of small businesses over large in this regard. The significant preference which both this budget and its predecessor have extended to small businesses appears to owe much more to a desire to bow before small business than to any unambiguous economic rationale.

Small businesses have accounted for only 18% of the increase in employment over the most recent five years for which data are available, while firms with more than 200 employees – which the ABS defines as “large” – have accounted for 52% of the increase in total employment over the past five years, despite accounting for less than 32% of total employment. And large businesses are more likely to engage in “innovative activities” than small ones, especially ones with four or fewer employees.

In other words, if the government wanted to cut company taxes in a way that was most likely to result in increased job creation or higher levels of innovation (assuming that cutting company taxes would have that effect), it should have cut company taxes for large companies ahead of small ones. But that would have been exceedingly difficult, politically, in the current climate.

Mixed messages

The other key element of the government’s ten year enterprise tax plan is the increase in the tax threshold for the second-top marginal rate from $80,000 to $87,000. The government says this will prevent “average full time wage earners … from moving into the second highest tax bracket”. But when you consider the difference between gross and taxable incomes, and that most people use deductions to reduce their taxable income, $87,000 is far from average.

The budget seems to be saying to people with taxable incomes of less than $80,000 – if you want to pay less tax, get yourself a negatively-geared property investment.

The budget is also arguably saying the same thing to people with taxable incomes of more than $250,000, people who have already contributed $500,000 to superannuation over the course of their lifetimes, or people who already have at least $1.6mn in their superannuation accounts. The message is if you put any more into superannuation, we are going to tax you more, but if you put it into a negatively-geared property investment, we won’t touch you, because (in the words of the Treasurer’s Budget Speech), “that would increase the tax burden on Australians just trying to invest and provide a future for their families”.

I am quite comfortable with the budget’s proposed changes to superannuation arrangements. But I can’t see why people – even wealthy people – who are “just trying to invest” through superannuation should be singled out for less generous tax treatment, while people who are doing exactly the same thing through negatively geared property (or other) investments should remain unscathed.

The Treasurer reportedly toyed with the idea of limiting “excesses and abuses” of negative gearing, with caps on claims. This would have more or less exactly paralleled what the budget seeks to do with regard to superannuation.

The decision not to go down that path was reportedly “a political – and not an economic – move”.

But it has, and will have, economic consequences.

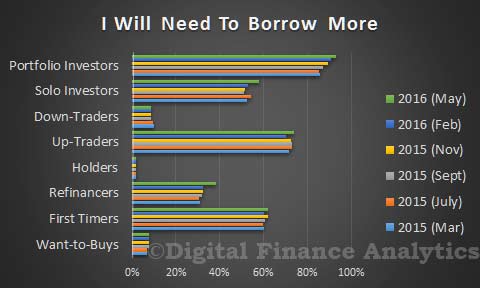
Combined with the Reserve Bank’s latest cut in official interest rates, the budget’s decisions and non-decisions with regard to income tax cuts, superannuation and negative gearing are likely to encourage more Australians to borrow more money in order to invest in the property market. At a time when Australia has one of the developed world’s highest ratios of household debt to GDP or personal income, and amongst the developed world’s most expensive residential real estate.

Author: Saul Eslake, Vice-Chancellor’s Fellow, University of Tasmania