Immigration, Unemployment, Wages and House Prices

From The Conversation.

Australia should cut its immigration intake, according to Tony Abbott in a recent speech at the Sydney Institute. Abbott explicitly cites economic theory in his arguments: “It’s a basic law of economics that increasing the supply of labour depresses wages; and that increasing demand for housing boosts price.”

But this economic analysis is too basic. Yes, supply matters. But so does demand.

While migration has increased labour supply, it has done so primarily in sectors where firms were starved of labour, and at a time of broad economic growth.

Immigration has put pressure on infrastructure, but our problems are more a function of governments failing to upgrade and expand infrastructure, even as migrants pay taxes.

And while migrants do live in houses, the federal government’s fondness for stoking demand and the inactivity of state governments in increasing supply are the real issues affecting affordability.

The economy isn’t a fixed pie

Let’s take Abbott’s claims about immigration one by one, starting with wages.

It’s true that if you increase labour supply that, holding other factors that affect wages constant, wages will decline. However, those other factors are rarely constant.

Notably, if the demand for labour is increasing by more than supply (including new migrants), then wages will rise.

This is a big part of the story when it comes to the relationship between wages and migration in Australia. Large migrant numbers have been an almost constant feature of Australia’s economy since the end of the second world war, if not earlier.

But these migrants typically arrived in the midst of economic growth and rising demand for labour. This is particularly true in recent decades, when we have had one of the longest periods of unbroken growth in the history of the developed world.

In our study of the Australian labour market, we found no relationship between immigration rates and poor outcomes for incumbent Australian workers in terms of wages or jobs.

Australia uses a point system for migration that targets skilled migrants in areas of high labour demand. Business is suffering in these areas. Migrants into these sectors don’t take jobs from anybody else because they are meeting previously unmet demand.

These migrants receive a higher wage than they would in their place of origin, and they allow their new employers to reduce costs. This ultimately leads to lower prices for consumers. Just about everybody benefits.

There’s an idea called the “lump of labour fallacy”, which holds that there is a certain amount of work to be done in an economy, and if you bring in more labour it will increase competition for those jobs.

But migrants also bring capital, investing in houses, appliances, businesses, education and many other things. This increases economic activity and the number of jobs available.

Furthermore, innovation has been shown to be strongly linked to immigration. In the United States, for instance, immigrants apply for patents at twice the rate of non-immigrants. And a large number of studies show that immigrants are over-represented in patents, patent impact and innovative activity in a wide range of countries.

We don’t entirely know why this is. It could be that innovative countries attract migrants, or it could be than migrants help innovation. It’s likely that the effect goes both ways and is a strong argument against curtailing immigration.

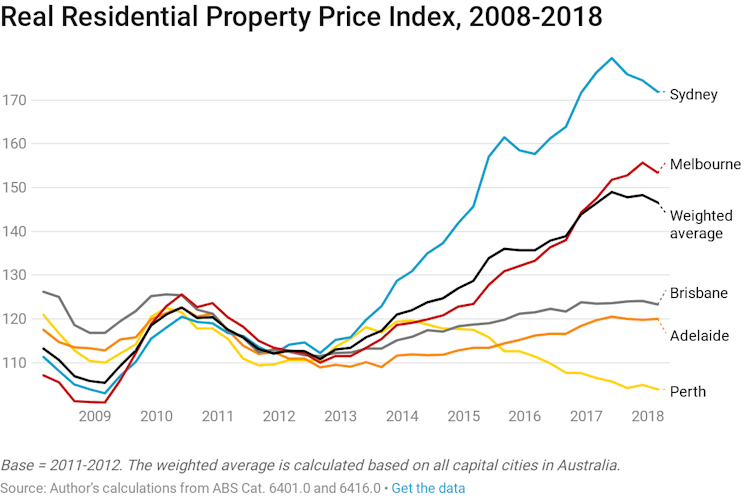
Abbott’s comments are more reasonable in the case of housing affordability because here all other things really are held constant. Specifically, studies show that housing demand is overheated in part by federal government policies (negative gearing and capital gains tax exemptions, for instance) and state governments not doing enough to increase supply.

Governments have responded to high housing prices by further stoking demand, suggesting that people dip into their superannuation, for instance.

In the wake of Abbott’s speech there has been speculation that our current immigration numbers could exacerbate the pressures of automation, artificial intelligence and other labour-saving innovations.

But our understanding of these forces is nascent at best. In previous instances of major technological disruption, like the industrial revolution, the long-run effects on employment were negligible. When ATMs debuted, for example, many bank tellers lost their jobs. But the cost of branches also declined, new branches opened and total employment did not decline.

In his speech, Abbott said that the government needs policies that are principled, practical and popular. What would be popular is if governments across the country could fix our myriad policy problems. Abbott identified some of the big ones – wages, infrastructure and housing affordability.

What would be practical is to identify the causes of these problems and address these directly. Immigration is certainly not a major cause. It would be principled to undertake evidence-based analysis regarding what the causes are and how to address them.

A lot of that has already been done, notably by the Grattan Institute. What remains is for governments to do the politically difficult work of facing the facts.

Authors: Robert Breunig, Professor of Economics, Crawford School of Public Policy, Australian National University; Mark Fabian, Postgraduate student, Australian National University

Brisbane Area Mortgage Stress Mapping

I was asked recently to show the current mortgage stress footprint in the Brisbane area. Ahead of the February stress modelling update, next week, this is the current situation.

Remember we are looking at stress on a cash flow basis, (money in, money out) and some households may have access to savings or credit cards to tide them over, may have paid ahead, or could even sell. But eventually if cash flow is out of equilibrium, it can lead to problems. It is a leading indicator, while defaults is a lagging indicator.

This map is based on the number of households in each post code in mortgage stress. Click on the image to enlarge.

Want A Wage Rise? – Go To The Public Sector (In Victoria)!

The ABS released their wage price data today for the December 2017 Quarter.  You can clearly see the gap between trend public and private sector rates, with the private sector sitting at 1.9% and public sector 2.4%. The CPI was 1.9% in December, so no real growth for more than half of all households! Hardly stellar…

The seasonally adjusted Wage Price Index (WPI) rose 0.6 per cent in December quarter 2017 according to figures released today by the Australian Bureau of Statistics (ABS).

The WPI rose 2.1 per cent through the year seasonally adjusted to December quarter 2017.

ABS Chief Economist Bruce Hockman said “The annual rate of wage growth has increased for the second consecutive quarter reflecting falling unemployment and underemployment rates, and increasing job vacancy levels.”

Seasonally adjusted, private sector wages rose 1.9 per cent and public sector wages grew 2.4 per cent through the year to December quarter 2017.

In original terms, through the year wage growth to the December quarter 2017 ranged from 1.4 per cent for the Mining industry to 2.8 per cent for the Health care and social assistance industry.

Victoria was the highest through the year wage growth of 2.4 per cent and The Northern Territory recorded the lowest of 1.1 per cent.

Property developer joins lending fray

As the property market cools, some developers are getting into the lending game (and of course outside APRA supervision).  First Time Buyers are significant targets.

From Australian Broker.

Property developer Catapult Property Group has launched a new lending division that will help first home buyers get home loans with a deposit of only $5,000.

The Brisbane-based company encourages first home buyers in Queensland to enter the real estate market now by taking advantage of the state government’s $20,000 grant that is ending on 30 June 2018.

Catapult director for residential lending Paul Anderson said first home buyers do not require a 20% deposit plus fees to enter the property market.

“There are many banks that are happy to finance a purchase from as little as 5% deposit and in some cases even less than that,” he said. “When working with property specialists such as Catapult Property Group who have the builder, broker and financial advisors under the one roof, it’s possible to secure a loan with as little as $5,000.”

To get a home loan with a minimal deposit, the company requires that applicants have a full-time job with a stable employment history, a consistent rental payment record, and a clear credit score.

Borrowers may also need to get lenders’ mortgage insurance.

“Mortgage insurance on a $450,000 home purchase with a minimal deposit usually ranges from $7,000 to $14,000, which is added to your mortgage. This is a more realistic means of entering the property market than trying to save a potentially unattainable amount of around $100,000 for a deposit,” said Anderson.

The company says it has almost $130m of residential projects in Queensland and NSW.

Regional Insolvencies Higher than Capital Cities

The latest data from The Australian Financial Security Authority (AFSA), regional personal insolvency statistics for the December quarter 2017, shows that on a relative basis more are in distress in the regions than in the major centres.

That said, there were 7,687 debtors who entered a new personal insolvency in the December quarter 2017 in Australia. Of these, 4,785 debtors or 62.2% were located in greater capital cities.

New South Wales – There were 1,320 debtors who entered a new personal insolvency in Greater Sydney in the December quarter 2017. The regions with the highest number of debtors were Campbelltown (NSW) (91), Wyong (80) and Gosford (74). There were 913 debtors who entered a new personal insolvency in rest of New South Wales in the December quarter 2017. The regions with the highest number of debtors were Newcastle (51), Lower Hunter (41) and Wagga Wagga (40).

Victoria – There were 1,064 debtors who entered new personal insolvencies in Greater Melbourne in the December quarter 2017. The regions with the highest number of debtors were Wyndham (72), Tullamarine – Broadmeadows (65) and Casey – South (63).  There were 367 debtors who entered a new personal insolvency in rest of Victoria in the December quarter 2017. The regions with the highest number of debtors were Geelong (54), Bendigo (33) and Ballarat (29).

Queensland – There were 1,021 debtors who entered a new personal insolvency in Greater Brisbane in the December quarter 2017. The regions with the highest number of debtors were Springfield – Redbank (77), Ipswich Inner (60) and North Lakes (54). There were 1,141 debtors who entered a new personal insolvency in rest of Queensland in the December quarter 2017. The regions with the highest number of debtors were Ormeau – Oxenford (102), Townsville (101), Rockhampton (64) and Toowoomba (64).

South Australia – There were 347 debtors who entered a new personal insolvency in Greater Adelaide in the December quarter 2017. The regions with the highest number of debtors were Salisbury (54), Onkaparinga (41) and Playford (40). There were 106 debtors who entered a new personal insolvency in rest of South Australia in the December quarter 2017. The regions with the highest number of debtors were Eyre Peninsula and South West (20), Murray and Mallee (18) and Barossa (16).

Western Australia – There were 776 debtors who entered a new personal insolvency in Greater Perth in the December quarter 2017. The regions with the highest number of debtors were Wanneroo (114), Rockingham (81) and Swan (81). There were 199 debtors who entered a new personal insolvency in rest of Western Australia in the December quarter 2017. The regions with the highest number of debtors were Bunbury (38), Mid West (27) and Goldfields (25).

Tasmania – There were 89 debtors who entered a new personal insolvency in Greater Hobart in the December quarter 2017. The regions with the highest number of debtors were Hobart – North West (30), Hobart Inner (16) and Brighton (13). There were 110 debtors who entered a new personal insolvency in rest of Tasmania in the December quarter 2017. The regions with the highest number of debtors were Launceston (32), Devonport (25) and Burnie – Ulverstone (20).

Northern Territory – There were 55 debtors who entered a new personal insolvency in Greater Darwin in the December quarter 2017. The regions with the highest number of debtors were Darwin Suburbs (19), Palmerston (14) and Litchfield (12). There were 26 debtors who entered a new personal insolvency in rest of Northern Territory in the December quarter 2017. The regions with the highest number of debtors were Alice Springs (12) and Katherine (8).

Australian Capital Territory – In the December quarter 2017, there were 113 debtors who entered a new personal insolvency in the Australian Capital Territory. The regions with the highest number of debtors were Belconnen (32), Gungahlin (32) and Tuggeranong (30).

Six lessons on how to make affordable housing funding work across Australia

From The Conversation.

A suitable construction funding model is the critical missing ingredient needed to deliver more affordable housing in Australia. Aside from short-lived programs under the Rudd government, we have seen decades of inconsistent and fragmented policies loosely directed at increasing affordable housing. These have failed to generate anything like enough new supply to meet outstanding needs.

Our latest research looked at recently built, larger-scale affordable housing projects in contrasting markets across Australia. We examined each scheme’s cost, funding sources and outcomes. We then developed a housing needs-driven model for understanding the financial and funding requirements to develop affordable housing in the diverse local conditions across the country.

Up to now, the key stumbling block has been the “funding gap” between revenue from rents paid by low-income tenants and the cost of developing and maintaining good-quality housing. The Commonwealth Treasury acknowledged this problem last year. And the problem is greatest in the urban areas where affordable housing is most needed.

What does the new model tell us?

The Affordable Housing Assessment Tool (AHAT) enables the user to calculate cost-effective ways to fund affordable housing to meet specified needs in different markets. It’s a flexible interactive spreadsheet model with an innovative feature: it enables users to embed housing needs as the driver of project and policy, rather than project financial feasibility driving who can be housed.

Affordable housing developments have recently been relatively sparse. However, our research highlighted the varied and bespoke funding arrangements being used.

Despite this variety, too often project outcomes are driven purely by funding opportunities and constraints, rather than by defined housing needs. One notable constraint is the fragmented nature of affordable housing subsidy frameworks both within and across jurisdictions.

Our case study projects generated a diversity of housing outcomes. This can be seen as an unintended positive of the bespoke nature of affordable housing provision as a result of the need to “stitch together” gap funding from multiple sources on a project-by-project basis.

Equally though, the lack of policy coherence and fit-for-purpose funding added cost and complexity to the development process. By implication, this leads to a less-than-optimal outcome for public investment. Despite providers’ best efforts, current approaches are not the most efficient way to deliver much-needed affordable housing.

What are the lessons from this research?

We applied the model to typical housing development scenarios in inner and outer metropolitan areas and regions. By doing so, we identified six key lessons for funding and financing affordable housing delivery.

1) Government help with access to land is central to affordable housing development and enhances long-term project viability.

Especially in high-pressure urban markets, not-for-profit housing developers cannot compete with the private sector for development sites. High land costs, particularly in inner cities where affordable housing demand is most extreme, can render financial viability near impossible. Having access to sites and lower-cost land were two of the most important components of feasible projects.

2) Government equity investment offers considerable potential for delivering feasible projects and net benefit to government.

How governments treat the valuation of public land with potential for affordable housing development must be reviewed. Conventionally, even where affordable housing is the intended use, governments typically insist on a land sale price based on “highest and best use”.

It would be preferable in such cases to treat the below-market value assigned to public land as a transparent subsidy input. This would mean the sale price reflects the housing needs that the development seeks to meet. That is, the land value should be priced as an affordable housing development for a specific needs cohort.

By retaining an equity stake, government could account for its input as an investment that will increase in value over time as land values appreciate.

3) Reducing up-front debt load and lowering finance costs are critical to long-term project viability.

Debt funding imposes a large cost burden over a project’s lifetime. This is ultimately paid down through tenant rents. Reducing both the cost and scale of private financing can have a significant impact on project viability.

The analysis reinforces the rationale for the Australian government’s “bond aggregator” facility for reducing financing costs for affordable housing projects. But this must come in tandem with other measures to reduce up-front debt.

4) Delivery across the range of housing needs helps to meet overall social and tenure mix objectives. This also can help improve project viability through cross-subsidy.

Mixing tenure and tenant profiles can enable affordable housing providers to produce more diverse housing that meets the full range of needs.

Cross-subsidy opportunities arising from mixed-tenure and mixed-use developments can also enhance project feasibility. By improving a provider’s financial position, this helps advance their long-term goal of adding to the stock of affordable housing. And, by providing welcome flexibility, this enables organisations to better manage development risk across different markets and cycles.

5) The financial benefit of planning bonuses is limited

Inclusionary zoning mechanisms impose affordable housing obligations on developers through the planning system. This approach potentially offers a means of securing affordable housing development sites in larger urban renewal or master-planned areas.

However, our research demonstrated that planning bonuses allowing increased dwelling numbers in return for more affordable housing have little beneficial impact on project viability. This is because the additional dwellings allowed generate additional land and/or construction costs but no matching capacity to service a larger debt.

However, planning bonuses can be useful as part of a cross-subsidy approach. In this case, they may support project viability, without necessarily resulting in any additional affordable dwellings.

6) Increasing the scale of not-for-profit provision offers financial benefits that help ensure the long-term delivery of affordable housing.

Our analysis supports the case for targeting public subsidy to not-for-profit developers (government or non-government) to maximise long-term social benefit. Investing in permanently affordable housing ensures the social dividend of affordable housing can be continued into the future.

Comparable subsidies are not preserved when allocated to private owners. They will seek to trade out at some stage, capitalising the subsidy into privatised gain.

The results of our case study analyses and modelling highlight the need to develop comprehensive funding and subsidy arrangements that account for different costs in different locations. These arrangements also must be integrated nationally to support affordable housing delivery at scale.

This study reiterates the common finding of research over the last decade: both Commonwealth and state/territory governments need to develop a coherent and long-term policy framework to provide housing across the full spectrum of need.

Authors: Laurence Troy, Research Fellow, City Futures Research Centre, UNSW; Bill Randolph, Director, City Futures – Faculty Leadership, City Futures Research Centre, Urban Analytics and City Data, Infrastructure in the Built Environment, UNSW; Ryan van den Nouwelant, Senior Research Officer – City Futures Research Centre, UNSW; Vivienne Milligan, Visiting Senior Fellow – City Futures Research Centre, Housing Policy and Practice, UNSW

How Resilient Will Consumption Growth Be If Income Growth Stays Weak?

RBA Assistant Governor (Economic) Luci Ellis spoke at the ABE ConferenceThree Questions About the Outlook“.

The section on the impact of weak income growth is significant, because it examines why households are under financial pressure, and the impact of this.  She says “continued weak income growth presents a particular risk to the consumption outlook in the context of high household indebtedness”.

One aspect of recent developments where Australia’s experience differs, though, relates to household income and consumption. As we discussed in the Statement, consumption growth in the major advanced economies has been quite robust, supported by strong growth in employment. In Australia, we’ve also had especially strong employment growth over the past year – more than double the rate of growth in the working-age population. But that hasn’t translated into strong consumption growth. Household income growth has been weak for a number of years, and that has weighed on consumption growth (Graph 4). Consumption growth hasn’t slowed as much as income growth. This is what you’d expect, given that households generally try to smooth their consumption through episodes of income volatility. But there’s a real question of how long that could continue if income growth stays weak. This clearly has implications for how we think about the risks to our consumption forecasts.

Graph 4
Graph 4: Household Consumption and Income


The weakness in incomes goes beyond the downward pressure on wage growth that I’ve already spoken about. Yes, growth in the wage price index (WPI) has stepped down. But the WPI captures a fixed pool of jobs. It abstracts from compositional change. Average earnings as measured in the national accounts have been even weaker than the WPI (Graph 5). This has not occurred because workers shifted between industries; it is also seen within industries. It might be partly driven by the end of the mining investment boom, as workers moved out of mining-related work, including in the construction and business services industries. But it seems to have been broader than that. Our central forecast is that this weakness will end as the drag from the end of the boom dissipates and spare capacity is absorbed, such that average earnings growth recovers. There is no guarantee of this, though, and therein lies the risk.

Graph 5
Graph 5: WPI and AENA by Sector


The living cost pressures that many households feel have therefore been an income story, not a price inflation story. Although utilities prices did increase significantly in some states in recent quarters, much of households’ regular spending has seen relatively little in the way of price increases for a number of years.

Weak income growth can run below consumption growth for a time, but not forever. If households start to see this weakness in income growth as permanent, they are likely to change their spending patterns in response. We might be seeing this in the details of the consumption figures: growth in spending on discretionary items, like travel and eating out, has slowed while growth in spending on essentials has held up (Graph 6).

Graph 6
Graph 6: Household Consumption


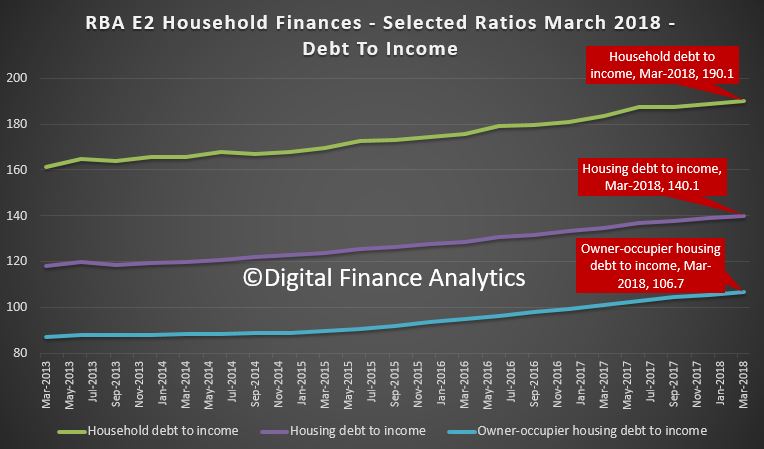
Continued weak income growth presents a particular risk to the consumption outlook in the context of high household indebtedness. Households do not just wake up one day and collectively decide to pay down their debt. But if incomes turn out weaker than they expect, or some other adverse news should arise, the households carrying the most debt might feel they have to rein in their spending quite a bit.


Banks and financial providers one step ahead of consumers who struggle with personal bias

From The Conversation.

There’s more than 30 years of research showing financial consumers have behavioural biases that can lead to poor decisions. Financial providers and banks have known this too, and have designed some products to take advantage of consumer habits rather than benefit them.

Legislation soon to be introduced to parliament is intended to curb these practices, but credit products are being left out to consumer detriment.

Regulators have relied on two strategies to help consumers with this problem. Disclosure of the nature and prospects of the products providers offer. Also, encouraging consumers to seek financial advice.

Neither of these has worked well. The Financial System Inquiry in 2014 recognised that disclosure hasn’t closed the gap in consumer capability. Worse, the providers of these products may have incentives through remuneration which may not serve the customer’s interest and only about 25% of financial consumers seek advice.

The Productivity Commission’s report on competition in financial services, illustrates many of these points in arguing for regulation of mortgage brokers. Brokers are supposed to be the customer’s agent to scout for and advise on the best mortgage terms and cost. Instead they are remunerated by mortgage providers (like the banks), take commissions and, according to the Productivity Commission, generally cost more than loans directly from a bank.

Bias in financial decision-making

Consumers are prone to a range of biases which may also impair their financial decisions. For example overconfidence may cause them to ignore new information or hold unrealistic views about how high returns will be.

As we age or as our circumstances change, our tolerance for risk also changes. As we get older our tolerance for risk decreases, while having a higher income increases it. Men are also more risk tolerant than women.

Consumers may also give too much weight to recent events and things they know already and can be unduly influenced by the opinions of friends and family.

This sort of consumer decision-making is no match for providers’ knowledge of financial conditions and product features. Banks and other financial service providers have learned from experience, but most of all their own command of consumer behaviour research.

The latter leaves providers able to design and sell products that benefit from consumers not overcoming mistakes, or at times, exacerbating mistakes.

Helping customers make better choices

In a bill soon to be before the Australian parliament, those selling financial products will have to make a “target market determination”. This records and describes the market for a product (those who would buy it). It must also set out any conditions under which the product must be distributed, for example that it can only be sold with advice.

It’s designed so that financial products meet the needs and financial situation of the people acquiring them.

There are criminal and civil penalty sanctions for failing to make and ensure products are sold in accordance with a determination. Also, for failure to revise and reissue it, if circumstances change.

Twinned with this requirement are new intervention powers for the Australian Securities and Investments Commission (ASIC). ASIC will be able to make interim rules, effectively prohibiting sales or imposing conditions, if continued sale would result in “significant detriment” to financial consumers.

The purpose of product regulation is clearly to allow ASIC to be more active and reduce over-reliance on ineffective disclosure, conflicted advice and drawn out dispute resolution.

Product regulation is no panacea. This version has a large gap, as credit products (for example credit cards or mortgages) do not require a target market determination. It’s not difficult to read the politics of regulation in this omission. There is also a risk that target market determinations will become pro-forma and add to compliance and not to consumer benefit. Although a description of the target market must be in the advertising, it’s not clear it must be in formal disclosure, so consumers may never read it.

Product intervention powers apply across investment, insurance and credit products but it will never be easy for ASIC to prove the risk of “significant consumer detriment”. Intervention orders also expire in 18 months unless made permanent by parliament.

The regulation of product design and distribution in the spirit of consumer safety has been commonplace (if imperfectly realised) in car, pharmaceuticals and other consumer markets, for decades. There are modest grounds for optimism that in Australia financial product safety might catch on too, but the government needs to include credit products as well.

Authors: Dimity Kingsford Smith, Professor of Law, UNSW

A Viable Alternative To Pay Day Loans

National not-for-profit, Good Shepherd Microfinance, has made a bold move into online lending with the support of NAB to launch Speckle – a fast online cash-loan which offers a better alternative for people seeking small cash loans under $2,000.

They also cite our updated research on the Pay Day Loan market in Australia.

We think this is a significant move, and could tilt the lending landscape towards consumers, who according to our research are more likely to reach for short term credit, thanks to wages and costs of living pressures, and the greater availability on online finance.  Speckle is a cheaper accessible alternative.

With an increasingly casual workforce, the rising cost of living and low wage growth, recent research has found that one in five households in Australia have used payday loans[1] in the past three years. To address this need, Good Shepherd Microfinance, backed by NAB, developed a product that is better for customers by keeping the fees and costs as low as possible.

Adam Mooney, CEO at Good Shepherd Microfinance, said for the first time people will be able to access a low cost alternative that is different to anything else in the market.

“In most cases, Speckle loans are up to 50 per cent cheaper than other small cash loans. Most lenders charge the maximum fees allowed by law. As a not-for-profit program, Speckle is significantly cheaper for customers.”

“Every day we see the negative impact of high cost loans on individuals and families. In addition, the latest research shows that the number of women using short term cash loans continues to increase and women tend to use these loans at an earlier age than men[2].

“It was clear that we needed a better solution for anyone who needs to use small cash loans. Speckle will enable people to access lower cost credit when they need it most,” said Mr Mooney.

Building on their long-term partnership, NAB and Good Shepherd Microfinance have joined forces to develop Speckle using leading edge technology and with the help of skilled volunteers from across the bank.

Andrew Thorburn, NAB CEO said the bank shares Good Shepherd Microfinance’s mission to create fair and affordable financial products that address the gaps in the market.

“We know there are many people who, because of their financial situation don’t typically qualify for mainstream finance, are having to turn to payday loans. We’ve worked with our long-term partner Good Shepherd Microfinance to develop Speckle as a better alternative.

“At NAB, we want to support people to improve their financial resilience so if times get tough they can bounce back better. It’s important that everyone can access appropriate credit. 

Good Shepherd Microfinance also offers no interest or low interest loans and referrals to financial counselling and other services to ensure that people are able to get the financial support they need.

To be eligible for a Speckle loan, applicants must be over 18, earn more than $30,000 a year (not inclusive of government benefits), and can’t have had two or more small amount credit contracts in the past 90 days. Where applicants are deemed unsuitable they are referred to other financial support.

Background:  

About Speckle:

  • Speckle is a fast online cash loan for amounts of $200 – $2,000, that is around half the cost of other similar loans.
  • Speckle’s fees include a 10 per cent establishment fee and two per cent monthly fee compared to the market norm of 20 per cent and four per cent.
  • Repayment options range from three months to one year, and are flexible so customers can pay as early or as often as they wish with no extra fees. Speckle loans are offered by anot for profit organisation which puts customers at the heart of products and services that are fair and affordable.

About Good Shepherd Microfinance and NAB’s partnership:

  • NAB has backed Good Shepherd Microfinance to create Speckle NAB and Good Shepherd Microfinance have been working together for over 15 years to provide people in Australia with access to fair and affordable finance through the No Interest Loan Scheme (NILS) and StepUP low interest loans.
  • The partnership has seen more than $212 million in no and low interest loans provided to over half a million people in Australia doing it tough.
  • Last year more than 27,000 loans valued at almost $30 million were provided to people on low incomes through a national network of more than 180 community organisations in 694 locations across Australia.
  • Good Shepherd Microfinance are leaders in the development and delivery of microfinance programs for people who experience limited access to financial products and services.
  • NAB has committed $130 million for lending to people on low incomes and together with Good Shepherd Microfinance aims to reach 100,000 people each year.

About payday lending in Australia:

  • The use of short term cash loans by households in Australia has more than doubled in the past 12 years (from 356,000 in 2005 to 786,500 in 2017).
  • Use of short term cash loans by women (25.4%) is growing faster than the market growth (22.3%).
  • Women are using cash loans at a younger age than men. In the 20-30 year range, women represent 34% and men 15%.[3]
  • 4 million adults in Australia were facing some level of financial stress in 2016 and around 25 per cent of the population lack access to any form of credit such as a credit card or personal loan.[4]

[1]2018, Digital Finance Analytics, Women and Pay Day Lending – An Update 2018, page 2

[2]2018, Digital Finance Analytics, Women and Pay Day Lending – An Update 2018, page 2 & 4

[3] 2018, Digital Finance Analytics, Women and Pay Day Lending – An Update 2018,

[4] Financial Resilience in Australia 2016, Centre for Social Impact and NAB

Household Financial Confidence Slips Again In January

Digital Finance Analytics has released the January 2018 update of our Household Financial Confidence Index, using data from our rolling 52,000 household surveys.

The news is not good, with a further fall in the composite index to 95.1, compared with 95.7 last month. This is below the neutral setting, and is the eighth consecutive monthly fall below 100.

This result highlights the ongoing disconnect between business confidence, and consumers who are still reeling from rising costs of living, flat incomes and high debt.

Across the age bands, there was a small rise in those older than 50 years, but younger households, from 20 -50 all tracked lower.

There was a significant drop in confidence in Victoria, which has now been overtaken again by New South Wales as the most confident state. Confidence fell in South Australia and Queensland, whilst there was little change in Western Australia, which recovered somewhat earlier in the year.

Household’s property footprint impacts confidence levels significantly, with those who are not property active and so living in rented accommodation sitting significantly below those who own property.  Owner occupied property holders saw a small uplift this month, reflecting the lower refinancing rates available, and more first time buyers. However, property investors, traditionally the more bullish, continues to languish, dragging the whole index lower.

The segmental scorecard shows that whilst job security rose a little, pressure from large levels of debt rose further, with 44% of households less comfortable than a year ago, and only 3% more comfortable.  Pressure on savings continues, with lower returns on deposits, and more dipping into savings to pay the bills. 46% of households were less comfortable with their savings, compared with a year ago, and 4% only were more comfortable.

Costs of living pressures are very real, with 73% of households recording a rise, up 1.5% from last month, and only 3% a fall in their living costs. A litany of costs, from school fees, child care, fuel, electricity and rates all hit home.

On the other hand, only 1% of households records a real rise in incomes compared with a year ago, while 50% said their real incomes had been eroded, and 45% stayed the same. More evidence that incomes are rising more slowly than costs. Those employed in the private sector are particularly hard hit, with many recording no pay rises for the past 2 years.

Finally, household net worth is under pressure for some, as property prices slide, and savings are being eroded (despite high stock market prices). Whilst 58% said wealth had improved, 15% recorded a fall, and 23% said there was no change.  A further fall in property prices was the overwhelming concern of those holding real-estate, with more than half now expecting a fall in the months ahead. This expectation is already impacting their spending patterns, and have reduced their prospect of buying more property.

So, overall we see the ongoing slide in household financial confidence, and there is nothing on the horizon which is likely to change momentum. We expect wages growth to remain contained, and home prices to slide, while costs of living pressures continue to grow.

By way of background, these results are derived from our household surveys, averaged across Australia. We have 52,000 households in our sample at any one time. We include detailed questions covering various aspects of a household’s financial footprint. The index measures how households are feeling about their financial health. To calculate the index we ask questions which cover a number of different dimensions. We start by asking households how confident they are feeling about their job security, whether their real income has risen or fallen in the past year, their view on their costs of living over the same period, whether they have increased their loans and other outstanding debts including credit cards and whether they are saving more than last year. Finally we ask about their overall change in net worth over the past 12 months – by net worth we mean net assets less outstanding debts.

We will update the results again next month.