The employment and wage data from the ABS last week was not flash, with job growth momentum easing, unemployment higher and wages growth continuing at glacial speed.
So its worth asking what is really going on under the hood. To do that we have looked at ABS data over the last decade to drill into the detail. And frankly its not pretty.
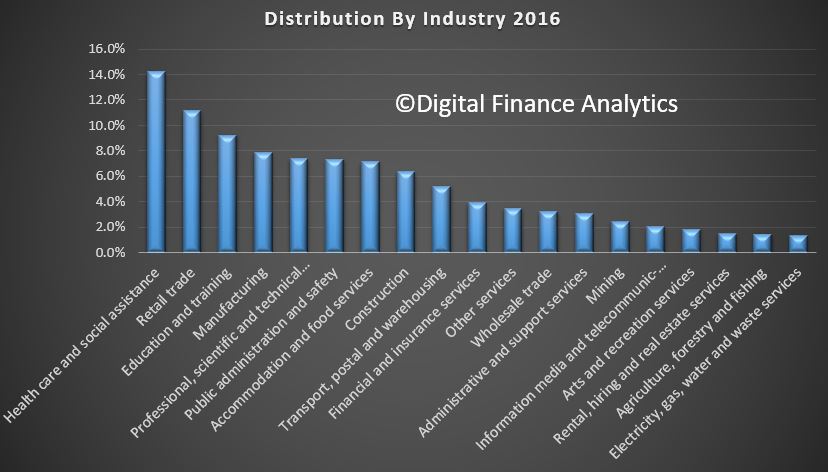
First we looked at employment across the industry sectors. Health care leads the way now at 14.2%, in terms of the number of people employed, followed by retail at 11.1%, education and training at 9.2% and manufacturing at 7.9%. For comparison purposes, about 12 % of the U.S. workforce is employed in the health care sector.
Then we compared the relative distribution by industry groups now, and back in 2005. Over that decade or so there has been a considerable shift in industry distribution.
The fastest growing sector in Health care, which have expanded relatively by 2.7%. The next largest growth sector was Professional and Technical Services at 1.4% and Mining at 1.3%. Construction grew relatively by 1.1%. At the other end of the spectrum, Manufacturing fell by a massive 4.3%, followed by Retail down 1.2% and information technology and media down 0.5%.
Or in other words, relativity more people are working in the health care sector than a decade ago. Drilling further into the data we also see a significant rise in the number of females working in this sector, as well as significant growth in part-time employment in the sector.
The final piece of analysis looks at relative weekly income across specific industry sectors. More than half of all people working in retail earn less than $600 a week. More than half of people in the healthcare sector earn less than $800 a week. Half the average of all industry sectors earns less than $1,000 a week, whilst half of those in the resource and mining sector earn more than $1,800 a week. So Retail and Health care sectors are intrinsically low paid.
Now lets put that together. All this goes some way to explain the shifts in employment and income. The health care sector has been an important generator of jobs in recent years, and health care is expected to continue to expand employment in coming years, but the jobs will continue to shift to low-paying support occupations reflecting changing demographics and greater demand. About 40 percent of the sector’s workers are not directly involved in treating a patient; instead, they work in jobs such as office or administrative work and food preparation. Others are working in health support occupations like home care and personal assistance. These jobs are paid significant less than care practitioners.
But, the health care sector is more labour intensive than other sectors, such as manufacturing, and this translates into a relatively lower share of output. So growth in health care does not guarantee broad-based prosperity because beyond the high pay of health care practitioners, the health care jobs in highest demand pay lower-than-average wages.
In fact the truth is the growth in jobs are in sectors which are service industries, and these to not really create new value, they simply circulate money in the system , perhaps from superannuation savings to pay for medical care.
Thus the growth in jobs in not assisting overall economic growth, and the lower average wages is depressing overall wage growth. Workers in the health care sector are also less likely to press hard for pay rises.
So the bottom line is we have a structural problem in the economy, where more people are doing important work helping those needing health care assistance, but the overall economic contribution impact is net negative, hence the low GDP growth and wages growth. Or in other words, more jobs are not necessarily good or well paid jobs. And that’s a structural problem, given the current demographic shifts. Welcome to the bed pan economy.
Even though house prices have risen substantially over recent decades, housing costs as a share of income have barely shifted in over 20 years. Costs relative to disposable income for housing are largely unchanged, at 17% since 1993, although there has been some increase since 2000.
There is no agreed measure for defining housing affordability, but just looking at house prices can be deceptive. Australian households are roughly equally split between purchasing, renting or owning their house outright.
There is no doubt that house prices increased substantially over recent decades. According to CoreLogic over the past 20 years the median house price in Australia increased from A$140,000 in December 1997 to A$540,000 by December 2017 – an annual increase of 7%. Relative to disposable income this represents a 68% increase over the 20-year period.
Australian households are roughly equally split between purchasing, renting or owning their house outright. Highly inflated house prices are more concerning to people wishing to move from renting to purchasing a house (mostly potential first home buyers).
Housing affordability looks very different when we look at actual housing costs relative to income, rather than just house prices. Housing costs increased substantially between 1984 and 1993.
This was a combination of weak income growth and strong increases in housing costs, particularly mortgages with interest rates increasing sharply over this period. Since peaking in 1993 costs remained relatively stable with rents increasing modestly over the past 10 years, while mortgage costs declined.
Overall, actual housing costs relative to income have remained stable since 1993 at around 16% of disposable income.
We split households into five equal groups from lowest 20% of disposable income up to highest 20%, after adjusting for type of family and household size. Clearly, low-income households spend a lot more on housing relative to their income than higher-income households. The share of housing costs for the lowest income quintile has increased in recent years but is not substantially different from longer term averages.
All other income groups have increased their share of spending relative to income since 1984. Since 1993 the changes have been mixed with the lowest income households and highest income households both spending less as a share of income, while the middle income categories have increased their spending, albeit modestly.
Housing was much more affordable in 1984 with average housing costs at just 11.3% of disposable income.
A number of important changes have occurred over the past 25 years. Interest rates are much lower, living standards have increased substantially for low, middle and high income families and savings rates have also increased – implying that housing costs are increasingly a larger share of expenditure.
Another common measure of housing affordability is housing stress. We use the “30/40” stress rule – a household paying more than 30% of their disposable income on housing costs and also in the bottom 40% of the income distribution.
Using this housing stress measure, we see a significant increase in renter stress, firstly between 1984 and 1993 and then from 2007. Mortgage stress is largely unchanged since 1988 following an increase between 1984 and 1988.
Housing stress rates are similar for major states. The highest rate is in Queensland with 13.5% of households in stress whereas the combined ACT and NT region has the lowest stress rate at 8.1%, thanks to relatively high incomes. The NSW rate is lower than both Victoria and Queensland.
Home ownership rates in Australia have slowly declined since 1984 from around 72% to around 68% by 2015-16. Ownership rates of households headed by people aged under 35 dropped from 50% in the 1980s to around 35% in 2015-16. Households headed by people aged 35 to 49 have experienced a similar percentage point decline but from a higher base.
The downward trend in ownership rates for younger households has been ongoing since 1988. Surprisingly, the house price boom between 1999 and 2005 in Australia does not appear to have made a significant difference to pre-existing trends.
However, home ownership trends are complex, and are likely driven by a range of factors such as interest rates, higher rents in the 1980s, broader societal changes such as people marrying and having children later in life and a higher divorce rates. Another possibility is a shift away from home ownership, with younger people preferring the flexibility that renting offers.
Overall, housing costs in Australia have been relatively stable as a share of disposable income since the early 1990s. This average does mask problems for low-income renters who are paying an increasing share of their income on housing costs, and rent stress levels have also increased over the long term.
Changed economic circumstances provide risks for housing affordability. Were interest rates or unemployment to increase sharply there would be risks to households and flow on effects to the broader economy.
House prices have indeed increased sharply since the late 1990s, well above incomes or inflation. This poses a problem for those wishing to move from the rental market to owning a home as higher house prices imply larger deposits.
While elevated house prices are a concern, the more pressing social problem for Australia remains the lack of affordable rental housing for lower-income families that is close to jobs and services in our capital cities. This has been an ongoing problem in Australia for a number of decades. An ageing population with potentially lower home ownership rates will add to this problem in future years
Author: Ben Phillips, Associate Professor, Centre for Social Research and Methods, Australian National University
Macquarie Group is consolidating its private bank and private wealth businesses to concentrate its growth strategy on high net-worth (HNW) clients, a move it expects to affect advisers.
This underscore the transition in wealth management, as players morph their businesses in the light of the “best interest” requirement, and the fact the providing such advice is costly, and cannot be done en masse. So the focus will be on HNW investors.
HNW clients are already the exclusive focus of Macquarie’s private bank. They are also a substantial proportion of its private wealth business.
The announcement was made by Macquarie’s Banking and Financial Services group (BFS), which also looks after retail banking activities. The gearing towards HNW investors in the bank’s private wealth and banking business will have no impact on BFS’s retail banking strategy which includes home lending, deposits and credit card solutions for consumer clients.
Macquarie head of wealth management Bill Marynissen said concentrating on one client segment will enable it to deliver better on a comprehensive and tailored wealth and banking offering that can take clients from wealth accumulation stages through to retirement.
“Focusing on attracting high net-worth clients is a logical evolution of our private client business and we believe it is a space in which we can be a market leader,” Marynissen said.
“We have carefully assessed growth opportunities in the high net-worth segment against the strong fundamentals of our business. These include a deep understanding of the high net-worth segment, our wealth and banking expertise and suite of solutions, and the capacity to build on our existing digital capabilities.”
Australia has more than 1.2 million adults with wealth of $1.3 million or more, ranking it among the top 10 countries globally for HNW individuals. The segment swelled 7.4% or by 80,000 adults since 2011.
Many advisers will be impacted by the decision to concentrate the focus of the combined private bank and private wealth businesses to HNW clients, according to Macquarie’s wealth management division.
“Macquarie is supporting these advisers in a number of ways, including by facilitating discussions with other firms and assisting with their transition,” the bank said.
In fact you can mount an argument the federal budget is already shot as a result.
The seasonally adjusted Wage Price Index (WPI) rose 0.5 per cent in March quarter 2018 and 2.1 per cent through the year.
Seasonally adjusted, private sector wages rose 1.9 per cent and public sector wages grew 2.3 per cent through the year to March quarter 2018.
In original terms, through the year wage growth to the March quarter 2018 ranged from 1.4 per cent for the Mining industry to 2.7 per cent for the Health care and social assistance industry.
Victoria and Tasmania both recorded the highest through the year wage growth of 2.3 per cent and the Northern Territory recorded the lowest of 1.1 per cent.
And bear in mind this weak result comes despite the Fair Work Commission’s June 2017 decision which lifted the minimum wage 3.3% and to $18.29 from July and flowed to ~2.3 million workers. This means the annual wages growth number contains this artificial artifact which means the underlying would be even lower.
And by the way you can argue this metric overstates the true picture as we see a lift in low paid jobs away from higher paid areas, like mining, and the ABS data does not adjust for this.
For comparison, the Average Compensation of Employees from the national accounts which is to December 2017 is tracking even lower circa 1.3%.
In state and territory terms, personal insolvencies reached a record quarterly high in Western Australia (1,020) and the highest level since the September quarter 2014 in New South Wales (2,372).
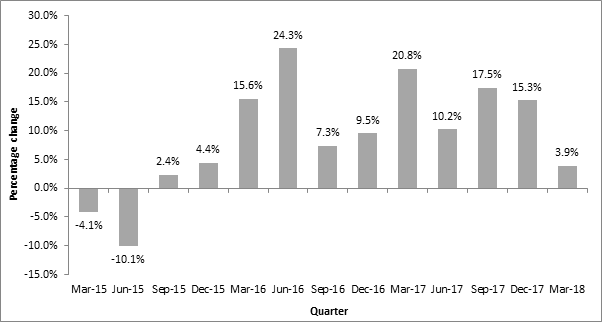
Total personal insolvencies in the March quarter 2018 increased slightly by 0.1% compared to the March quarter 2017. Bankruptcies decreased by 1.8%, debt agreements increased by 3.9% and personal insolvency agreements decreased by 59.3%.
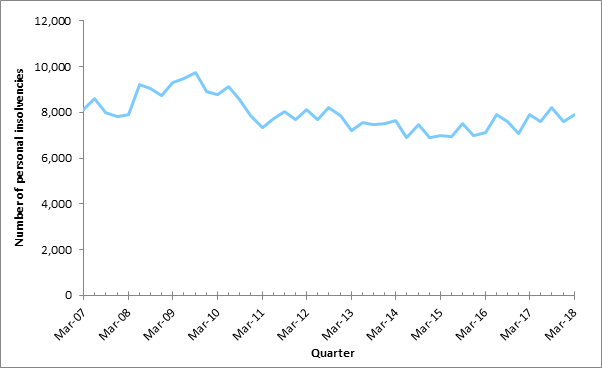
The total number of personal insolvencies in the March quarter 2018 (7,910) increased slightly by 0.1% compared to the March quarter 2017 (7,900).
Quarterly total personal insolvencies remain below the historical national peaks reached in 2008–09 and 2009–10 (more than 9,000 personal insolvencies).
Total personal insolvency activity in Australia: % change compared to same quarter in previous year
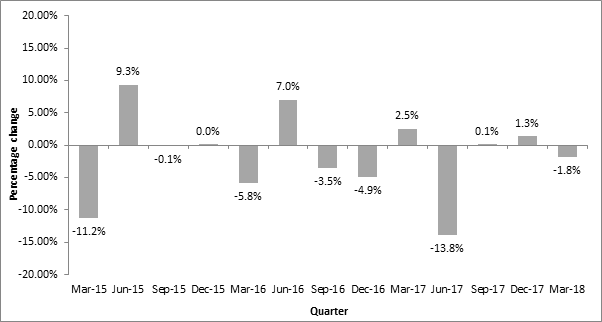
Bankruptcies
The number of bankruptcies decreased by 1.8% in year-on-year terms, from 4,225 in the March quarter 2017 to 4,148 in the March quarter 2018. This follows a 1.3% year-on-year rise in the December quarter 2017. The year-on-year fall in bankruptcies occurred in:
Australian Capital Territory (-37.9%)
Victoria (-15.4%)
South Australia (-10.8%)
Queensland (-2.5%).
These falls were partly offset by rises in:
Northern Territory (53.8%)
Western Australia (16.0%)
Tasmania (11.1%)
New South Wales (1.2%).
Bankruptcies constituted 52.4% of total personal insolvencies, falling from 53.5% in the March quarter 2017.
Bankruptcies in Australia % change compared to same quarter in previous year
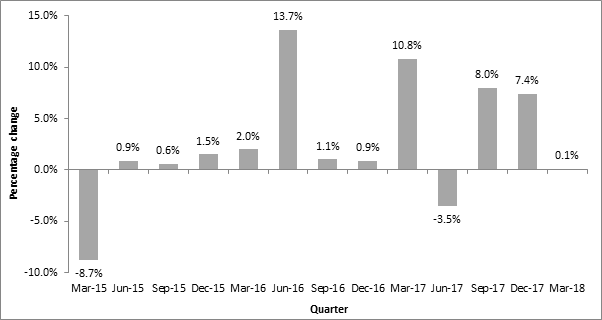
Debt agreements
The number of debt agreements increased by 3.9% in year-on-year terms, from 3,584 in the March quarter 2017 to 3,725 in the March quarter 2018.
Debt agreements increased in year-on-year terms in most states and territories in the March quarter 2018:
New South Wales (20.2%)
Australian Capital Territory (15.8%)
Western Australia (7.0%)
South Australia (4.1%)
Northern Territory (2.2%).
Debt agreements fell in:
Victoria (-8.4%)
Tasmania (-5.3%)
Queensland (-5.1%).
Debt agreements reached a record quarterly high of 1,219 in New South Wales in the March quarter 2018. The previous quarterly record of 1,084 debt agreements occurred in the December quarter 2017.
Debt agreements constituted 47.1% of total personal insolvencies, rising from 45.4% in the March quarter 2017.
Debt agreements in Australia: % change compared to same quarter in previous year
Debt agreements in Australia % change compared to same quarter in previous year
Personal insolvency agreements
Quarterly personal insolvency agreement levels fluctuate proportionally more than those of bankruptcies and debt agreements as levels are relatively small.
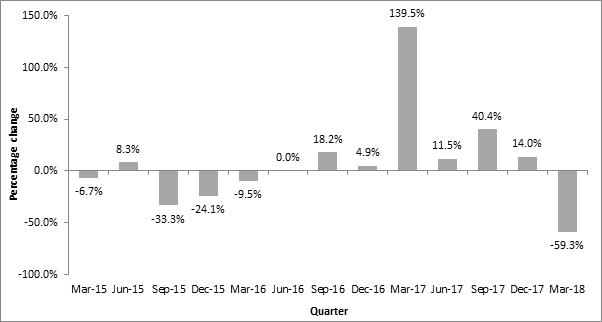
The number of personal insolvency agreements decreased by 59.3% in year-on-year terms in the March quarter 2018, from 91 in the March quarter 2017 to 37 in the March quarter 2018. This is the lowest quarterly level of personal insolvency agreements on record. The previous record low of 38 occurred in the March quarter 2016.
This is the first quarter in which personal insolvency agreements have decreased in year-on-year terms since the March quarter 2016. It follows six consecutive quarterly increases. Personal insolvency agreements fell in all states and territories.
Personal insolvency agreements in Australia % change compared to same quarter in previous year
From the September quarter 2017, geographic coding of personal insolvency statistics follows a new method. There is also a minor change in the reporting date used for personal insolvency agreements from that quarter. These changes are breaks in series for our statistical publications. For further details see the Guide to personal insolvency statistics. Quarterly personal insolvency activity in Australia. They implemented a minor change to the reporting dates used for personal insolvency agreements in the September quarter 2017. This is the smallest type of personal insolvencies.
Back in January I published a video entitled “To Buy, Or Not To Buy, That IS indeed the Question” which addressed the question of should I buy property now. It’s still available, and as current as ever it was.
But as we have seen prices slide further, which we showed in yesterday’s edition of the Property Imperative Weekly, one question is coming up more often from our community. That is, should I SELL now – ever more relevant as the future direction looks to be south, so reducing the paper value of property – to which the answer is, it depends.
Once again, a necessary caveat, as this is not financial advice, and your mileage may vary, but I think there are some principles which are worth exploring in general terms. So today, I am going to touch on some of the most important ones.
Owner Occupiers
First, I think the answer will vary by the type of property holder. For those owning a property to live in – for owner occupation – to provide shelter – you may have reason to switch properties perhaps because of moving with a job, or to trade up, to get more space, or to trade down, to get a smaller place, and possibly release capital on the way through.
Now here is an important point. One property is worth one property. You only need one property. Just one. So at any point in the market cycle, if you sell to buy, you are crystallising value in your existing property at the point in time you sell, and commit to buy a new place at the same time. So in a relative sense, if you buy and sell, you transact at a specific point in time. And even if values have fallen, so you have lost some paper equity in your existing place, the property you are buying may well have fallen also, though of course different markets may be moving at different rates, and even different types of property may have moved differentially. But generally, selling and buying can actually be done at any time, provided of course there are properties to buy, and prospective purchasers for your existing place. It might be much harder if the market itself has frozen.
But often you will have a mortgage on your existing place and you are selling, and often that needs to be repaid from the proceeds of sale. That’s fine provided you have sufficient equity, even if the capital value has fallen, but could be a real barrier if the value of the mortgage is higher than the property – so called negative equity. And if fact, it is negative equity which can become the barrier to switching property, as we have seen in other markets where prices fell 30-40%.
But if you have sufficient equity to repay the mortgage, and need a mortgage on a new place, you may have to apply afresh. Of course bear in mind that lending standards may have become tighter so you might not be able to get the same value of loan as previously, and this is also true if your circumstances have changed. So it is worth checking this out early. Generally, mortgage borrowing power has been reduced in recent months.
Or perhaps your mortgage is portable.
In fact, loan portability is often a standard on all home loans – but you may have to ask, and sometimes it’s not obvious. This means if you choose to move houses, you can take your loan with you. So in this case you are to transfer your existing loan to another property without having to go through the process of refinancing. But you will need to ask the lender for the “hidden” rules and parameters, and generally, you may have to pay slightly more for the flexibility of portability. And overseas, some lenders even allowed negative equity to be transferred to facilitate a move.
Sometimes people will try to sell, rent, and wait for the market to fall further, before buying. That might work, but you are essentially taking a bet on the market. You might be right; you could be wrong. As I have said before predicting future home price movements is a mugs game, and most predictions will be wrong. There are too many moving parts.
Finally, if you are trading down, – seeking a smaller place, to release capital, you may want to bring the transaction forward, because larger value homes are falling faster than smaller ones. On the other hand, those seeking to trade up, and get a larger place might do better to wait, as prices may fall so you can get a larger place for less money. But again, you are betting on the market, and you may be wrong.
A Forced Sale
One other scenario to consider is being forced to sell, perhaps because the mortgage repayments are just too demanding. In fact, given we have nearly 1 million households in mortgage stress, and flat incomes, the number facing difficulty is increasing. Now the banks have an obligation to assist in cases of hardship, and they may be able to restructure the loan, or even waive interest payments for a bit in this case. They are also loathe to push people out of their homes – as a forced sale – as this risks significant negative publicity and also may reduce the value of the property in the process. But they often “encourage” stressed households to sell, and we are seeing a rise among these households. So households come to accept there is no way out but to sell. In this situation it is probably better to sell sooner rather than later, as in our experience in the current environment the cure rate is very low, unless the problem is created by a short term health or employment hiatus. But often it’s a matter of the income just consistently not covering expenditure. So selling in these circumstances can be a positive circuit breaker, and in a falling market, selling sooner may yield higher net returns.
Property Investors
So now to property investors. The equation here is quite different. We are already seeing some sassy property investors selling, to realise the capital gains they have achieved, remember value is not true value until it is crystallised. In some cases, this is to reinvest in the smaller markets of Adelaide and Hobart, where capital gains are for the moment still being seen. Though that may change.
For some investors, its simply that the net rental yield – the flow of rental payments, less the costs of managing and maintaining the property are now net negative, so unless you can see rapid capital growth and offset losses again other income it might be time to sell.
Our latest data shows that about half of all rentals are underwater on a cash flow basis, especially in Victoria and NSW. Some other states, such as Queensland are doing somewhat better, mainly because values have not lifted so high, and so mortgages relative to rental streams are smaller. So it pays to shop around – as the outcomes are remarkably different. The fact is for many, the true “all in” returns, even allowing for capital appreciation, are remarkably low – and many investors do not do the calculations to know the real picture. They would get a nasty surprise. And if capital values continue to fall, yields will drop also. And in addition, rental rates are more connected with incomes, than home prices, so changes in capital value, or even mortgage rates, do not get reflected in the majority of rents. This is a pre-tax picture by the way.
Talking of tax, the current generous tax incentives are used by many, especially more affluent households, to reduce their effective taxable income. This is why the Government can say that the majority of negatively geared investors do not have large incomes – it is stating the obvious, as net taxable income is after all the tax manipulation!
Some investors are choosing to sell, to lock in significant capital gains (and again the tax breaks are generous), fearing that values may fall ahead. Others are being forced to sell to meet or avoid higher mortgage repayments as they move from interest only loans to principal and interest loans. This is especially true for those holding multiple properties – and many have more than 5, and some more than 20 leveraged investment properties. So they sell to cover the costs on the remaining ones.
And once again it is important to remember mortgage underwriting standards are much tighter now – including a 20% haircut on rental streams to cover times when the property is vacant, a repayment assessment made on a pre-tax not post-tax position and on a principal and interest basis – even if applying for an interest only loan. And significantly more questions, and evidence required to get a loan if you are materially dependent on the rental streams to cover the costs of the mortgage.
Remember too that Labor would freeze negative gearing for most new transactions (but they do not plan retrospective changes, so existing negatively geared loans would be more attractive to retain) and they may still have tax breaks for newly built property. There are no details as yet.
Generally, in a downturn, its investors who flee the market first – as data from Ireland and the UK both show. This is why investor mortgages are more risky – the Bank of England says four times more likely to default.
So my perspective would be investors might seriously want to review their portfolios, and estimate the true net returns. Given many will have paper profits on capital gains over recent years, there is a strong logic to sell.
But again, it does depend on your view of future home price movements. As you know, we hold the view that prices are correlated with loan availability, and as because loans are now harder to come by, property prices have further to fall. They are at least 30% overvalued compared with their true economic value.
In Summary
So the bottom line is this. Property Investors have more of a burning platform to take action and consider selling before prices fall further. Down Traders also would be in a similar position as they are also seeking to lock in capital growth. On the other hand, Up Traders may prefer to wait – assuming prices will fall further. And those owners occupied sellers, who need to move, should probably, do so in any case, with the caveat that the mortgages available now will be smaller than they were a few months again.
Again, to reiterate, this is not financial advice, and it’s just my – hopefully informed – opinion, but you would need to get more specific guidance based on your individual circumstances.
In the federal budget, Treasurer Scott Morrison promised tax cuts to all working Australians in the form of an offset and changes to tax income thresholds. But our analysis of Treasury data shows that while the government advertised these as payments to low and middle income Australians, most of the benefits would flow through to high income earners in future years.
If all of the stages of the tax plan passed parliament, there would be a sharp increase in benefits for people earning above A$180,000, due to the reduction of their marginal tax rate from 45% to 32.5%.
Taxes in most countries are progressive. This means that the more you earn, the higher your marginal rate (the additional amount you pay for each dollar earned).
There are good reasons for this – progressive tax systems mean those on a lower income pay a lower average tax rate, while those on higher incomes pay a higher average tax rate. This reduces income inequality – as you earn more, for each dollar you earn, you will pay more in tax than someone on a lower income.
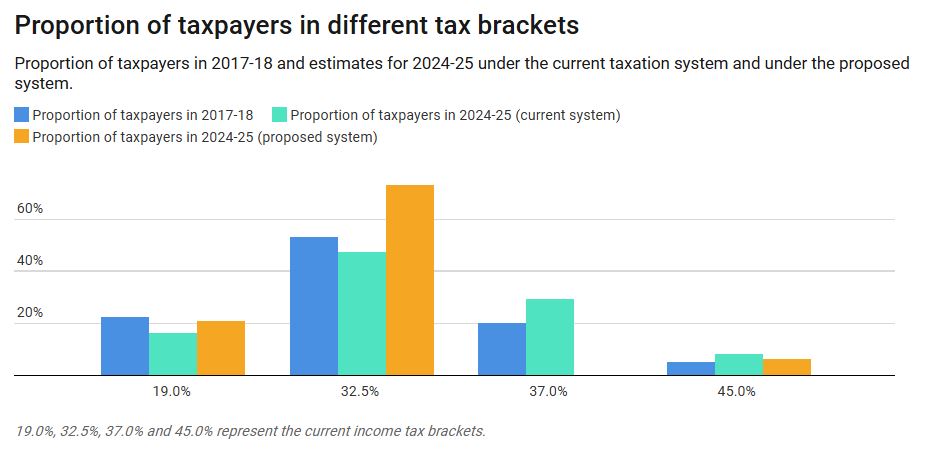
With the 2018-19 budget, the proposal is for a “simpler” tax system from 2024-25. This means a reduced number of tax brackets, and a lower rate of 32.5% to those earning between A$87,001 and A$200,000.
Treasurer Scott Morrison said following the budget:
Well, you’ve still got a progressive tax system. That hasn’t changed. In fact, the percentage of people at the end of this plan, who are on the top marginal tax rate is actually slightly higher than what it is today.
However this new tax system from 2024-25 is less progressive than the current system. It means higher income inequality – the rich get more of the tax cuts than the poor.
As part of the new proposal, low and middle income earners get a tax offset in 2018-19, with high income earners getting very little. This part of the plan is progressive – more money goes to lower income earners.
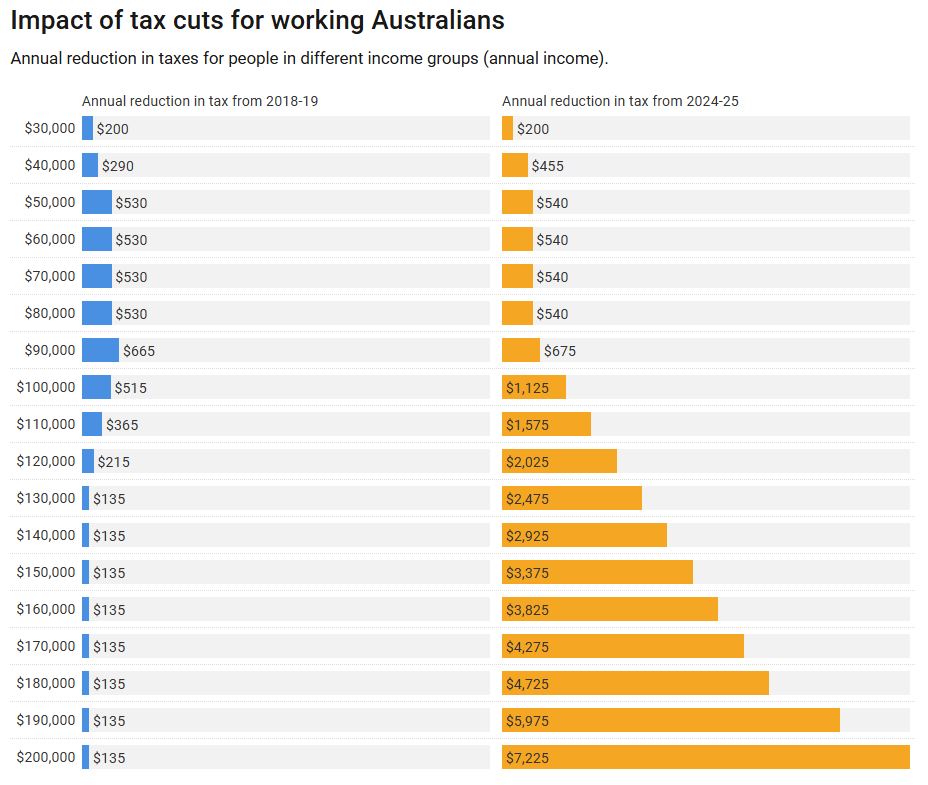
However, by 2024-25, the tax cuts means high income earners gain A$7,225 per year, while those earning A$50,000 to A$90,000 gain A$540 per year, and those earning A$30,000 gain A$200 per year.
Of course, another factor of tax cuts is that they only benefit those who are employed. Tax cuts don’t benefit people like the unemployed, pensioners, students (usually young people) and those on disability support pensions.
The conversation Australians need to have is how we should be spending the revenue boost we are seeing over the next few years. We can either spend this windfall gain on benefits to high income earners, in the hope that this will flow through spending to everyone else; or maybe we should encourage young people into housing through an increase to the first home owners grant, or increased funding for our schools, universities and health system.
We’ve developed a budget calculator so you can see how your family is affected by the 2018 budget.
Author:Robert Tanton, Professor, University of Canberra; Jinjing Li, Associate Professor, NATSEM, University of Canberra
Digital Finance Analytics (DFA) has released the April 2018 mortgage stress and default analysis update.
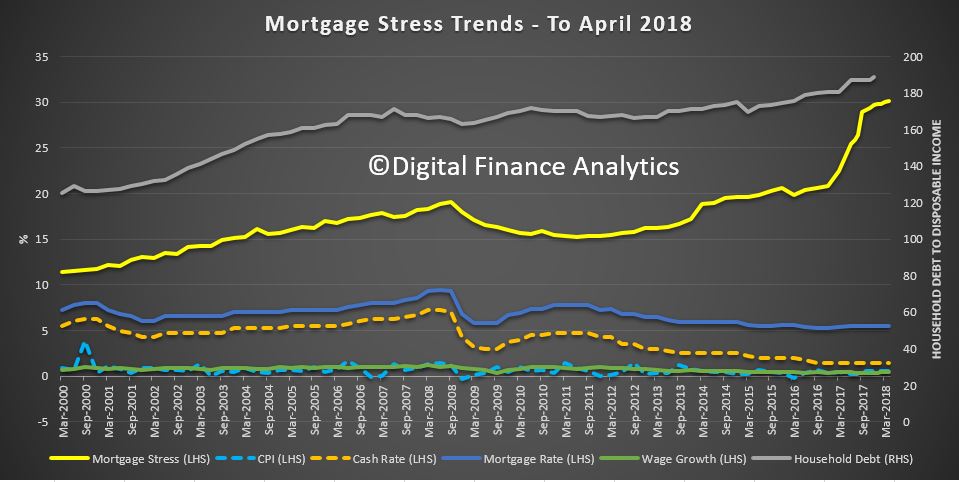
Across Australia, more than 963,000 households are estimated to be now in mortgage stress (last month 956,000). This equates to 30.1% of owner occupied borrowing households. In addition, more than 21,600 of these are in severe stress, up 500 from last month. We estimate that more than 55,600 households risk 30-day default in the next 12 months. We expect bank portfolio losses to be around 2.8 basis points, though losses in WA are higher at 5 basis points. We continue to see the impact of flat wages growth, rising living costs and higher real mortgage rates.
Martin North, Principal of Digital Finance Analytics says “overall, risks in the system continue to rise, and while recent strengthening of lending standards will help protect new borrowers, there are many households currently holding loans which would not now be approved. The recent Royal Commission laid bare some of the industry practices which help to explain why stress is so high. This is a significant sleeping problem and the risks in the system remain higher than many recognise”.
News On the Finance Sector Is Set to Get Worse.
Australia is horrified by what they are learning from the Royal Commission; yet this is only the beginning. News on the finance sector is set to get much worse.
Gill North, a Professor of law at Deakin University and Principal at DFA, suggests “the issues highlighted by the RC represent only the tip of the iceberg and Australia is in for a bumpy and uncomfortable ride”. The systemic risks across the financial sector and economy are now much higher than most participants realise, and these risks are exacerbated by the concentration of the finance sector and its many interconnections, the laxity of the lending standards over the last decade, the high levels of household debt (and the distribution of this debt), and the heavy reliance of the Australian economy on the health of the residential property market.
At some point down the road, the true resilience of the financial institutions, their consumers, and the broader economy will be tested and put under extreme pressure. And when this occurs, the high levels of household debt and financial stress, and the large disparities between the population segments that have considerable income, savings and wealth buffers, and those who have no such buffers, will become starker. “When the next housing or financial crisis hits (and the question is when and not if), the ensuing impact on the finance sector, many Australian households, and the broader economy will be severe. Yet most, if not all, of the financial institutions, the regulators, policy makers, and consumers still remain largely oblivious to what lies ahead.”
Martin North says: “We continue to see the number of households rising, and the quantum is now economically significant. Things will get more severe, especially as household debt continues to climb to new record levels. Mortgage lending is still growing at two to three times income. This is not sustainable and we are expecting lending growth to continue to moderate in the months ahead as underwriting standards are tightened and home prices fall further”. The latest household debt to income ratio is now at a record 188.6.[1]
Our analysis uses the DFA core market model which combines information from our 52,000 household surveys, public data from the RBA, ABS and APRA; and private data from lenders and aggregators. The data is current to end April 2018. We analyse household cash flow based on real incomes, outgoings and mortgage repayments, rather than using an arbitrary 30% of income.
Households are defined as “stressed” when net income (or cash flow) does not cover ongoing costs. They may or may not have access to other available assets, and some have paid ahead, but households in mild stress have little leeway in their cash flows, whereas those in severe stress are unable to meet repayments from current income. In both cases, households manage this deficit by cutting back on spending, putting more on credit cards and seeking to refinance, restructure or sell their home. Those in severe stress are more likely to be seeking hardship assistance and are often forced to sell.
The forces which are lifting mortgage stress levels remain largely the same. In cash flow terms, we see households having to cope with rising living costs – notably child care, school fees and fuel – whilst real incomes continue to fall and underemployment remains high. Households have larger mortgages, thanks to the strong rise in home prices, especially in the main eastern state centres, and now prices are slipping. While mortgage interest rates remain quite low for owner occupied borrowers, those with interest only loans or investment loans have seen significant rises. We expect some upward pressure on real mortgage rates in coming months as international funding pressures mount, a potential for local rate rises and margin pressure on the banks thanks to a higher Bank Bill Swap Rate (BBSW).
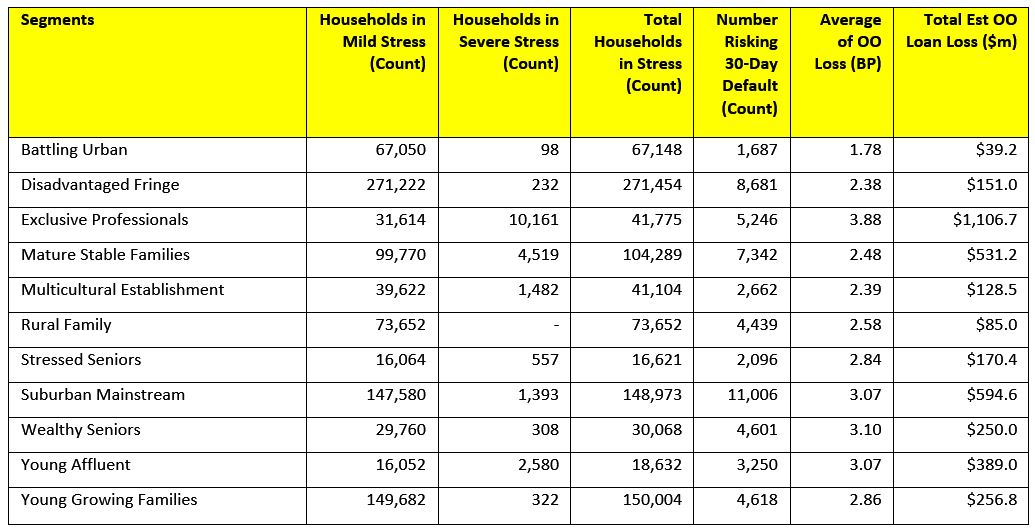
Probability of default extends our mortgage stress analysis by overlaying economic indicators such as employment, future wage growth and cpi changes. Our Core Market Model also examines the potential of portfolio risk of loss in basis point and value terms. Losses are likely to be higher among more affluent households, contrary to the popular belief that affluent households are well protected.
Stress by The Numbers.
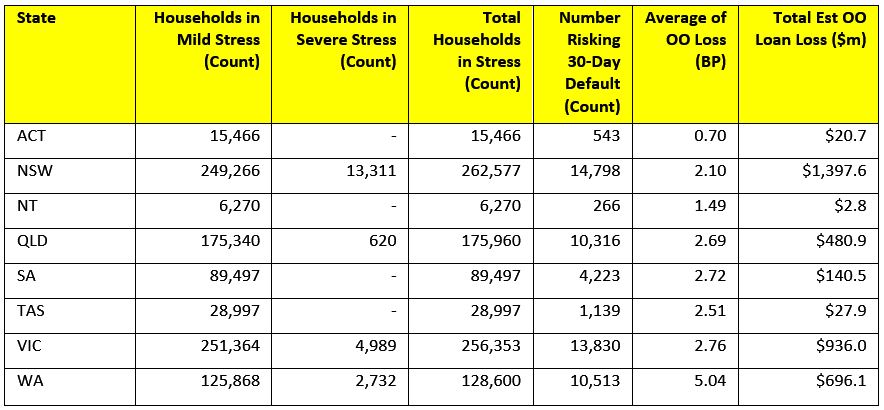
Regional analysis shows that NSW has 262,577 households in stress (261,159 last month), VIC 256,353 (258,303 last month), QLD 175,960 (176,154 last month) and WA has 128,600 (126,606 last month). The probability of default over the next 12 months rose, with around 10,513 in WA, around 10,316 in QLD, 13,830 in VIC and 14,798 in NSW.
The largest financial losses relating to bank write-offs reside in NSW ($1.4 billion) from Owner Occupied borrowers) and VIC ($936 million) from Owner Occupied Borrowers, which equates to 2.10 and 2.76 basis points respectively. Losses are likely to be highest in WA at 5 basis points, which equates to $696 million from Owner Occupied borrowers. A fuller regional breakdown is set out below.
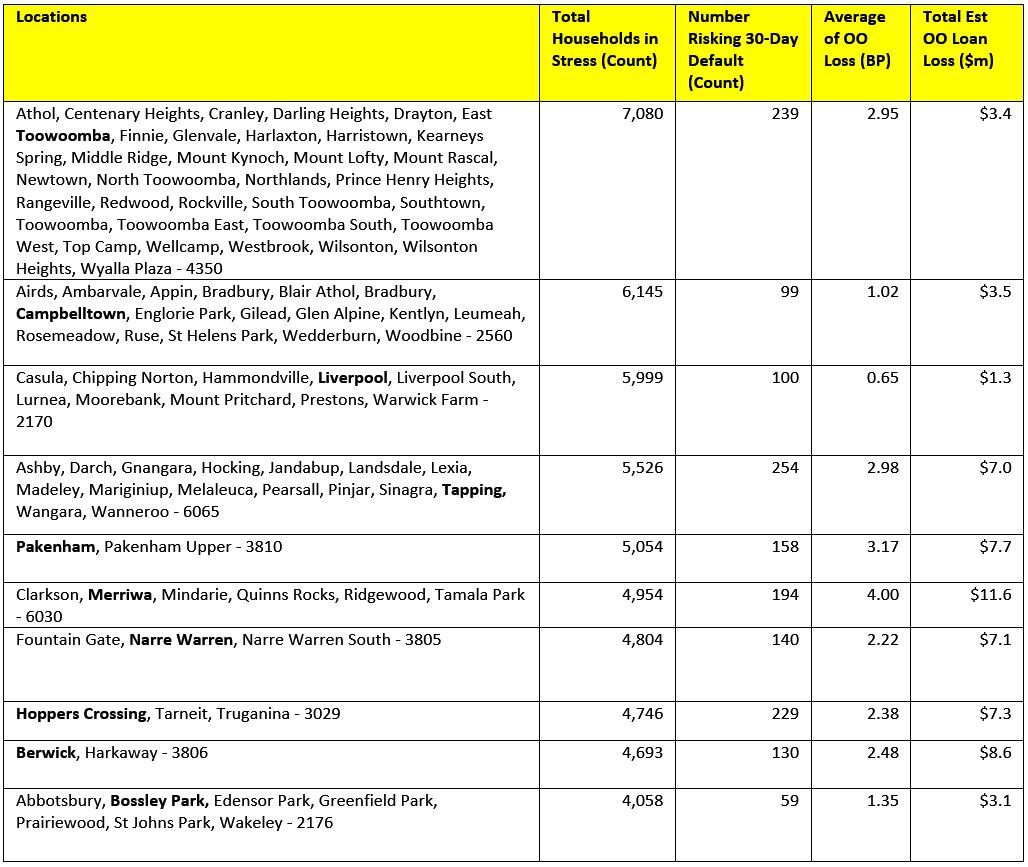
Here are the top post codes sorted by the highest number of households in mortgage stress.
[1] RBA E2 Household Finances – Selected Ratios December 2017 (Revised 3rd April 2018).
You can request our media release. Note this will NOT automatically send you our research updates, for that register here.
[contact-form to=’mnorth@digitalfinanceanalytics.com’ subject=’Request The April 2018 Stress Release’][contact-field label=’Name’ type=’name’ required=’1’/][contact-field label=’Email’ type=’email’ required=’1’/][contact-field label=’Email Me The April 2018 Media Release’ type=’radio’ required=’1′ options=’Yes Please’/][contact-field label=”Comment If You Like” type=”textarea”/][/contact-form]
Note that the detailed results from our surveys and analysis are made available to our paying clients.
Assistant Treasurer Michael Sukkar has encouraged consumers to ‘Go paperless to save money’ launching a national education campaign to help consumers stop paying unnecessary fees to receive paper bills.
The Hon. Michael Sukkar first encouraged consumers to opt to receive digital bills before urging those who need paper bills to find out if they are eligible for fee exemptions. The implementation of an education campaign was first announced by former Minister for Consumer Affairs Michael McCormack following a Consumer Affairs Forum which recognised vulnerable consumers needed to be protected against unfair paper fees.
“This approach from the Minister is not only disappointing but shows a clear lack of understanding on the issues Australian consumers are facing in regards to paper billing fees,” commented Kellie Northwood, Executive Director, Keep Me Posted. “The suggestion from the Minister is to ‘Go paperless to save money’. Yet who will be saving money? Certainly not the Australian consumers who will need to buy a computer, a printer, paper and internet connection to print their bills and statements at home. The only people the Minister is saving money for in this case are the banks and super profit companies.”
Keep Me Posted has advocated for a ban on paper fees on important communications for two years.
The campaign, a coalition of representatives from the print, paper and mail industry, charity, trade unions and community groups, argues that vulnerable Australians are impacted the most by paper fees, those on the wrong side of the digital divide. The latest data from the ABS shows that since 2014-2015 the digital divide hasn’t narrowed and currently, close to 1.3 million Australian households are still not connected to the internet. Data shows that disadvantaged Australians are more likely to be digitally excluded: elderly, low-income households, people living with a disability, and people living in remote communities.
“The Royal Commission into Banking and Financial Services is demonstrating daily the need for strong consumer protections for Australians in this regard,” furthered Northwood. “We believe the
role of the Minister for Consumer Affairs is to protect consumers against unfair fees, not assist corporates in their marketing campaigns for their digital tools.”
Paper fees have been implemented in the banking sector by some of the major providers such as Commonwealth Bank, Bankwest or Macquarie Bank. Ranging between $1.25 and $2.50 for a paper statement, fees can ramp up to $7.50 for a paper copy of a statement requested at a bank’s branch as seen recently with Westpac. Other providers such as NAB have automatically switched their customers to digital communications without requesting proper consent.
Over the last two years, Keep Me Posted has distributed thousands of template letters to help consumers request an exemption of paper fees as many are unaware of their rights. More concerning however, is many report struggling to argue their case to their service providers. The newly launched education campaign was expected to assist them, however, Keep Me Posted argues the campaign falls well short and does not support the spirit of the Consumer Affairs Forum agreement.
“Treasury’s consultation paper into paper billing fees recognised that ‘consumers from disadvantaged groups who cannot transition to digital bills are being disproportionately impacted by fees for paper billing’,” said Northwood. “Twenty-eight (28) out of forty-three (43) organisations that publically contributed to Treasury’s consultation supported a total ban on paper fees. This is a strong response that consumers shouldn’t have to pay the price of corporates trying to cut their costs by any means. We are looking forward to seeing Treasury’s recommendations on the issue and hope to see Australia joining the list of many other countries that have already legislated in this regard and provided consumer protections.”
Globally, Austria, Belgium, France, Finland, Germany, Ireland, Netherlands, Spain, and the US State of Pennsylvania have already legislated that print and postage are a cost of doing business that must not be passed onto customers. Keep Me Posted hopes Australia is next.
Interest only loans are rarely out of the news. Following ASIC’s interim review the September quarter posted a knee-jerk 44.8% decline in new IO loans and lending practices are now firmly in the regulator’s crosshairs. APRA and RBA have already clamped down and further scrutiny is expected during the royal commission.
The regulators aren’t the only ones concerned. In February, assistant governor Michele Bullock delivered a speech on mortgage stress in which she highlighted a “large proportion of interest-only loans are due to expire between 2018 and 2022”.
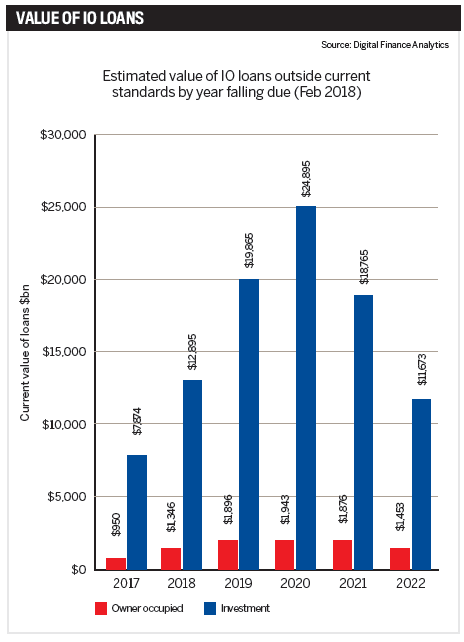
That large proportion is, in fact, almost every IO loan written between 2013 and 2016, and subsequent analysis of IO property fixed-term lending by Digital Finance Analytics has calculated the total number at 220,000, with values upwards of $100bn.
These loans originate from before the reviews of 2015 and 2017, and in the coming year the fixed terms on 14% of them will face a reset outside of current lending criteria. By 2020, the value of loans due for renegotiation is expected to reach $27bn.
While there are many options open to these borrowers, Bullock calls it an “area to watch”, saying many could find themselves in financial stress.
“Some homeowners may not realise they are fast approaching the end of their five-year term and, if they do nothing, their lender will automatically roll them onto a P&I loan that could be challenging for them to support,” says Zippy Loans’ principal broker Louisa Sanghera.
“Combine this scenario with a slowing of the property market and clients may not have the buffer of equity to soften the blow.”
To the customer, interest-only is an attractive proposition for a number of reasons, from freeing up cash to tax incentives. Additionally, investors have widely financed rental property investments on an IO basis while paying down their owner-occupied P&I loan. Executive director of The Local Loan Company, Ray Hair, observes that it’s a decades-long trend, one that has taken place right under the radar of regulators and banks.
To date, availability has largely driven demand for IO, but with many borrowers now preparing to face the consequences of their honeymoon financial planning, a mounting collection of horror stories could change that.
“Whenever regulators initiate corrective action in a market there is an initial period of over correction, however the pendulum generally swings back to a position of equilibrium. Sadly, this is of little comfort to those caught out by the overnight changes in policy, increased interest rates and institutional disregard for the personal cost,” says Hair.
“Expect to see some very angry investors looking for a lender, broker or adviser to blame, and pay compensation” Ray Hair, The Local Loan Company
Major lenders are preparing their broker networks for further changes to lending criteria, and are actively assessing the terms of loans due to expire to 2022. But with many below the cap and borrowers looking for IO products, the call to return to business as (almost) usual has been too strong to resist.
“We have seen several major lenders loosen the reigns and cut the rates for interest-only loans again, likely because they are sitting below the cap and are looking to add more interest-only loans to their books. It will be interesting to observe whether other lenders follow and how this plays out in terms of consumer behaviour,” says Uno Home Loans CEO Vincent Turner.
The mortgage crunch
In January, UNSW professor of economics Richard Holden published a sobering observation of Australia’s relationship with high-LVR and IO loans. In it he reported Australian banks lend an average 25% more than their US counterparts and that these loans are poorly structured and sometimes based on falsified or inaccurate household finances.
A decade ago, US banks learned this lesson the hard way, when five-year adjustable rate mortgages could not be refinanced and the fallout triggered a chain reaction that dragged most of the globe into recession.
In Australia, IO lending has comprised as much as 40% of the loan book at the major banks, and a particularly large share of property investors choose IO. The number of new IO loans is in overall decline, $156bn borrowed in 2015 to $135.5bn in 2017, but their share is still significant. In the owner-occupier market they count for one in four loans, and in the investor market it’s two in three.
“Interest-only loans in Australia typically have a five-year horizon and to date have often been refinanced. If this stops then repayments will soar, adding to mortgage stress, delinquencies, and eventually foreclosures,” Holden told Australian Broker at the time.
“It’s our professional and ethical obligation to look after the best interests of our clients and help them plan strategies” Louisa Sanghera, Zippy Loans
A teacher at the University of Chicago when the US housing market crashed, he added, “The high proportion is similar to the high proportion of adjustable rate mortgages in the US circa 2007.”
So how scared should people be? According to Hair, a lot of people “should be very afraid”, although he says dynamic lending policies, a banking sector unwilling to lose market share and strength in non-bank lenders will dampen some impact.
Quoting the DFA data, he adds, “Unfortunately, there will be pain for highly leveraged borrowers with negative equity, as there has been in the past with an oversupply of apartments, restrictions on non-resident lending and the fall
in property values in mining-dependent regional towns.”
For Turner, the concerns are overstated on a macro level, and reasonable lead times for a switch are all most borrowers will need. However, he warns, “The bigger concern should always be unemployment that triggers substantial hardship, very quickly across a broad group of people, which has the effect of contagion.”
Hero or villain?
While there are many unknowns in how borrowers and lenders will cope with the switch to P&I, what is known is that brokers could find themselves very busy between now and 2022.
“It’s our professional and ethical obligation to look after the best interests of our clients and help them plan strategies that are sustainable and supportive of their personal financial goals,” says Sanghera, who predicts a “positive impact overall” for brokers.
At Zippy Loans active management of IO customers means the lender has very few of the loans on its books. Responding to the rises in interest rate charges over recent months, Zippy has contacted its IO clients to move them onto a workable P&I solution.
“Clients will need to consider a broader range of lending options to find a product that works for them and brokers are ideally placed to research these options on their behalf. I believe this will result in more people turning to brokers to navigate the ever-more complex market place and secure the right solution,” she adds.
Throughout this process, transparency will be key, as Turner notes, “Brokers who continue to push expensive interest-only loans will probably lose business to those who show their customers when P&I works and when IO is the better option. In most cases it isn’t.”
However, brokers will also be the bearers of bad news as some are forced to sell and, according to Hair, it’s likely a lot of disgruntled borrowers will pursue their brokers in the courts, as many have done before when things have not gone their way.
Advising brokers to keep “well documented notes” of original transactions and borrower objectives, as well as subsequent attempts to refinance, he says: “Brokers will be both the heroes and the villains in this pantomime.”
“Expect to see some very angry investors looking for a lender, broker or adviser to blame, and pay compensation, for the position they find themselves in,” he adds.
Is this Australia’s sub-prime crisis? From those in the industry it’s a unanimous no. However that doesn’t mean to say a significant number of borrowers won’t receive a harsh wake-up call.
“The bigger concern should always be unemployment that triggers substantial hardship … which has the effect of contagion” Richard Holden, UNSW
For Holden, the damage has already happened and recent measures are too little too late. Although he refers to tighter lending standards as “comforting”, he says the 30% cap is “about all that can be done” at this point.
Australia’s smaller lenders lack the resources to manage more of the IO debt burden, meaning a mass exodus of customers away from the majors is unlikely. That doesn’t mean to say the majors won’t step up to the potential competition. As Hair predicts,
this could bring some attractive offers for borrowers looking to switch or refinance.
For now, it’s all eyes on the interest rate. On the one hand, no change in the cash rate for 19 months has manufactured a level of stability, on the other it’s delayed the hangover. The IMF has already advised implementation of US-style signalling for potential hikes, although after the last month there is some way to go before reaching the 4% rate it expects to see by late 2019.
Regardless of what happens, some pockets of stress are expected.
Within the industry, brokers have a chance to step up and guide customers through the uncertainties, but the watchful eyes of the regulators will be on them.
A $100bn question remains: how wealthy is the average Australian borrower? Those writing the rulebook say wealthy enough to cover higher mortgage payments. Those who have seen the cycle play out elsewhere, say otherwise.

 Then we compared the relative distribution by industry groups now, and back in 2005. Over that decade or so there has been a considerable shift in industry distribution.
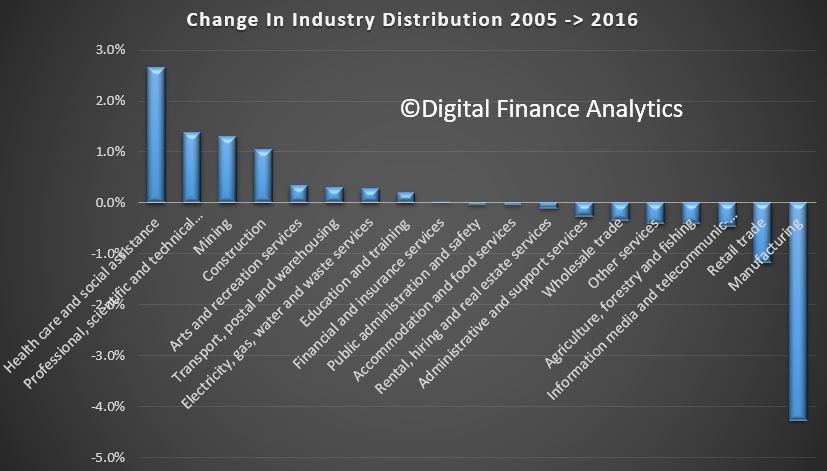 The final piece of analysis looks at relative weekly income across specific industry sectors. More than half of all people working in retail earn less than $600 a week. More than half of people in the healthcare sector earn less than $800 a week. Half the average of all industry sectors earns less than $1,000 a week, whilst half of those in the resource and mining sector earn more than $1,800 a week. So Retail and Health care sectors are intrinsically low paid.
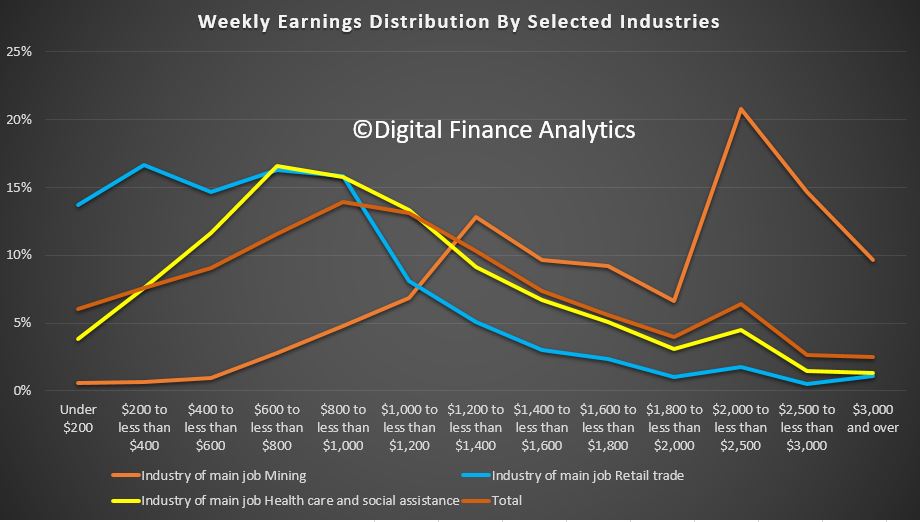 Now lets put that together. All this goes some way to explain the shifts in employment and income. The health care sector has been an important generator of jobs in recent years, and health care is expected to continue to expand employment in coming years, but the jobs will continue to shift to low-paying support occupations reflecting changing demographics and greater demand. About 40 percent of the sector’s workers are not directly involved in treating a patient; instead, they work in jobs such as office or administrative work and food preparation. Others are working in health support occupations like home care and personal assistance. These jobs are paid significant less than care practitioners.
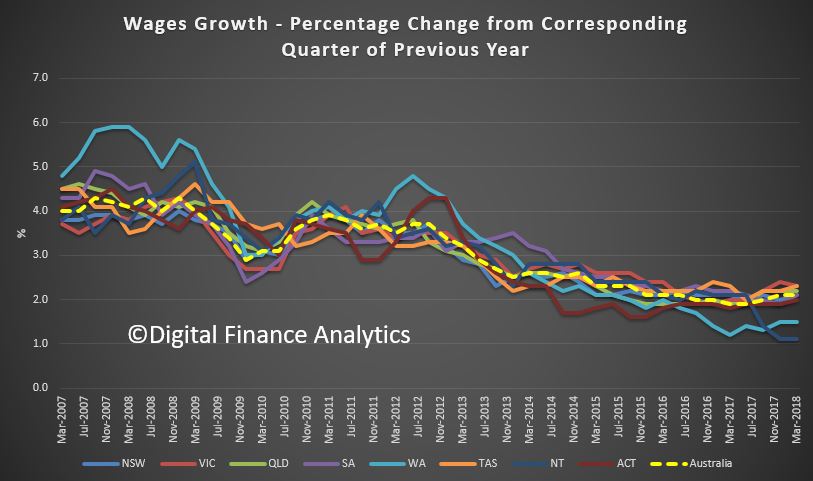


.PNG)