In the federal budget, Treasurer Scott Morrison promised tax cuts to all working Australians in the form of an offset and changes to tax income thresholds. But our analysis of Treasury data shows that while the government advertised these as payments to low and middle income Australians, most of the benefits would flow through to high income earners in future years.
If all of the stages of the tax plan passed parliament, there would be a sharp increase in benefits for people earning above A$180,000, due to the reduction of their marginal tax rate from 45% to 32.5%.
Taxes in most countries are progressive. This means that the more you earn, the higher your marginal rate (the additional amount you pay for each dollar earned).
There are good reasons for this – progressive tax systems mean those on a lower income pay a lower average tax rate, while those on higher incomes pay a higher average tax rate. This reduces income inequality – as you earn more, for each dollar you earn, you will pay more in tax than someone on a lower income.
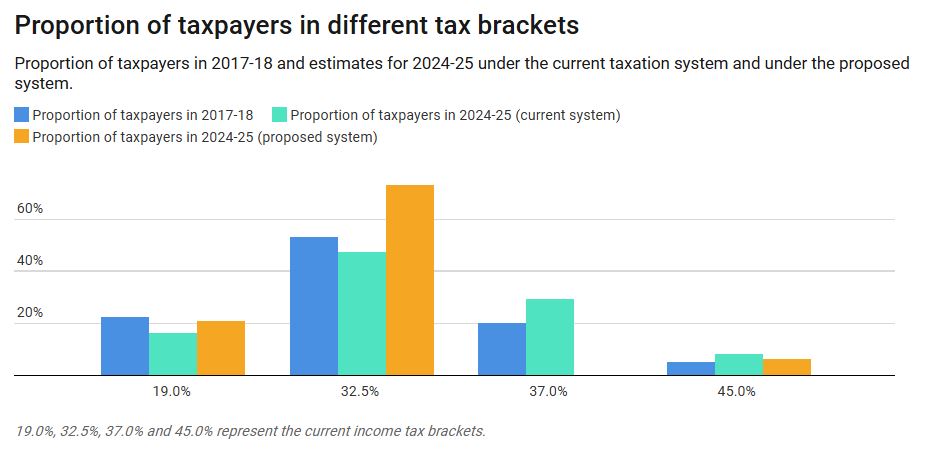
With the 2018-19 budget, the proposal is for a “simpler” tax system from 2024-25. This means a reduced number of tax brackets, and a lower rate of 32.5% to those earning between A$87,001 and A$200,000.
Treasurer Scott Morrison said following the budget:
Well, you’ve still got a progressive tax system. That hasn’t changed. In fact, the percentage of people at the end of this plan, who are on the top marginal tax rate is actually slightly higher than what it is today.
However this new tax system from 2024-25 is less progressive than the current system. It means higher income inequality – the rich get more of the tax cuts than the poor.
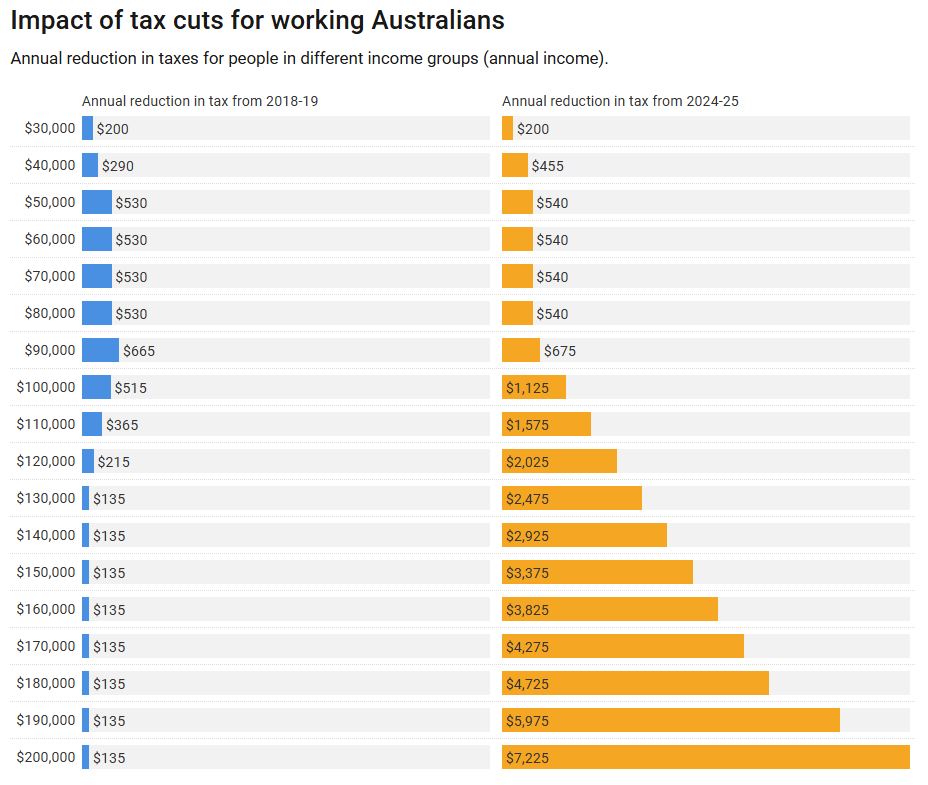
As part of the new proposal, low and middle income earners get a tax offset in 2018-19, with high income earners getting very little. This part of the plan is progressive – more money goes to lower income earners.
However, by 2024-25, the tax cuts means high income earners gain A$7,225 per year, while those earning A$50,000 to A$90,000 gain A$540 per year, and those earning A$30,000 gain A$200 per year.
Of course, another factor of tax cuts is that they only benefit those who are employed. Tax cuts don’t benefit people like the unemployed, pensioners, students (usually young people) and those on disability support pensions.
The conversation Australians need to have is how we should be spending the revenue boost we are seeing over the next few years. We can either spend this windfall gain on benefits to high income earners, in the hope that this will flow through spending to everyone else; or maybe we should encourage young people into housing through an increase to the first home owners grant, or increased funding for our schools, universities and health system.
We’ve developed a budget calculator so you can see how your family is affected by the 2018 budget.
Author:Robert Tanton, Professor, University of Canberra; Jinjing Li, Associate Professor, NATSEM, University of Canberra
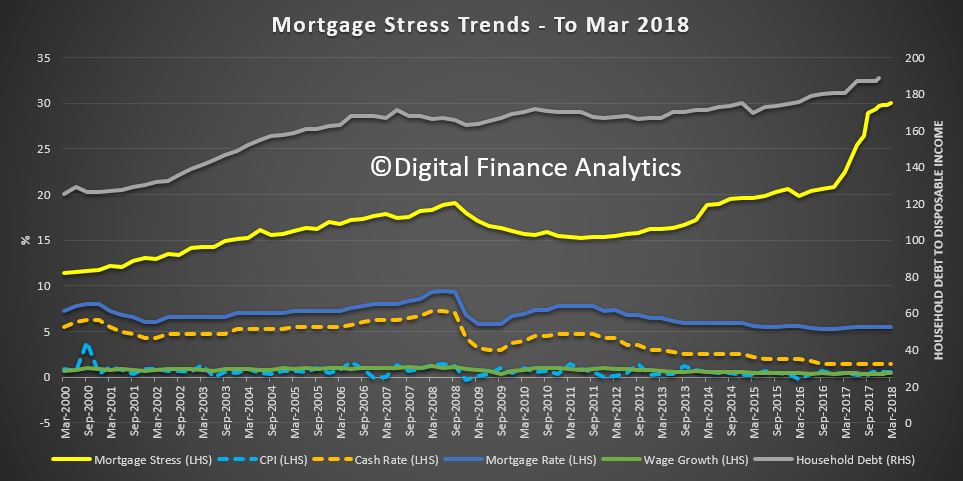
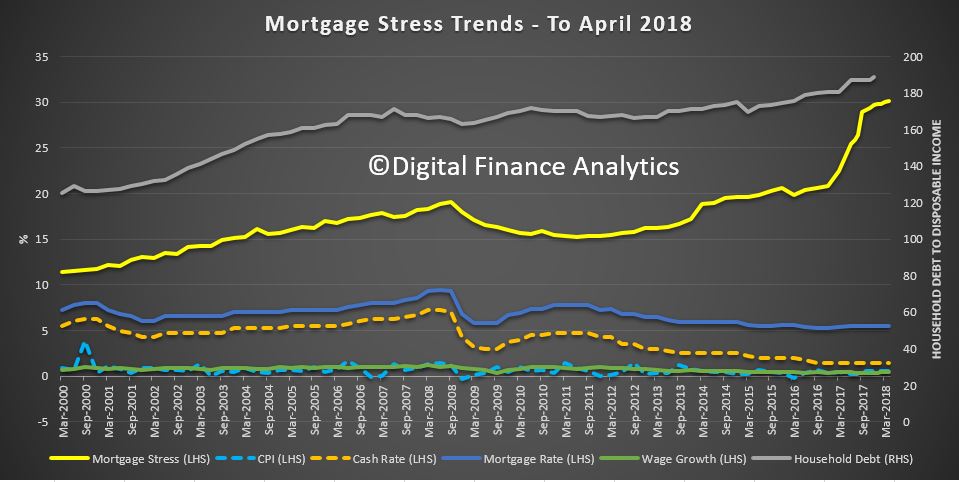
Digital Finance Analytics (DFA) has released the April 2018 mortgage stress and default analysis update.
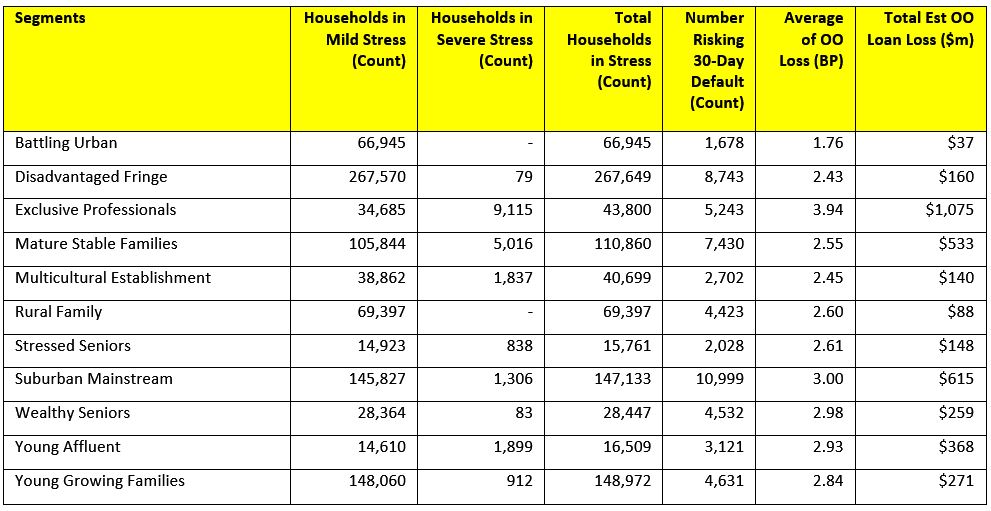
Across Australia, more than 963,000 households are estimated to be now in mortgage stress (last month 956,000). This equates to 30.1% of owner occupied borrowing households. In addition, more than 21,600 of these are in severe stress, up 500 from last month. We estimate that more than 55,600 households risk 30-day default in the next 12 months. We expect bank portfolio losses to be around 2.8 basis points, though losses in WA are higher at 5 basis points. We continue to see the impact of flat wages growth, rising living costs and higher real mortgage rates.
Martin North, Principal of Digital Finance Analytics says “overall, risks in the system continue to rise, and while recent strengthening of lending standards will help protect new borrowers, there are many households currently holding loans which would not now be approved. The recent Royal Commission laid bare some of the industry practices which help to explain why stress is so high. This is a significant sleeping problem and the risks in the system remain higher than many recognise”.
News On the Finance Sector Is Set to Get Worse.
Australia is horrified by what they are learning from the Royal Commission; yet this is only the beginning. News on the finance sector is set to get much worse.
Gill North, a Professor of law at Deakin University and Principal at DFA, suggests “the issues highlighted by the RC represent only the tip of the iceberg and Australia is in for a bumpy and uncomfortable ride”. The systemic risks across the financial sector and economy are now much higher than most participants realise, and these risks are exacerbated by the concentration of the finance sector and its many interconnections, the laxity of the lending standards over the last decade, the high levels of household debt (and the distribution of this debt), and the heavy reliance of the Australian economy on the health of the residential property market.
At some point down the road, the true resilience of the financial institutions, their consumers, and the broader economy will be tested and put under extreme pressure. And when this occurs, the high levels of household debt and financial stress, and the large disparities between the population segments that have considerable income, savings and wealth buffers, and those who have no such buffers, will become starker. “When the next housing or financial crisis hits (and the question is when and not if), the ensuing impact on the finance sector, many Australian households, and the broader economy will be severe. Yet most, if not all, of the financial institutions, the regulators, policy makers, and consumers still remain largely oblivious to what lies ahead.”
Martin North says: “We continue to see the number of households rising, and the quantum is now economically significant. Things will get more severe, especially as household debt continues to climb to new record levels. Mortgage lending is still growing at two to three times income. This is not sustainable and we are expecting lending growth to continue to moderate in the months ahead as underwriting standards are tightened and home prices fall further”. The latest household debt to income ratio is now at a record 188.6.[1]
Our analysis uses the DFA core market model which combines information from our 52,000 household surveys, public data from the RBA, ABS and APRA; and private data from lenders and aggregators. The data is current to end April 2018. We analyse household cash flow based on real incomes, outgoings and mortgage repayments, rather than using an arbitrary 30% of income.
Households are defined as “stressed” when net income (or cash flow) does not cover ongoing costs. They may or may not have access to other available assets, and some have paid ahead, but households in mild stress have little leeway in their cash flows, whereas those in severe stress are unable to meet repayments from current income. In both cases, households manage this deficit by cutting back on spending, putting more on credit cards and seeking to refinance, restructure or sell their home. Those in severe stress are more likely to be seeking hardship assistance and are often forced to sell.
The forces which are lifting mortgage stress levels remain largely the same. In cash flow terms, we see households having to cope with rising living costs – notably child care, school fees and fuel – whilst real incomes continue to fall and underemployment remains high. Households have larger mortgages, thanks to the strong rise in home prices, especially in the main eastern state centres, and now prices are slipping. While mortgage interest rates remain quite low for owner occupied borrowers, those with interest only loans or investment loans have seen significant rises. We expect some upward pressure on real mortgage rates in coming months as international funding pressures mount, a potential for local rate rises and margin pressure on the banks thanks to a higher Bank Bill Swap Rate (BBSW).
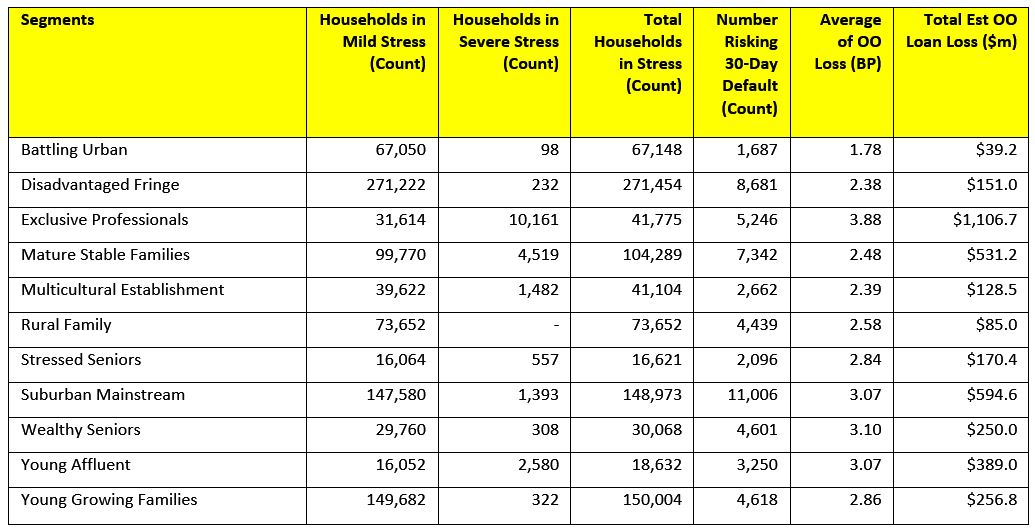
Probability of default extends our mortgage stress analysis by overlaying economic indicators such as employment, future wage growth and cpi changes. Our Core Market Model also examines the potential of portfolio risk of loss in basis point and value terms. Losses are likely to be higher among more affluent households, contrary to the popular belief that affluent households are well protected.
Stress by The Numbers.
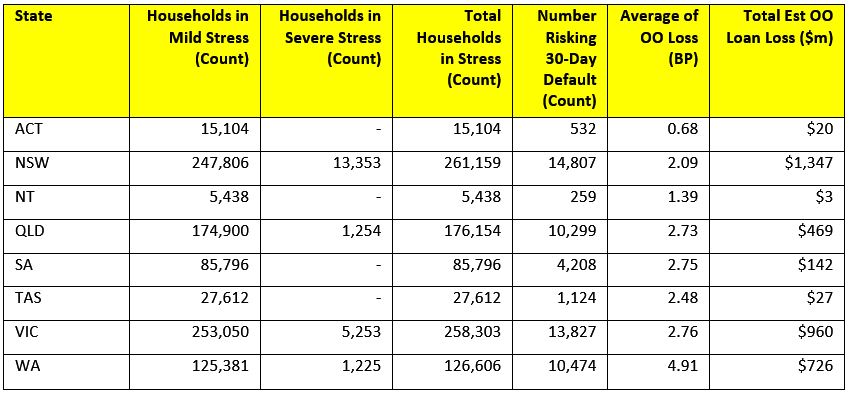
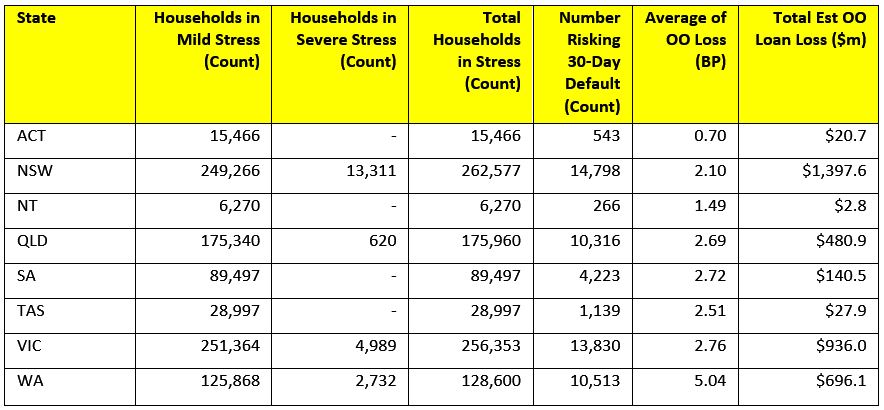
Regional analysis shows that NSW has 262,577 households in stress (261,159 last month), VIC 256,353 (258,303 last month), QLD 175,960 (176,154 last month) and WA has 128,600 (126,606 last month). The probability of default over the next 12 months rose, with around 10,513 in WA, around 10,316 in QLD, 13,830 in VIC and 14,798 in NSW.
The largest financial losses relating to bank write-offs reside in NSW ($1.4 billion) from Owner Occupied borrowers) and VIC ($936 million) from Owner Occupied Borrowers, which equates to 2.10 and 2.76 basis points respectively. Losses are likely to be highest in WA at 5 basis points, which equates to $696 million from Owner Occupied borrowers. A fuller regional breakdown is set out below.
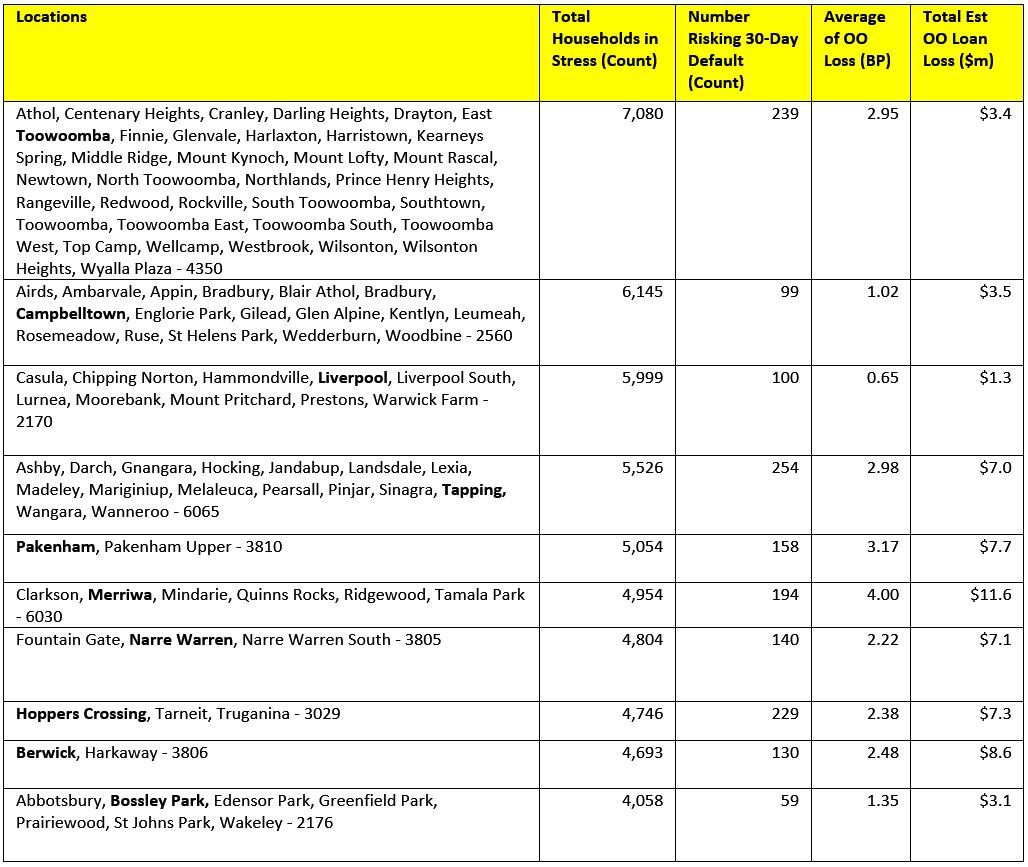
Here are the top post codes sorted by the highest number of households in mortgage stress.
[1] RBA E2 Household Finances – Selected Ratios December 2017 (Revised 3rd April 2018).
You can request our media release. Note this will NOT automatically send you our research updates, for that register here.
[contact-form to=’mnorth@digitalfinanceanalytics.com’ subject=’Request The April 2018 Stress Release’][contact-field label=’Name’ type=’name’ required=’1’/][contact-field label=’Email’ type=’email’ required=’1’/][contact-field label=’Email Me The April 2018 Media Release’ type=’radio’ required=’1′ options=’Yes Please’/][contact-field label=”Comment If You Like” type=”textarea”/][/contact-form]
Note that the detailed results from our surveys and analysis are made available to our paying clients.
Assistant Treasurer Michael Sukkar has encouraged consumers to ‘Go paperless to save money’ launching a national education campaign to help consumers stop paying unnecessary fees to receive paper bills.
The Hon. Michael Sukkar first encouraged consumers to opt to receive digital bills before urging those who need paper bills to find out if they are eligible for fee exemptions. The implementation of an education campaign was first announced by former Minister for Consumer Affairs Michael McCormack following a Consumer Affairs Forum which recognised vulnerable consumers needed to be protected against unfair paper fees.
“This approach from the Minister is not only disappointing but shows a clear lack of understanding on the issues Australian consumers are facing in regards to paper billing fees,” commented Kellie Northwood, Executive Director, Keep Me Posted. “The suggestion from the Minister is to ‘Go paperless to save money’. Yet who will be saving money? Certainly not the Australian consumers who will need to buy a computer, a printer, paper and internet connection to print their bills and statements at home. The only people the Minister is saving money for in this case are the banks and super profit companies.”
Keep Me Posted has advocated for a ban on paper fees on important communications for two years.
The campaign, a coalition of representatives from the print, paper and mail industry, charity, trade unions and community groups, argues that vulnerable Australians are impacted the most by paper fees, those on the wrong side of the digital divide. The latest data from the ABS shows that since 2014-2015 the digital divide hasn’t narrowed and currently, close to 1.3 million Australian households are still not connected to the internet. Data shows that disadvantaged Australians are more likely to be digitally excluded: elderly, low-income households, people living with a disability, and people living in remote communities.
“The Royal Commission into Banking and Financial Services is demonstrating daily the need for strong consumer protections for Australians in this regard,” furthered Northwood. “We believe the
role of the Minister for Consumer Affairs is to protect consumers against unfair fees, not assist corporates in their marketing campaigns for their digital tools.”
Paper fees have been implemented in the banking sector by some of the major providers such as Commonwealth Bank, Bankwest or Macquarie Bank. Ranging between $1.25 and $2.50 for a paper statement, fees can ramp up to $7.50 for a paper copy of a statement requested at a bank’s branch as seen recently with Westpac. Other providers such as NAB have automatically switched their customers to digital communications without requesting proper consent.
Over the last two years, Keep Me Posted has distributed thousands of template letters to help consumers request an exemption of paper fees as many are unaware of their rights. More concerning however, is many report struggling to argue their case to their service providers. The newly launched education campaign was expected to assist them, however, Keep Me Posted argues the campaign falls well short and does not support the spirit of the Consumer Affairs Forum agreement.
“Treasury’s consultation paper into paper billing fees recognised that ‘consumers from disadvantaged groups who cannot transition to digital bills are being disproportionately impacted by fees for paper billing’,” said Northwood. “Twenty-eight (28) out of forty-three (43) organisations that publically contributed to Treasury’s consultation supported a total ban on paper fees. This is a strong response that consumers shouldn’t have to pay the price of corporates trying to cut their costs by any means. We are looking forward to seeing Treasury’s recommendations on the issue and hope to see Australia joining the list of many other countries that have already legislated in this regard and provided consumer protections.”
Globally, Austria, Belgium, France, Finland, Germany, Ireland, Netherlands, Spain, and the US State of Pennsylvania have already legislated that print and postage are a cost of doing business that must not be passed onto customers. Keep Me Posted hopes Australia is next.
Interest only loans are rarely out of the news. Following ASIC’s interim review the September quarter posted a knee-jerk 44.8% decline in new IO loans and lending practices are now firmly in the regulator’s crosshairs. APRA and RBA have already clamped down and further scrutiny is expected during the royal commission.
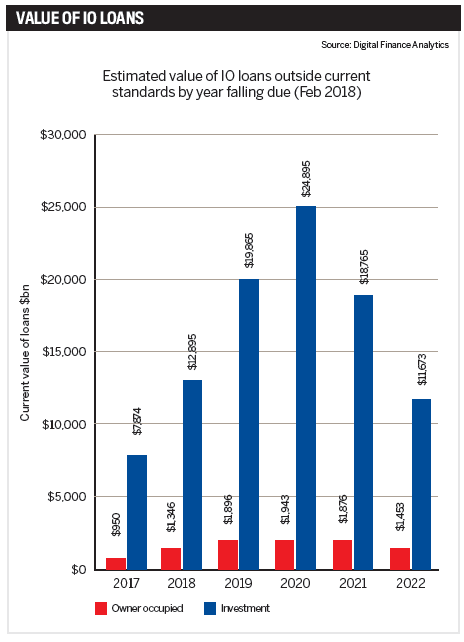
The regulators aren’t the only ones concerned. In February, assistant governor Michele Bullock delivered a speech on mortgage stress in which she highlighted a “large proportion of interest-only loans are due to expire between 2018 and 2022”.
That large proportion is, in fact, almost every IO loan written between 2013 and 2016, and subsequent analysis of IO property fixed-term lending by Digital Finance Analytics has calculated the total number at 220,000, with values upwards of $100bn.
These loans originate from before the reviews of 2015 and 2017, and in the coming year the fixed terms on 14% of them will face a reset outside of current lending criteria. By 2020, the value of loans due for renegotiation is expected to reach $27bn.
While there are many options open to these borrowers, Bullock calls it an “area to watch”, saying many could find themselves in financial stress.
“Some homeowners may not realise they are fast approaching the end of their five-year term and, if they do nothing, their lender will automatically roll them onto a P&I loan that could be challenging for them to support,” says Zippy Loans’ principal broker Louisa Sanghera.
“Combine this scenario with a slowing of the property market and clients may not have the buffer of equity to soften the blow.”
To the customer, interest-only is an attractive proposition for a number of reasons, from freeing up cash to tax incentives. Additionally, investors have widely financed rental property investments on an IO basis while paying down their owner-occupied P&I loan. Executive director of The Local Loan Company, Ray Hair, observes that it’s a decades-long trend, one that has taken place right under the radar of regulators and banks.
To date, availability has largely driven demand for IO, but with many borrowers now preparing to face the consequences of their honeymoon financial planning, a mounting collection of horror stories could change that.
“Whenever regulators initiate corrective action in a market there is an initial period of over correction, however the pendulum generally swings back to a position of equilibrium. Sadly, this is of little comfort to those caught out by the overnight changes in policy, increased interest rates and institutional disregard for the personal cost,” says Hair.
“Expect to see some very angry investors looking for a lender, broker or adviser to blame, and pay compensation” Ray Hair, The Local Loan Company
Major lenders are preparing their broker networks for further changes to lending criteria, and are actively assessing the terms of loans due to expire to 2022. But with many below the cap and borrowers looking for IO products, the call to return to business as (almost) usual has been too strong to resist.
“We have seen several major lenders loosen the reigns and cut the rates for interest-only loans again, likely because they are sitting below the cap and are looking to add more interest-only loans to their books. It will be interesting to observe whether other lenders follow and how this plays out in terms of consumer behaviour,” says Uno Home Loans CEO Vincent Turner.
The mortgage crunch
In January, UNSW professor of economics Richard Holden published a sobering observation of Australia’s relationship with high-LVR and IO loans. In it he reported Australian banks lend an average 25% more than their US counterparts and that these loans are poorly structured and sometimes based on falsified or inaccurate household finances.
A decade ago, US banks learned this lesson the hard way, when five-year adjustable rate mortgages could not be refinanced and the fallout triggered a chain reaction that dragged most of the globe into recession.
In Australia, IO lending has comprised as much as 40% of the loan book at the major banks, and a particularly large share of property investors choose IO. The number of new IO loans is in overall decline, $156bn borrowed in 2015 to $135.5bn in 2017, but their share is still significant. In the owner-occupier market they count for one in four loans, and in the investor market it’s two in three.
“Interest-only loans in Australia typically have a five-year horizon and to date have often been refinanced. If this stops then repayments will soar, adding to mortgage stress, delinquencies, and eventually foreclosures,” Holden told Australian Broker at the time.
“It’s our professional and ethical obligation to look after the best interests of our clients and help them plan strategies” Louisa Sanghera, Zippy Loans
A teacher at the University of Chicago when the US housing market crashed, he added, “The high proportion is similar to the high proportion of adjustable rate mortgages in the US circa 2007.”
So how scared should people be? According to Hair, a lot of people “should be very afraid”, although he says dynamic lending policies, a banking sector unwilling to lose market share and strength in non-bank lenders will dampen some impact.
Quoting the DFA data, he adds, “Unfortunately, there will be pain for highly leveraged borrowers with negative equity, as there has been in the past with an oversupply of apartments, restrictions on non-resident lending and the fall
in property values in mining-dependent regional towns.”
For Turner, the concerns are overstated on a macro level, and reasonable lead times for a switch are all most borrowers will need. However, he warns, “The bigger concern should always be unemployment that triggers substantial hardship, very quickly across a broad group of people, which has the effect of contagion.”
Hero or villain?
While there are many unknowns in how borrowers and lenders will cope with the switch to P&I, what is known is that brokers could find themselves very busy between now and 2022.
“It’s our professional and ethical obligation to look after the best interests of our clients and help them plan strategies that are sustainable and supportive of their personal financial goals,” says Sanghera, who predicts a “positive impact overall” for brokers.
At Zippy Loans active management of IO customers means the lender has very few of the loans on its books. Responding to the rises in interest rate charges over recent months, Zippy has contacted its IO clients to move them onto a workable P&I solution.
“Clients will need to consider a broader range of lending options to find a product that works for them and brokers are ideally placed to research these options on their behalf. I believe this will result in more people turning to brokers to navigate the ever-more complex market place and secure the right solution,” she adds.
Throughout this process, transparency will be key, as Turner notes, “Brokers who continue to push expensive interest-only loans will probably lose business to those who show their customers when P&I works and when IO is the better option. In most cases it isn’t.”
However, brokers will also be the bearers of bad news as some are forced to sell and, according to Hair, it’s likely a lot of disgruntled borrowers will pursue their brokers in the courts, as many have done before when things have not gone their way.
Advising brokers to keep “well documented notes” of original transactions and borrower objectives, as well as subsequent attempts to refinance, he says: “Brokers will be both the heroes and the villains in this pantomime.”
“Expect to see some very angry investors looking for a lender, broker or adviser to blame, and pay compensation, for the position they find themselves in,” he adds.
Is this Australia’s sub-prime crisis? From those in the industry it’s a unanimous no. However that doesn’t mean to say a significant number of borrowers won’t receive a harsh wake-up call.
“The bigger concern should always be unemployment that triggers substantial hardship … which has the effect of contagion” Richard Holden, UNSW
For Holden, the damage has already happened and recent measures are too little too late. Although he refers to tighter lending standards as “comforting”, he says the 30% cap is “about all that can be done” at this point.
Australia’s smaller lenders lack the resources to manage more of the IO debt burden, meaning a mass exodus of customers away from the majors is unlikely. That doesn’t mean to say the majors won’t step up to the potential competition. As Hair predicts,
this could bring some attractive offers for borrowers looking to switch or refinance.
For now, it’s all eyes on the interest rate. On the one hand, no change in the cash rate for 19 months has manufactured a level of stability, on the other it’s delayed the hangover. The IMF has already advised implementation of US-style signalling for potential hikes, although after the last month there is some way to go before reaching the 4% rate it expects to see by late 2019.
Regardless of what happens, some pockets of stress are expected.
Within the industry, brokers have a chance to step up and guide customers through the uncertainties, but the watchful eyes of the regulators will be on them.
A $100bn question remains: how wealthy is the average Australian borrower? Those writing the rulebook say wealthy enough to cover higher mortgage payments. Those who have seen the cycle play out elsewhere, say otherwise.
One of the benefits of the DFA channel, as it develops, is the discussion and questions raised in the community. I have already been able to create content to meet specific requests and issues and will do more as we progress. For example, I am working on a series relating to crypto currencies, and another on property ownership (or not) across various household segments. Then there is more to say about The Chicago Plan, and how it might be practically be implemented.
But one of the most common threads is this. Ok, so I understand the risks in the property and finance sectors are increasing, but what should I do, how should I plan, and react. In fact, that often translates to two subsequent questions. First is, where should I put my savings in this high risk environment and second, I have been hearing about the risks in the systems for years, and so did not buy property then and consequently have missed out on significant capital gains. My friends thought I was nuts. So what’s different this time? Why should I stay away from property now?
So I want today to begin explore these questions further. And I need to say upfront, this is not financial advice. I am neither qualified to provide such advice and in any case, in this piece I could not take individual needs or financial situations into account. But, you might want to refer to my earlier programme – “Should I Buy Now”? which I published on 27th January this year.
But what I can do is to go beyond the often cartoonish statements being made at the moment. My favourite silly remark this past week was “the fall in property value offers the change for great buying, now”. I won’t embarrass the person who said this, other than to say they represent, no surprise, perhaps, the real estate industry. The RBA’s recent assertion that most households will cope with a rise in interest rates, and the switch from interest only to principle and interest loans would be another.
So let’s start with where should I put my savings in this high risk environment. As context, let’s look at what happened to UK bank Northern Rock.
Northern Rock, one of Britain’s Biggest Bank, began as a mutual in the North East, but then in 1997 it converted to a bank, offering members “free shares”. Later it became home to the 125% mortgage, and made the error of borrowing very short term, on the bond markets, whilst lending to customers for 25 years or more. Worse they then packaged those mortgages up and sold them on mainly to US banks. Whilst property prices were rising, and credit was free and easy all was well. Savers also put their money with the bank and got above average returns. The bankers looked like magicians and investors piled in. But then came the crash. House prices fell. The value of the mortgages fell too and the Bond markets then stopped lending to the Rock. So the cash flow stopped, but the bank needed billions of pounds just to keep the bank running. They were forced to seek assistance from the Government. No reason for depositors to panic, said the commentators at the time. Well that set the cat among the pigeons. Banks did not trust each other enough to lend to each other in the money markets and customers found their money in the bank was not as safe as people thought. And that was around 18 billion pounds.
The bank was nationalised in 2008, but this was just the start, and the UK Government was forced to spend $1 trillion pounds, yes, $1 trillion pounds on rescuing banks. In a subsequent review, the banking regulators were accused of applying light tough approaches to regulation. The assumption was that the financial system was full of such clever people, that self-regulation was sufficient – something with FED Chair Greenspan later came to recognise was a fallacy.
Five years later, on the other side of the crisis, when debt had been reduced, the full impact on the economy was clearer to see.
So, back to the present. We know that household debt is very high in Australia, the banks have made massive volumes of “liar loans” and global interest rates are rising. In addition, we are already seeing credit being tightened, and home prices are sliding. There is more to come, as discussed in our four scenarios video, which you might want to watch.
If you hold property, as an owner occupier, chances are the value of your property will fall, and the paper profits you think you have may be illusory. But the mortgage won’t be, and we know that many are struggling with big debts and poor cash flow. The good news, is that provided you can continue to make repayments, slipping into negative equity is not an immediate problem, but of course it may mean people are locked into the current properties. In Ireland and the UK, 10 years later, values have recovered, but it was a slow recovery. But if jobs dry up, default becomes more likely.
If you are an investor in property, and given many are not seeing any growth in rental receipts, you may find things more problematic – especially if you have several properties, on interest only loans. Repayments on these loans are likely to increase, as the RBA said the other day. In fact, some of the smartest money in the investment sector has already sold to realise their capital gains – but as values slide, this becomes a less attractive option. Research shows that investors are four time more likely to default on their mortgages, and so will be forced to sell in a downturn. Less experienced investors will likely be left holding the baby.
If you have savings in deposits, chances are the interest rates on those balances have already been cut, as banks try to protect their margins. Whilst mortgage interest rates are often discussed, the poor old saver continues to get a bad deal, yet this does not get much attention. I have always been surprised more is not made of this.
This takes us to the Bail-In question. I won’t go over the arguments again, you can watch my separate video on this.
But two points. First, there is a theoretical government backed deposit guarantee up to $250,000 (as we record this), but it needs to be activated by the Government, on an individual bank basis, so it is not in force today. Second, APRA says deposits will not be bailed-in, despite the fact the APRA now has the power to grab “other instruments” to assist in a bank restructure, and in New Zealand, deposits are definitely up for grabs. The situation in Australia, in my view is deliberately vague. Deposit bail-in could have been expressly excluded, but were not. The $250k guarantee is per financial entity, so you may be able to spread your risks by sharing deposits across multiple separate Australian based banks. Local subsidiaries of international banks are also included provided they are licenced locally. The $250,000 would cover all deposits, including term accounts, so it is not a limit by account, but by banking relationship. Also check if you are using an overseas bank, as they may not be guaranteed. It is worth asking now. Get it in writing.
Money held in superannuation funds will probably be placed with various market investments such as shares and bonds and some cash. But unless your funds are held in a separate self-managed superannuation account, the $250,000 deposit account guarantee would not apply. And it is worth checking with your bank if you have a self-managed deposit account to ensure it is.
Obviously market investments like shares and bonds will react to poor market conditions. We have seen market crashes of 25% or more in the past, and investments may well fall. There are no guarantees. Superfund balances can and will fall, but they will still take their management fees.
Some advocate placing money in Bitcoin or other cyber currencies, because they have decentralised block-chain records which mean Governments cannot get their hands on the funds placed there. While that may be true, values are very volatile, and I regard such Cyber investments as purely speculative and risky. Not really a core or secure option in my view.
What about gold or silver? Well, at least you hold something physical and in the past in crisis, these commodities have retained more value. But then you have the storage risk, and the liquidity risk. If you wanted to realise value later you need to find a buyer, and pricing is not certain. This is also true of ETF’s, and prices may fall.
So, should you hold cash, in notes? Surprisingly, it appears more funds are indeed being held in this form (for example in the UK, never has so much been held in notes – so the Bank of England is looking at removing the fifty-pound note. This is partly to reduce the size of the black economy, and partly to reduce the floats people hold. One point to bear in mind is that there is physical risk – notes burn for example, and you get no interest on notes held, but at least there is less chance of losing more value if the notes are safe.
And that’s the point, there are no easy answer to the question what should I do. It really does depend on your risk appetite, and whether you are most concerned about safeguarding the current value of what you have, or whether you are looking for future capital growth. Generally, I think it is true that risks are reduced by spreading savings and investments across multiple options, but then there is a trade off as complexity costs.
Now, turning to the question of what is different this time, with regards to property prices. In a word availability of credit. In the last decade or so, property prices have moved up and down, but the banks have been willing – very willing – to lend. This has driven prices higher and so many who bought a few years back are sitting on paper profits.
But the tightening of credit which we are seeing now will force prices lower, turn investors away, and as some are also forced to sell, this additional feedback loop will also force prices lower again. If you add in the lower number of foreign buyers, I cannot see a scenario where prices take off again anytime soon. My base case is a drop of 15-20% over the next couple of years. But I could be wrong.
A final point. Many households do not have a handle on their household budgets, so as I keep saying, it is worth drawing up a budget so you can see where the money is coming and going. You may be surprised. Then you can actively manage and prioritise your spending. This is the first critical step to getting to grips with your finances.
Also banks have a legal responsibility to assist in cases of hardship, so if you are in financial difficulty, it is worth talking to them.
So in conclusion, there are no easy answers to this conundrum. Which is why the level of uncertainly is currently so high, and I cannot see this settling down anytime soon.
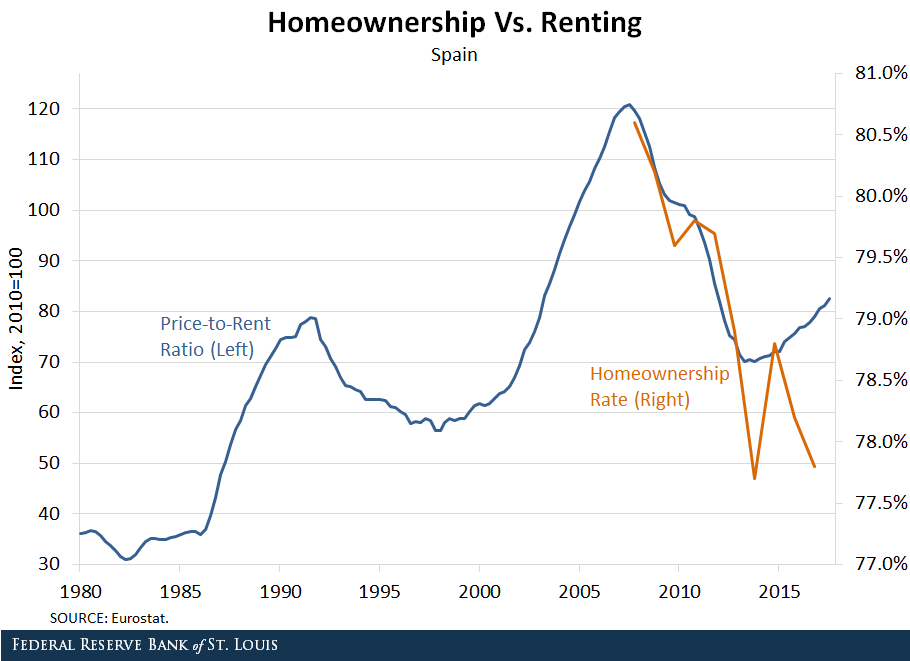
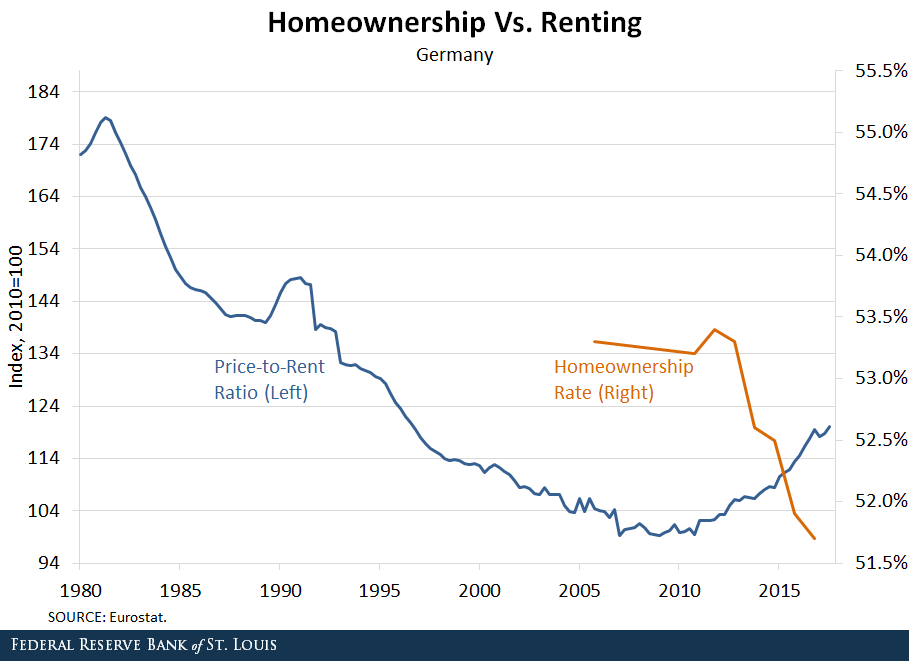
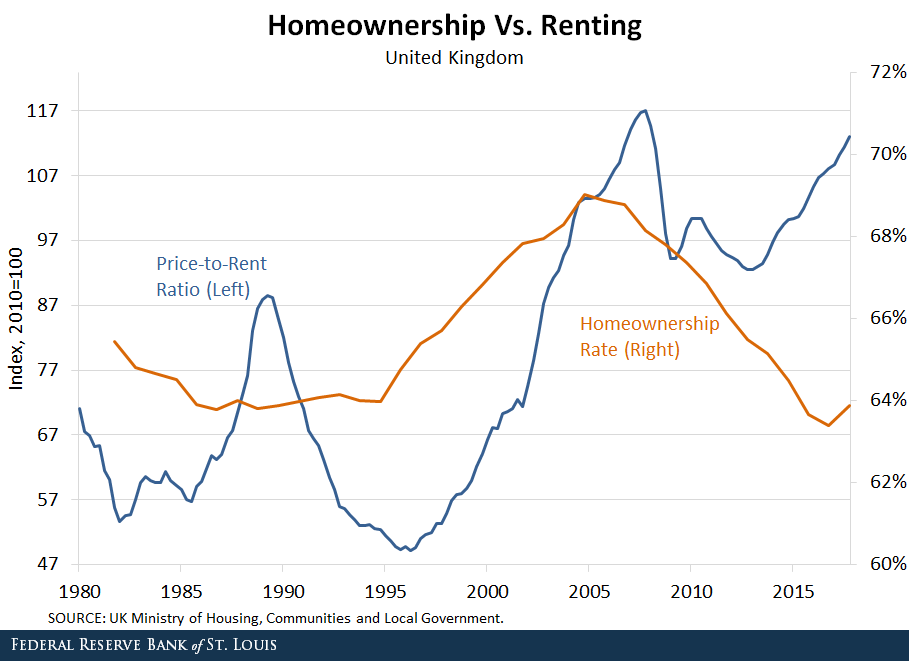
An excellent FED post which discusses the decoupling of home ownership from home price rises. We think the answer is simple: the financialisation of property and the availability of credit at low rates explains the phenomenon.
In the aftermath of WWII, several developed economies (such as the U.K. and the U.S.) had large housing booms fueled by significant increases in the homeownership rate. The length and the magnitude of the ownership boom varied by country, but many of these countries went from a nation of renters to a nation of owners by around the late 1970s to mid-1980s.
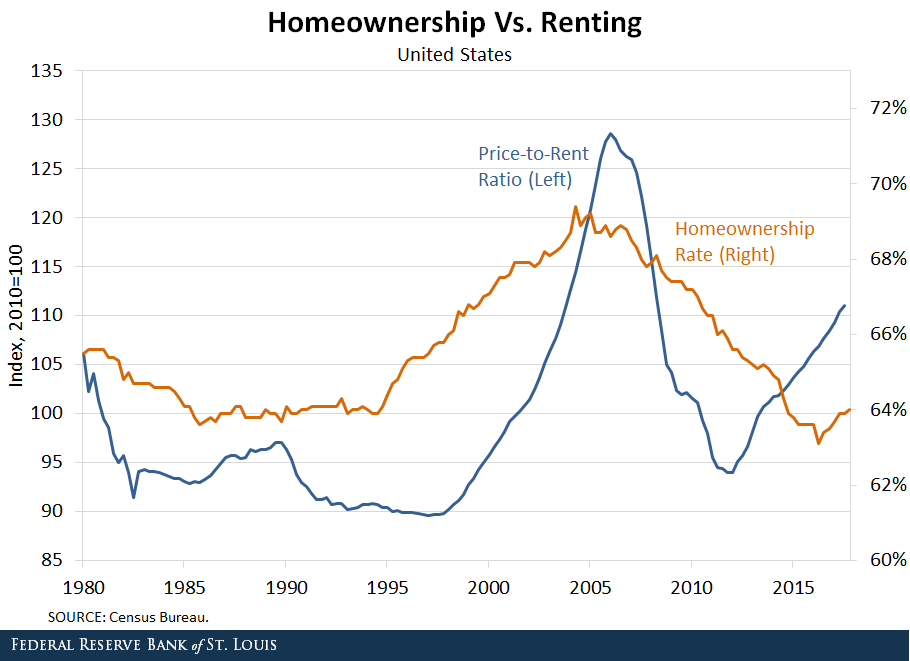
Historically, the cost of buying a house, relative to renting, has been positively correlated with the percent of households that own their home. From 1996 to 2006, both the price of houses and the homeownership rate increased in the U.S. This increasing trend ended abruptly with the global financial crisis that drove house prices and homeownership rates to historically low levels.
It is reasonable to expect prices and homeownership to move in the same direction. A decrease in the number of people who want to buy homes to live in could lead to a decrease in both prices and homeownership. Similarly, an increase in the number of people buying homes to live in could lead to an increase in both prices and homeownership.
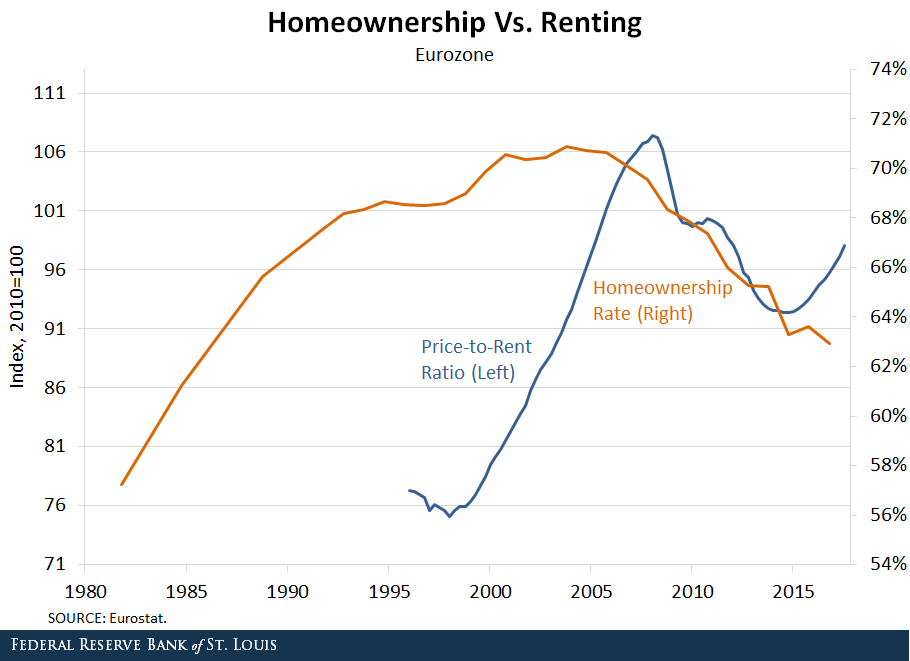
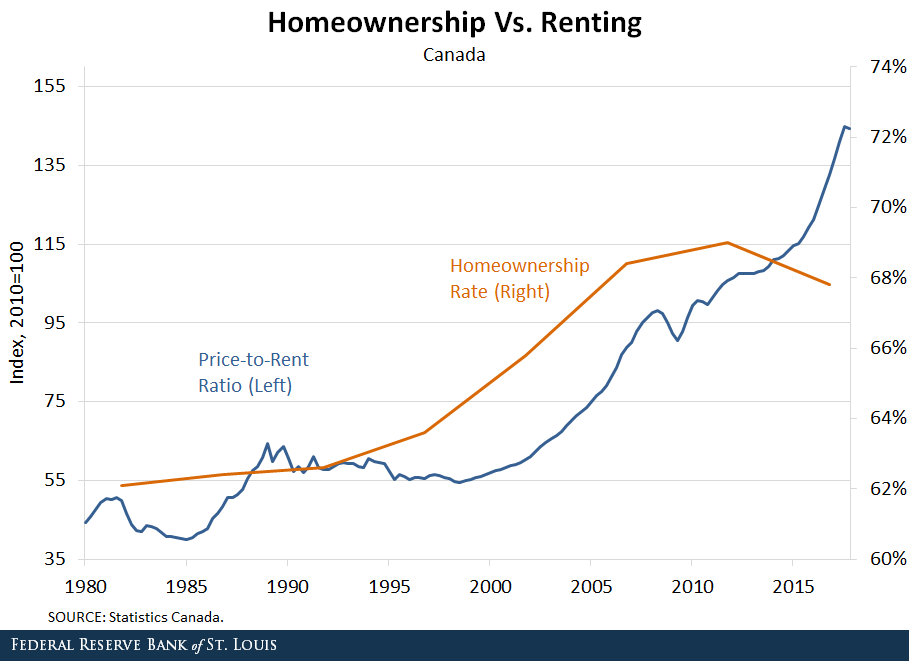
However, recent evidence indicates that the cost of buying a home has increased relative to renting in several of the world’s largest economies, but the share of people owning homes has decreased. This pattern is occurring even in countries with diverging interest rate policies. It is important to delve into this fact and try to find potential explanations. (For trends in homeownership rates and price-to-rent ratios for several developed economies, see the figures at the end of this post.)
Increasing Cost of Housing
The price-to-rent ratio measures the cost of buying a home relative to the cost of renting. Factors like credit conditions or demand for homes as an investment asset affect the price of houses but not the price of rentals. These and other factors cause the price-to-rent ratio to move.
Over the period 1996-2006, the cost of buying a home grew more quickly than the cost of renting in many large economies. For example, the price-to-rent ratio in the U.S. increased by more than 30 percent between 2000 and 2006. Even larger increases occurred in the U.K. and France, where the price-to-rent ratio rose by nearly 80 percent over the same period.
The price-to-rent ratio declined in the wake of the housing crisis in the U.S., the eurozone, Spain and the U.K., but in the past few years, it has started to increase again. The price of houses is again increasing more quickly than the price of rentals.
Decreasing Homeownership
However, the homeownership rate has not increased along with the price-to-rent ratio. The homeownership rate (the percent of households that are owner-occupied) has fallen in several large economies:
In the U.S., the homeownership rate fell from around 69 percent before the recession to less than 64 percent in 2016.
In the U.K., the rate fell from nearly 69 percent to around 63 percent.
The homeownership rates in Germany and Italy have also fallen.
Diverging Policies
The pattern of increasing house prices and decreasing homeownership has occurred even in countries with diverging monetary policies:
By 2016, the Federal Reserve had ended quantitative easing and had begun raising rates in the U.S.
In contrast, the Bank of England and the European Central Bank continued quantitative easing throughout 2016 and reduced rates.
Nonetheless, the homeownership rate continued to fall in the U.S., the U.K. and many parts of Europe, while the price-to-rent ratio continued to increase.
Housing Supply
Several factors could be driving the decoupling of the price-to-rent ratio and the homeownership rate. From the housing supply side, there is a trend toward decreased construction of starter and midsize housing units.
Developers have increased the construction of large single-family homes at the expense of the other segments in the market. From 2010 to 2016, the fraction of new homes with four or more bedrooms increased from 38 percent to 51 percent.
This limited supply, particularly for starter homes, could result in increased prices for those homes and fewer new homeowners. One possible factor is regulatory change. The National Association of Home Builders claims that, on average, regulations account for 24.3 percent of the final price of a new single-family home. Recent increases in regulatory costs could have encouraged builders to focus on larger homes with higher margins. Supply may be just reacting to developments in demand that we discuss next.
Housing Demand
From the demand side, there are three leading explanations, which are likely complementary and self-reinforcing:
Changes in preferences toward homeownership
Changes in access to mortgage credit
Changes in the investment nature of real estate
Preferences for homeownership may have changed because households who lost their homes in foreclosure post-2006 may be reluctant to buy again. Also, younger generations may be less likely to own cars or houses and prefer to rent them.
Demand for ownership has also decreased because credit conditions are tighter in the post-Dodd Frank period.
Real Estate Investment
The previous demand arguments can explain why the price-to-rent ratio dropped post-2006. As rents grew relative to home prices, together with the low returns of safe assets, rental properties became a more attractive investment. This attracted real estate investors who bid up prices while depressing the homeownership rate.
Moreover, builders increased their supply of apartments and other multifamily developments. From 2006 to 2016, single-family construction projects declined from 81 percent to 67 percent of all housing starts.
There are several types of real estate investors:
“Mom and dad” investors looking for investment income
Foreign investors who have increased real estate prices in many of the major cities of the world
Institutional landlords like Invitation Homes or American Homes 4 Rent
In fact, since 2016 the real estate industry group has been elevated to the sector level, effective in the S&P U.S. Indices.
In addition, the widespread use of internet rental portals such as Airbnb and VRBO has increased the opportunity to offer short-term leases, increasing the revenue stream from rental housing.
There are several potential explanations, but more research is needed to determine the cause of the decoupling of house prices from homeownership rates and what it means for the economy.
Authors: Carlos Garriga, Vice President and Economist; Pedro Gete, IE Business School; and Daniel Eubanks, Senior Research Associate
Precarious employment is increasing over time, and it still remains higher for women than men in Australia. But over the last nine years it has increased far more rapidly among men.
This is despite greater workforce participation and lower unemployment rates in Australia’s labour market. The quality of jobs in Australia has been declining.
In a new Bankwest Curtin Economics Centre report, we develop a composite index of precarious employment using data from the Household Income and Labour Dynamics in Australia (HILDA) survey.
The HILDA survey captures job attributes, labour force circumstances and other information about a large and representative sample of Australian workers. The index is based on 12 component indicators that capture different dimensions of precarious employment.
These include measures related to job insecurity like workers’ own views of their future employment prospects, the chance of losing their jobs, and their overall sense of job security.
We also looked at irregular hours, working fewer or more hours than desired, and a loss of work-life balance to capture the degree of control over working hours. For employment protections and other working conditions, the index uses measures related to leave entitlements including sick, family and compassionate leave.
The calculated index is centred on the average measure of precarity across all occupations and industries. Negative numbers mean lower employment precarity than the average and positives convey greater precarity. The larger the value, the more precarious the work, relative to the all-industry average.
The index shows the overall state of the economy has had a significant impact on the level of precarious employment in the labour market.
It shows levels rising for both men and women since the global financial crisis.
However, for men, precariousness is now above 2003 levels, which suggests precarious work is being driven by more than just economic conditions. And while men are still below the levels of women, the two are beginning to converge.
A major source of this trend is an increase in the self-reported probability of losing one’s job and accompanying dissatisfaction with job security.
Despite relatively stable and low levels of unemployment, workers are increasingly concerned that their jobs are at risk. The same holds true for satisfaction with job prospects, which dropped significantly since the global financial crisis and has yet to recover.
As expected, higher skilled occupations such as professionals and managers have more stable employment, while labourers and machinery operators and drivers are in the most precarious job circumstances.
Job insecurity has increased most among clerical and administrative workers and labourers, while for managers the key drivers are the loss of control over working hours and a reduction in work-life balance.
Working for government, a bank or insurance company appears to still be a relatively “safe” option. Industries with the lowest levels of precarious employment are public administration, financial and insurance services, and utilities.
By contrast, accommodation and food, agriculture, forestry and fishing, and arts and recreation services are much more precarious for their employees. Mining and to a lesser extent education have become more precarious in recent years.
Precariousness by industry and occupation
Employment precariousness, by occupation and industry.The index is centred on the overall industry average (as represented by zero). Negative numbers correspond to lower employment precarity than the average, positives convey greater precarity.
Precarious work more prevalent in some industries
There are several factors affecting the likelihood of a worker facing more or less precarious work, including the nature of the industry they are working in.
Some industry sectors, such as manufacturing, construction or mining, have a greater exposure to economic downturns or upturns, and global market forces.
Workers in the mining industry used to be among the most secure, with their sense of optimism supported by strong demand for labour during the heart of the resources boom.
But our index confirms times have changed for the sector.
Precarious work has increased in mining at a greater rate than in any other sector, driven mainly by workers’ sense of job insecurity as the sector shifts to a less labour intensive production phase, and the volatility of global resource prices.
We found employment in other sectors, in hospitality, arts and recreation, or agriculture for example, to be intrinsically more precarious by nature. These industries had irregular or uncertain hours, casual contracts, or relatively low pay.
The expanding role of technology and automation in production is another potential factor driving the growing sense of insecurity in employment, especially among lower-skilled men.
This highlights the need to ensure workers can access retraining and education opportunities that smooth their transition to new, higher skilled jobs, or into other forms of employment.
There is a shared responsibility on governments, employers, and education and training organisations to ensure that no-one is left behind.
Authors: Rebecca Cassells, Associate Professor, Bankwest Curtin Economics Centre, Curtin University; Alan Duncan, Director, Bankwest Curtin Economics Centre and Bankwest Research Chair in Economic Policy, Curtin University; Astghik Mavisakalyan, Senior Research Fellow, Curtin University; John Phillimore, Executive Director, John Curtin Institute of Public Policy, Curtin University; Yashar Tarverdi, Research fellow, Bankwest Curtin Economics Centre, Curtin University
Australia has record levels of supply of new properties but despite various government interventions, housing still remains unaffordable for many.
Our study found the government could use more direct methods to deliver homes for people on low and moderate incomes, while leveraging the market. These methods, widespread across the United Kingdom and in major cities of the United States, are known as “inclusionary planning”.
This includes requiring developers to make a financial contribution towards affordable housing, or to dedicate completed dwellings, as part of the development approval process.
We studied the outcomes of inclusionary planning programs in parts of the United States and the United Kingdom, and more recent approaches in South Australia and New South Wales.
What techniques can ensure affordable housing in the mix
“Inclusionary zoning”, a common type of inclusionary planning, was first developed in the United States to counteract land use rules which excluded the lower end of the property market. For example, where rules would only permit large homes on single allotments.
Some states in the US have also adopted “anti-snob” laws. Under these laws, developers whose schemes include affordable housing can bypass local zoning controls, if an area has insufficient affordable housing for those on low and moderate incomes.
More recently, inclusionary planning programs are being used in many US cities in a bid to ensure that transport and infrastructure investment does not price out or displace lower income renters.
There are now more than 500 inclusionary planning schemes operating in municipalities across the US. Some require developers to include affordable housing as part of development in a particular zone (usually a fixed percentage of units or floor space).
For example inclusionary planning programs in the city of San Francisco, California (population of around 830,000) generate around 150–250 affordable units per year (around 12% of the city’s total supply).
Other schemes allow variations to planning rules in return for affordable housing. These variations might permit additional density in certain areas or waive certain requirements that would normally apply or expedite the development assessment process.
Other schemes require financial contributions from developers to offset the impact of a project on affordable housing demand or supply.
These programs provide a way for governments to ensure affordable housing for lower income residents even in rapidly gentrifying neighbourhoods.
How this plays out in England and Scotland
In England and Scotland, the supply of affordable housing is negotiated through the planning process. The general expectation is that 20 to 40% of new housing developments will be affordable. But proportions of affordable housing are allowed to vary on a case by case basis in light of the housing market and the costs of undertaking the development.
The main methods for this in England are section 106 agreements. These agreements, which come under the Town and Country Planning Act 1990, specify the amount and type of affordable housing to be provided as part of a development.
Section 106 agreements have steadily gained traction since the 1990s. Between 2005–16, 83,790 affordable dwellings were secured through these agreements in England. This included 9,640 new dwellings in 2015–16.
Section 106 agreements have resulted in different types of affordable housing, including social housing, discounted home ownership, share equity schemes and affordable rental housing (offered at 20% less rent than for comparable properties in the same local housing market).
Our study found that when inclusionary planning model requirements are predictable and applied in a consistent way, developers accept them because they can factor costs into the price paid for land.
We also found most models work in conjunction with other government funding or subsidies, extending the value of this funding by reducing the cost of land for social or affordable housing.
What usually happens in Australia
Only the South Australia and New South Wales governments have similar types of planning schemes in Australia, although there are signs that other states may follow.
The SA government’s inclusionary planning target, announced in 2005, aims for 15% of significant new housing developments to be affordable.
By 2016 more than 2,000 affordable homes had been built and a further 3,476 homes committed. This amounts to about 17% of new housing supply in South Australia.
In NSW, inclusionary planning schemes only deliver affordable rental housing.
In the mid 1990s an inclusionary zoning scheme pilot was introduced to Pyrmont and Ultimo. This scheme was then extended to Green Square.
These schemes require that developers dedicate 0.8 to 3% of the floor area of developments for affordable housing, or that a monetary contribution be made in lieu of direct affordable housing provision.
However, to date, the NSW state government and many in the development sector have favoured voluntary mechanisms (such as density bonuses for providing affordable housing) over mandatory ones to supply affordable rental housing.
For our study, we estimated the volume of affordable housing delivered through voluntary planning agreements and state policy giving a density bonus for affordable housing inclusion by examining individual development approval records.
We found that voluntary measures have so far delivered about 1,300 dwellings or between 0.5 to 1% of Sydney’s housing supply between 2009 and 2017.
How viable is inclusionary planning?
We found that voluntary planning incentives can encourage affordable housing, but as part of incremental residential development, within the existing planning framework.
However, affordable housing should be mandated when land is rezoned for residential development, when planning rules are varied for particular projects, or following major infrastructure investment.
Inclusionary planning can’t replace government funding in providing housing for those on the lowest incomes. However, inclusionary planning schemes can reduce land costs and ensure that affordable homes are well located near jobs and services.
Authors: Nicole Gurran, Professor of Urban and Regional Planning, University of Sydney; Catherine Gilbert, Research Assistant and PhD Candidate, Urban Housing Lab, University of Sydney
Digital Finance Analytics (DFA) has released the March 2018 mortgage stress and default analysis update.
Across Australia, more than 956,000 households are estimated to be now in mortgage stress (last month 924,500). This equates to 30.0% of households. In addition, more than 21,000 of these are in severe stress, no change from last month. We estimate that more than 55,000 households risk 30-day default in the next 12 months. We expect bank portfolio losses to be around 2.8 basis points, though with losses in WA are higher at 4.9 basis points. Flat wages growth, rising living costs and higher real mortgage rates are all adding to the burden.
Martin North, Principal of Digital Finance Analytics said “we continue to see the number of households rising, and the quantum is now economically significant. Things will get more severe, especially as household debt continues to climb to new record levels. Mortgage lending is still growing at two to three times income. This is not sustainable and we are expecting lending growth to continue to moderate in the months ahead as underwriting standards are tightened and home prices fall further”. The latest household debt to income ratio is now at a record 188.6.[1]
Overall, risks in the system continue to rise, and while recent strengthening of lending standards will help protect new borrowers, there are many households currently holding loans which would not now be approved. The recent Royal Commission laid bare some of the industry practices which help to explain why stress is so high. This is a significant sleeping problem and the risks in the system remain higher than many recognise.
Our analysis uses the DFA core market model which combines information from our 52,000 household surveys, public data from the RBA, ABS and APRA; and private data from lenders and aggregators. The data is current to end March 2018. We analyse household cash flow based on real incomes, outgoings and mortgage repayments, rather than using an arbitrary 30% of income.
Households are defined as “stressed” when net income (or cash flow) does not cover ongoing costs. They may or may not have access to other available assets, and some have paid ahead, but households in mild stress have little leeway in their cash flows, whereas those in severe stress are unable to meet repayments from current income. In both cases, households manage this deficit by cutting back on spending, putting more on credit cards and seeking to refinance, restructure or sell their home. Those in severe stress are more likely to be seeking hardship assistance and are often forced to sell.
The forces which are lifting mortgage stress levels remain largely the same. In cash flow terms, we see households having to cope with rising living costs – notably child care, school fees and fuel – whilst real incomes continue to fall and underemployment remains high. Households have larger mortgages, thanks to the strong rise in home prices, especially in the main eastern state centres, and now prices are slipping. While mortgage interest rates remain quite low for owner occupied borrowers, those with interest only loans or investment loans have seen significant rises. We expect some upward pressure on real mortgage rates in coming months as international funding pressures mount, a potential for local rate rises and margin pressure on the banks thanks to a higher Bank Bill Swap Rate (BBSW).
Probability of default extends our mortgage stress analysis by overlaying economic indicators such as employment, future wage growth and cpi changes. Our Core Market Model also examines the potential of portfolio risk of loss in basis point and value terms. Losses are likely to be higher among more affluent households, contrary to the popular belief that affluent households are well protected.
Stress by The Numbers.
Regional analysis shows that NSW has 261,159 households in stress (260,830 last month), VIC 258,303 (249,192 last month), QLD 176,154 (165,344 last month) and WA has 126,606 (130,068 last month). The probability of default over the next 12 months rose, with around 10,474 in WA, around 10,299 in QLD, 13,827 in VIC and 14,807 in NSW.
The largest financial losses relating to bank write-offs reside in NSW ($1.3 billion) from Owner Occupied borrowers) and VIC ($960 million) from Owner Occupied Borrowers, which equates to 2.09 and 2.76 basis points respectively. Losses are likely to be highest in WA at 4.9 basis points, which equates to $726 million from Owner Occupied borrowers.
[1] RBA E2 Household Finances – Selected Ratios December 2017 (Revised 3rd April 2018).
You can request our media release. Note this will NOT automatically send you our research updates, for that register here.
[contact-form to=’mnorth@digitalfinanceanalytics.com’ subject=’Request The March 2018 Stress Release’][contact-field label=’Name’ type=’name’ required=’1’/][contact-field label=’Email’ type=’email’ required=’1’/][contact-field label=’Email Me The March 2018 Media Release’ type=’radio’ required=’1′ options=’Yes Please’/][contact-field label=”Comment If You Like” type=”textarea”/][/contact-form]
Note that the detailed results from our surveys and analysis are made available to our paying clients.
More people are becoming heavily indebted by buying rental properties and shared accommodation is flourishing, as third party tech platforms help people find a place without a real estate agent.
A new report from the Australian Housing and Urban Research Institute explains how the private rental market is changing over time for both landlords and tenants.
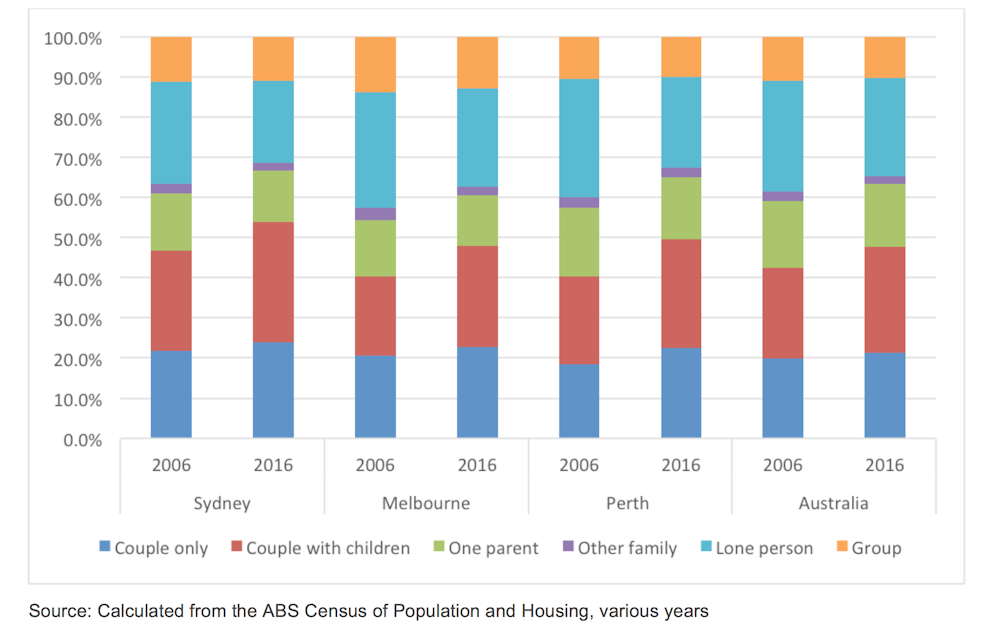
Over the 10 years to 2016, the number of renters grew 38% – twice the rate of household growth. More renters now are couples, or couples with children, so it seems the sector is shaking its image of unstable housing or perhaps these people are left with few other options.
Households by type, 2006 and 2016
Author provided (No reuse)
The report analyses data from the 2016 Census, the 2013-14 Survey of Income and Housing and the 2014 Household, Income and Labour Dynamics in Australia (HILDA) Survey. It also draws on interviews conducted with 42 people involved in all aspects of the private rental sector: financing, provision, access and management.
Rental property ownership also grew. We found the number of households with an interest in a rental property grew and the number that own multiple properties grew slightly as well.
But the typical landlord is still the conventional “mum and dad” investor. Two-thirds of rental investor households have two incomes, and 39% have children.
However they are also mostly high-income and high-wealth households: 60% are in both the highest income and highest wealth bracket. Interestingly, about one in eight landlords is themselves a private renter.
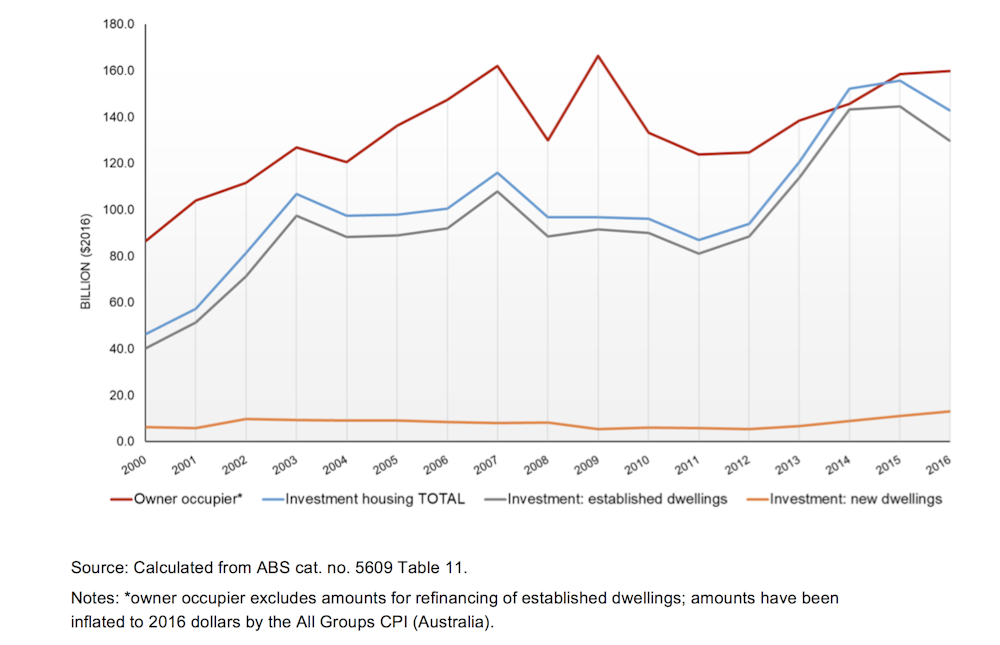
Housing finance ($A), 2000 – 2016
Author provided (No reuse)
The biggest change in ownership is in finances: owners of rental properties are relying more heavily on debt.
Financing rental properties
The people we interviewed highlighted the Australian Prudential Regulation Authorities’ (APRA) guidance to lenders on loan serviceability calculations as having the greatest impact on overall investment levels and investor decisions.
Adding to the complexity is the proliferation of intermediaries, such as mortgage brokers and wealth advisers. These advisers are telling borrowers what lenders and loan products to use to maximise their borrowing power and negotiate lender and regulator requirements.
Houses are the most commonly rented in Australia, but everywhere rental markets are moving away from this and towards dwellings like apartments.
There’s now more diversity in rental properties too. For example the building of high-rise student accommodation, “new generation boarding houses” and granny flats.
These allow landlords to house more people in the one building, increasing revenue and making management more efficient.
The informal sector of shared accommodation appears to be flourishing, like improvising shared rooms and lodging-style accommodation in apartments and houses.
Finding a rental
People have moved from finding rentals in real estate agents’ high street offices and onto online platforms. New third-parties like apps and other digital platforms offer non-cash alternative bond products, schedule property inspections, collect rents, and organise repairs.
Even though these technological innovations avoid agents, they have in fact increased their share of private rental sector management. Agents themselves are use these platforms to change their businesses, and the structure of their industry.
Our research found that revenue from an agency’s property management business (its “rent roll”) has become increasingly important. Some players in the industry are consolidating their businesses around it, to make higher profits from tech-enabled efficiencies.
However, the real estate business still depends on building personal relationships, particularly in high-end markets.
The new tech platforms of the private rental sector raise issues for tenants too, particularly in terms of the personal information they collect. For example, one of the online platform operators told us they looked forward to using applicants’ information to score or rank applicants. Another one of the new alternative bond providers uses automatic “trust scoring” of personal information to price its product.
These innovations may be convenient to use, and may give some tenants an advantage in accessing housing – but at the expense of others who are already disadvantaged.
Rental properties meeting demand?
If the private rental sector is going to meet the demand for settled housing, governments will have to intervene. This can’t be left to technological innovation, or higher income renters exercising their consumer power.
Federal or state governments could create public registers of landlords, or licensing requirements, to police landlords who are not “fit and proper” and exclude them from the sector.
There could also be stronger laws around tenancy conditions and protections for tenants against retaliatory action. The Poverty Inquiry in the 1970s set the basic model of our present laws and they haven’t changed much.
Tenants’ personal information also needs to be protected, to properly take account of the rise of the online application platforms; another is the informal sector, which is currently in a regulatory blindspot.
The popular emphasis on “mum and dad” investors diminishes expectations of landlords. Rental property investment should be regarded as a business that requires skill and effort. As for-profit providers of housing services, landlords should be held to standards that ensure the right to a dignified home life.
Author: Chris Martin, Research Fellow, City Housing, UNSW


.PNG)