Personal Insolvencies Sharply Higher

The latest data from The Australian Financial Security Authority, for the December 2017 quarter shows a significant rise in personal insolvency – a bellwether for the financial stress within the Australian community.

The total number of personal insolvencies in the December quarter 2017 (7,578) increased by 7.4% compared to the December quarter 2016 (7,055). This year-on-year rise follows a rise of 8.0% in the September quarter 2017.

Total personal insolvencies increased in all states and territories in the December quarter 2017, in year-on-year terms.

Quarterly total personal insolvencies remain below the historical peaks reached in 2008–09 and 2009–10 (more than 9,000 personal insolvencies).

The number of bankruptcies increased by 1.3% in year-on-year terms, from 3,976 in the December quarter 2016 to 4,029 in the December quarter 2017. This follows a 0.1% year-on-year rise in the September quarter 2017. Bankruptcies constituted 53.2% of total personal insolvencies, falling from 56.4% in the December quarter 2016.

The number of bankruptcies rose in year-on-year terms in the December quarter 2017 in all states and territories except Victoria, Queensland and South Australia.

In December quarter 2017, the number of debt agreements fell to 3,500 from the record high of 3,885 in the September quarter 2017.

In year-on-year terms, debt agreements rose by 15.3% from the December quarter 2016. This is the tenth consecutive quarter in which debt agreements have increased in year-on-year terms.

Debt agreements constituted 46.2% of total personal insolvencies, rising from 43.0% in the December quarter 2016.

Debt agreements increased in year-on-year terms in all states and territories in the December quarter 2017. Debt agreements in New South Wales reached a record quarterly high of 1,084 debt agreements in the December quarter 2017. There were 51 debt agreements in the Northern Territory (NT) in the December quarter 2017. Debt agreements in the NT also reached this record in the September quarter 2016.

Quarterly personal insolvency agreement levels fluctuate proportionally more than those of bankruptcies and debt agreements as levels are relatively small.

The number of personal insolvency agreements increased by 14.0% in the December quarter 2017 (49) compared to the December quarter 2016 (43).

This is the sixth consecutive quarter in which personal insolvency agreements have increased in year-on-year terms.


Housing Affordability and Employment – The Property Imperative Weekly 27 Jan 2018

Housing in Australia is severely unaffordable, and despite the growth in jobs, unemployment in some centres is rising. We look at the evidence. Welcome the Property Imperative Weekly to 27th January 2018.

Thanks to checking out this week’s edition of our property and finance digest.   Watch the video or read the transcript.

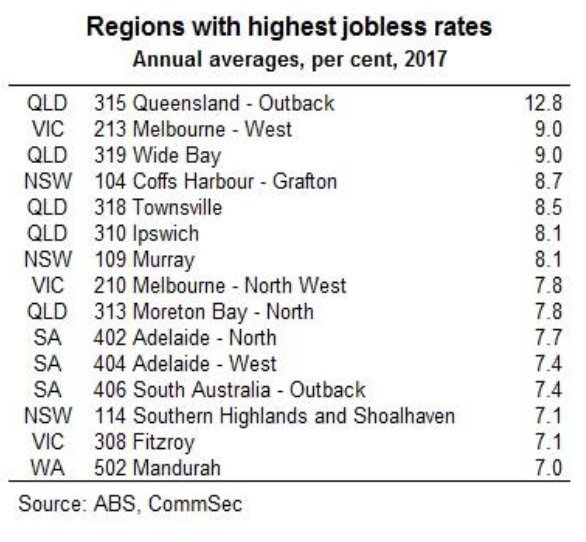
Today we start with employment data. CommSec looked at employment across regions over the last year. Despite the boom in jobs, the regional variations are quite stark, with some areas showing higher rates of unemployment, and difficult economic conditions. Unemployment has increased in several Queensland regional centres in recent years. Queensland’s coastal regional centres such as Bundaberg, Gympie, Bundaberg and Hervey Bay, known more broadly as Wide Bay (average 9.0 per cent), together with Townsville (albeit lower at 8.5 per cent) have elevated jobless rates. Unemployment also increased along the suburban fringes and city ‘spines’ such as Ipswich (8.1 per cent) in Brisbane and the western suburbs of Melbourne (9.0 per cent). In Western Australia, Mandurah, south of Perth, experienced a significant decline in the jobless rate to an average of 7.0 per cent in December from 11.2 per cent a year ago. Higher income metropolitan areas, especially in Sydney’s coastal suburbs, dominate the regions with the lowest unemployment rates. However, the corridor between Broken Hill and Dubbo has Australia’s lowest regional unemployment rate at 2.9 per cent, benefitting from agricultural, tourism and mining-related jobs growth. You will find there is a strong correlation with mortgage stress, as we will discuss next week.

The Victorian Government has reaffirmed their intent to shortly accept applications for its shared equity scheme known as HomesVic from up to 400 applicants. We do not think such schemes help affordability, they simply lift prices higher, but looks good politically.  This was first announced in March 2017. The $50-million pilot initiative aims to make it easier for first-home buyers to enter the market by reducing the size of their loan, hence reducing the amount they need to save for a deposit. The initiative targets single first-home buyers earning an annual income of less than $75,000 and couples earning less than $95,000. Eligible applicants must buy in so-called “priority areas” which include 85 Melbourne suburbs, seven fringe towns and 130 regional towns and suburbs. In Melbourne, the list includes suburbs around Box Hill, Broadmeadows, Dandenong, Epping, Fishermen’s Bend, Footscray, Fountain Gate, Frankston, LaTrobe, Monash, Pakenham, Parkville, Ringwood, Sunshine and Werribee. Regional centres on the list include Ballarat, Bendigo, Castlemaine, Geelong, La Trobe, Mildura, Seymour, Shepparton, Wangaratta, Warrnambool and Wodonga. The state government said the locations were chosen in growth areas where there was a high demand for housing and access to employment and public transport. Some of these locations are where mortgage stress, on our modelling is highest – we will release the January results next week. The scheme is not available in most of Melbourne’s bayside suburbs, the leafy inner eastern suburbs or some pockets of the inner north.

Overseas, the US Mortgage Rates continue to rise, heading back to the worst levels in more than 9 months.  Rates have risen an eighth of a percentage point since last week, a quarter of a point from 2 weeks ago, and 3/8ths of a point since mid-December.  That makes this the worst run since the abrupt spike following 2016’s presidential election. While this doesn’t necessarily mean that rates will continue a linear trend higher in the coming months, the trajectory is up, reflecting movements in the capital markets, and putting more pressure on funding costs globally.

The Bank for International Settlements (BIS) has published an important reportStructural changes in banking after the crisis“. The report highlights a “new normal” world of lower bank profitability, and warns that banks may be tempted to take more risks, and leverage harder in an attempt to bolster profitability. This however, should be resisted. They also underscore the issues of banking concentration and the asset growth, two issues which are highly relevant to Australia. The report says that in some countries the 2007 banking crisis brought about the end of a period of fast and excessive growth in domestic banking sectors.  Worth noting the substantial growth in Australia, relative to some other markets and of particular note has been the dramatic expansion of the Chinese banking system, which grew from about 230% to 310% of GDP over 2010–16 to become the largest in the world, accounting for 27% of aggregate bank assets.

Back home, an ASIC review of financial advice provided by the five biggest vertically integrated financial institutions (the big four banks and AMP) has identified areas where improvements are needed to the management of conflicts of interest. 68% of clients’ funds were invested in in-house products. ASIC also examined a sample of files to test whether advice to switch to in-house products satisfied the ‘best interests’ requirements. ASIC found that in 75% of the advice files reviewed the advisers did not demonstrate compliance with the duty to act in the best interests of their clients. Further, 10% of the advice reviewed was likely to leave the customer in a significantly worse financial position. This highlights the problems in vertically integrated firms, something which the Productivity Commission is also looking at. The real problem is commission related remuneration, and cultural norms which put interest of customers well down the list of priorities.

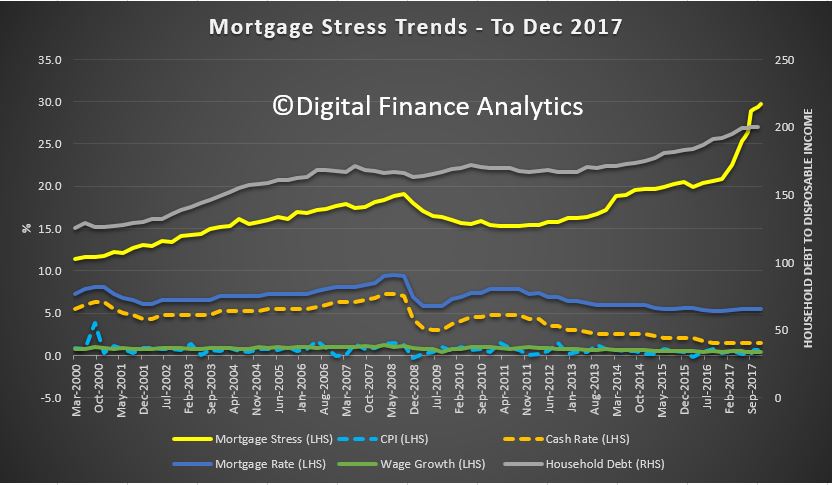
The Financial Services Royal Commission has called for submissions, demonstrating poor behaviour and misconduct. It will hold an initial public hearing in Melbourne on Monday 12 February 2018. The not-for-profit consumer organisation, the Consumer Action Law Centre (CALC) said the number of Aussie households facing mortgage stress has “soared” nearly 20 per cent in the last six months, and argued that lenders are to blame. Referencing Digital Finance Analytics’ prediction that homes facing mortgage stress will top 1 million by 2019, CALC said older Australians are at particular risk. The organisation explained: “Irresponsible mortgage lending can have severe consequences, including the loss of the security of a home. “Consumer Action’s experience is that older people are at significant risk, particularly where they agree to mortgage or refinance their home for the benefit of third parties. This can be family members or someone who holds their trust.” Continuing, CALC said a “common situation” features adult children persuading an older relative to enter into a loan contract as the borrower, assuring them that they will execute all the repayments. “[However] the lack of appropriate inquiries into the suitability of a loan only comes to light when the adult child defaults on loan repayments and the bank commences proceedings for possession of the loan in order to discharge the debt,” CALC said. We think poor lending practice should be on the Commissions Agenda, and we will be making our own submission shortly.

The latest 14th edition of the Annual Demographia International Housing Affordability Survey: 2018, continues to demonstrate the fact that we have major issues here in Australia. There are no affordable or moderately affordable markets in Australia. NONE! Sydney is second worst globally in terms of affordability after Hong Kong, with Melbourne, Sunshine Coast, Gold Coast, Geelong, Adelaide, Brisbane, Hobart, Perth, Cains and Canberra all near the top of the list. You can watch our separate video where we discuss the findings and listen to our discussion with Ben Fordham on 2GB.  When this report comes out each year, we get the normal responses from industry, such as Australia is different or the calculations are flawed. I would simply say, the trends over time show the relative collapse in affordability, and actually the metrics are well researched.

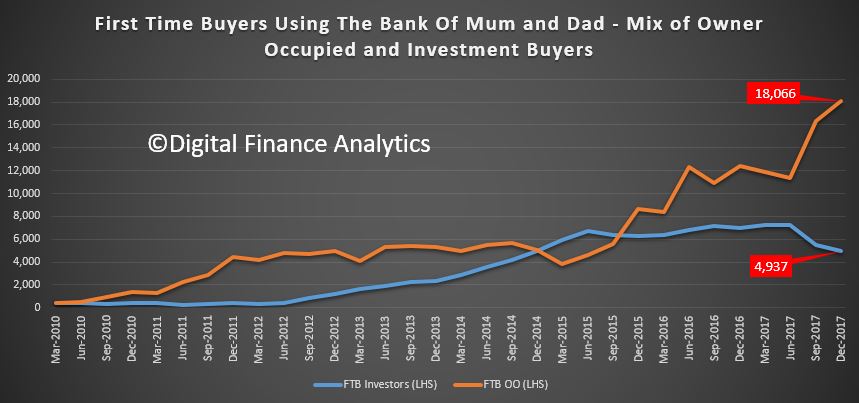
Fitch Ratings published its Global Home Prices report. They say price growth is expected to slow in most markets and risks are growing as the prospect of gradually rising mortgage rates comes into view this year. Their data on Australia makes interesting reading. Fitch expects Sydney and Melbourne HPI to stabilise in 2018, due to low interest rates, falling rental yields, increasing supply, limited investment alternatives and growing dwelling completions, partially offset by high population growth. Fitch expects the increase in FTB to be temporary; low income growth, tighter underwriting and rising living costs will maintain pressure on affordability for FTB. As mortgage rates are currently low, any material rate rise will weigh further on mortgage affordability and serviceability. The rising cost of living and sluggish wage growth are likely to increase pressure on recent borrowers who have little disposable income. Fitch expects mortgage lending growth to slow to around 4% in 2018, based on continued record low interest rates and stable unemployment. This will once again be offset by continued underemployment, reduced investor demand and tougher lending practices.

Finally, the latest weekly data from CoreLogic underscores the weakness in the property market. First prices are drifting lower, with Sydney down 0.4% in the past week and Melbourne down 0.1%.  The indicator of mortgage activity is also down, suggesting demand is easing as lending rules tighten. But then we always have a decline over the summer break. The question is, are we seeing a temporary blip, over the holiday season, or something more structural? We think the latter is more likely, but time will tell.

So that’s the Property Imperative Weekly to 27th January 2018. If you found this useful, do like the post, add a comment and subscribe to receive future editions. Many thanks for taking the time to watch.


A More Regional Look At Jobs

CommSec looked at employment across regions over the last year.

Despite the boom in jobs, the regional variations are quite stark, with some areas showing higher rates of unemployment, and difficult economic conditions

There is also a correlation between employment and mortgage stress, more on this when we release our latest monthly stress update next week.

CommSec says:

Generally people in metropolitan areas earn higher incomes than their cousins in the country, but employment outcomes vary considerably.

Unemployment has increased in several Queensland regional centres in recent years. Outback Queensland, which includes western and far north areas of the state, has the worst unemployment rate in the country. That said, Cairns’ average unemployment rate has improved to 5.9 per cent in 2017 from 7.8 per cent a year ago.

Queensland’s coastal regional centres such as Bundaberg, Maryborough, Gympie, Bundaberg and Hervey Bay, known more broadly as Wide Bay (average 9.0 per cent), together with Townsville (albeit lower at 8.5 per cent) have elevated jobless rates. Manufacturing jobs in Wide Bay have declined by 1,306 between 2010 and 2016 according to Regional Development Australia.

The average unemployment rate in Coffs Harbour-Grafton on the NSW Mid-North Coast deteriorated to 8.7 per cent over 2017. Pleasingly, the actual unemployment rate fell to 6.1 per cent by year-end. Construction jobs have increased, underpinned by the $3.3 billion Pacific Highway upgrade between Port Macquarie and Coffs Harbour. A further 2,970 workers are expected to be employed on the $4.36 billion Woolgoolga to Ballina road upgrade.

Unemployment also increased along the suburban fringes and city ‘spines’ such as Ipswich (8.1 per cent) in Brisbane and the western suburbs of Melbourne (9.0 per cent). Around 950 jobs were lost at Holden’s Elizabeth factory in Adelaide’s north in October, pushing up the area’s unemployment rate to 7.7 per cent.

Higher income metropolitan areas, especially in Sydney’s coastal suburbs, dominate the regions with the lowest unemployment rates. However, the corridor between Broken Hill and Dubbo has Australia’s lowest regional unemployment rate at 2.9 per cent, benefitting from agricultural, tourism and mining-related jobs growth.

Melbourne satellite city Ballarat has experienced faster and younger population growth than its regional Victorian peers, supporting jobs growth. The unemployment rate in Ballarat has fallen to 4.1 per cent from 5.3 per cent over the year to December.

In Western Australia, Mandurah, south of Perth, experienced a significant decline in the jobless rate to an average of 7.0 per cent in December from 11.2 per cent a year ago. Mandurah has benefited from job-creating projects such as the Dwellingup National Trails Centre and Quambie Park aged care expansion.


What Australia can learn from overseas about the future of rental housing

From The Conversation.

When we talk about rental housing in Australia, we often make comparisons with renting overseas. Faced with insecure tenancies and unaffordable home ownership, we sometimes try to envisage European-style tenancies being imported here.

And, over the past year, there has been a surge of enthusiasm for developing a sector of large-scale institutional landlords, modelled on the UK’s build-to-rent sector or “multi-family” housing in the US.

Our review of the private rental sectors of ten countries in Australasia, Europe and North America identified innovations in rental housing policies and markets Australia might try to emulate – and avoid. International comparisons also give a different perspective on aspects of Australia’s own rental housing institutions that might otherwise be taken for granted.

Not everyone in Europe rents

In nine of the ten countries we reviewed, private rental is the second-largest tenure after owner-occupation. Only in Germany do more households rent privately than own their housing. Most of the European countries we reviewed have higher rates of home ownership than Australia.

In most of the European and North American countries in our study, single people and lower-income households and apartments are heavily represented in the private rental sector. Higher-income households, families with kids, and detached houses are represented much more in owner-occupation. It’s less uneven in Australia: more houses, kids and higher-income households are in private rental.

Two key potential implications follow from this.

First, it suggests a high degree of integration between the Australian private rental and owner-occupier sectors, and that policy settings and market conditions applying to one will be transmitted readily to the other.

So, policies that give preferential treatment to owner-occupied housing will also induce purchase of housing for rental, and rental housing investor activity will directly affect prices and accessibility in the owner-occupied sector.

It also heightens the prospect of investment in both sectors falling simultaneously, with little established institutional capacity for countercyclical investment that makes necessary increases in ongoing supply.

A second implication relates to equality. Australian households of similar composition and similar incomes differ in their housing tenure – and, considering the traditional value placed on owner-occupation, this may not be by choice.

This suggests housing tenure may figure strongly in the subjective experience of inequality. It raises the question of whether housing is a primary driver of inequality, and not the outcome of difference or inequality in other aspects of life.

The rise of large corporate landlords

In almost all of the countries we reviewed, the ownership of private rental housing is dominated by individuals with relatively small holdings. Only in Sweden are housing companies the dominant type of landlord.

However, most countries also have a sector of large corporate landlords. In some countries, these landlords are very large. For example, America’s five largest corporate landlords own about 420,000 properties in total. Germany’s largest landlord, Vonovia, has more than 330,000 properties alone.

These landlords’ origins vary. Germany’s arose from massive sell-offs of municipal housing and industry-related housing in the early 2000s.

In the US, multi-family (apartment) landlords have been around for decades. And in the aftermath of the global financial crisis, they have been joined by a new sector of single-family (detached house) landlords that have rapidly acquired large portfolios from bulk purchases of foreclosed, formerly owner-occupied homes.

In these countries and elsewhere, the rise of largest corporate landlords has been controversial. Germany’s have a poor record of relations with tenants – to the extent of being the subject of popular protests in the 2000s – and their practice of characterising repairs as improvements to justify rent increases.

American housing advocates have voiced concern about “the rise of the corporate landlord” – especially in the single-family sector, where there’s some evidence that they more readily terminate tenancies.

These landlords also don’t build much housing. They are most active in renovating (for higher rents), merging with one another, and – especially in the US – developing innovative financial instruments such as “rental-backed securities”.

“Institutional landlords” are now a standing item on the Australian housing policy agenda. Considering the activities of large corporate landlords internationally, we should get specific about the sort of institutional landlords we really want, how we will get them, and how we will ensure they deliver desired housing outcomes.

Policymakers and housing advocates have, for years, looked to the community housing sector as the prime candidate for this role. They envisage its transformation into an affordable housing industry that works across the sector toward a wide range of policy outcomes in housing supply, affordability, security, social housing renewal and community development.

With interest in the prospect of build-to-rent and multifamily housing rising in the property development and finance sectors, there is a risk that affordable housing policy may be colonised by for-profit interests.

The development of a for-profit large corporate landlord sector may be desirable for greater professionalisation and efficiencies in the management of tenancies and properties. However, this should not come at the expense of a mission-oriented affordable housing industry that makes a distinctive contribution to housing outcomes.

Bringing it home

Looking at the policy settings in the ten countries, we found some surprising results and strange bedfellows.

For example, Germany – which has had a remarkably long period of stable house prices – has negative gearing provisions and tax exemptions for capital gains, much like Australia. But, in Australia, these policies are blamed for driving speculation and booming prices.

And while the UK taxes landlords more heavily than most other countries, it has the fastest-growing private rental sector of the countries we reviewed.

However, these challenging findings should not be taken to diminish the explanatory power or effectiveness of these settings in each country’s housing policy. Rather, they show the necessity of considering taxation and other policy settings in interaction with each other and in wider systemic contexts.

So, for example, Germany’s conservative housing finance practices, and regulation of rents, may mean the speculative potential of negative gearing and tax-free capital gains isn’t activated there.

Strategy in Australia for its private rental sector should join consideration of finance, taxation, supply and demand-side subsidies and regulation with the objective of making private rental housing outcomes competitive with other sectors.

Author: Chris Martin, Research Fellow, City Housing, UNSW

Bank of Mum and Dad Now A “Top 10” Lender

The latest Digital Finance Analytics analysis shows that the number and value of loans made to First Time Buyers by the “Bank of Mum and Dad” has increased, to a total estimated at more than $20 billion, which places it among the top 10 mortgage lenders in Australia.

We use data from our household surveys to examine how First Time Buyers are becoming ever more reliant on getting cash from parents to make up the deposit for a mortgage to facilitate a property purchase.

Savings for a deposit is very difficult, at a time when many lenders are requiring a larger deposit as loan to value rules are tightened. The rise of the important of the Bank of Mum and Dad is a response to rising home prices, against flat incomes, and the equity growth which those already in the market have enjoyed.  This enables an inter-generational cash switch, which those fortunate First Time Buyers with wealthy parents can enjoy. In turn, this enables them also to gain from the more generous First Home Owner Grants which are also available. Those who do not have wealthy parents are at a significant disadvantage.

Whilst help comes in a number of ways, from a loan to a gift, or ongoing help with mortgage repayments or other expenses, where a cash injection is involved, the average is around $88,000. It does vary across the states.

We see a spike in owner occupied First Time Buyers accessing the Bank of Mum and Dad, while the number of investor First Time Buyers has fallen away.

But overall, around 55% of First Time Buyers are getting assistance from parents, with around 23,000 in the last quarter.

There are risks attached to this strategy, for both parents and buyers, but for many it is the only way to get access to the expensive and over-valued property market at the moment. Of course if prices fall from current levels, both parents and their children will be adversely impacted in an inter-generational financial embrace.

Treasury memo misses the real impact of Labor’s negative gearing policy

From The Conversation.

Labor MPs might be rubbing their hands together with glee at a Treasury memo that shows the federal opposition’s negative gearing policy will have a “small” impact on the property market. But insights from behavioural public policy, as highlighted by the 2017 Economics Nobel laureate – Richard Thaler and his colleague Cass Sunstein, tell us that how people respond to this policy will be more about how the government frames it.

The Treasury memo showed the Labor policy of limiting negative gearing to existing homeowners will have a limited impact as the changes are unlikely to encourage investors to sell quickly. Also, owner-occupiers dominate the housing market and the costs of selling are high.

However, this assumes that people are forward-looking, well-informed, good with numbers and perfectly responsive to new information. Behavioural economics shows us that people do not always think so deeply and logically about their choices.

How any changes to negative gearing are sold to us – as a loss or gain, as a one-off or ongoing, in terms of short versus long term costs and benefits – will impact how Australians react.

Most of us aren’t whizzes with mathematics. As Nobel prize winner Herbert Simon has shown, in place of complex mathematical algorithms we use heuristics. These are simple rules of thumb that draw on our intuitions, experience and gut feel.

Heuristics and biases

One common example of a heuristic is the availability heuristic. This is when we make decisions based on easily available information such as recent events and highly emotive experiences. Our brains work better with narratives and stories than with facts and figures.

Nobel economics laureates George Akerlof and Robert Shiller have applied a similar insight to analyse people’s perceptions of housing market fluctuations. They noted that we hear lots of stories about how house prices are on an upward trend. Via the availability heuristic, we easily remember these emotionally engaging stories, much better than we can remember the dry facts about the history of house price instability and housing market crashes.

This leads us to overestimate the chances of continuing house price rises, and to underestimate the chances of a fall, driving unsustainable house price increases – as witnessed, for example, in the American sub-prime property markets before the global financial crisis.

While heuristics can help us to decide quickly, they sometimes lead us into systematic mistakes – “behavioural biases”. This does not mean that we’re all hopelessly irrational. But for negative gearing it matters how a potential change is framed, and how that fits into our heuristics and biases.

Most economists (including those at Treasury) assume that one dollar is a perfect substitute for any other dollar. Whether we save A$100 via a tax break, win A$100 from a scratch card or earn A$100 from working overtime, it makes no difference.

Contrary to this view, behavioural economics has shown that the way we treat money is different depending on the contexts in which we earn and spend it. We have different “mental accounts” for consumption, wealth, regular income and windfalls. We are more likely to splurge money we’ve won from a scratch card than money we’ve earnt doing overtime.

This is another reason why framing is important. How the government frames a negative gearing change will determine the mental account to which we assign it, and therefore how we respond.

If negative gearing changes are considered a one-off hit – the opposite of a scratch card windfall – then property owners won’t worry so much. On the other hand, if the change to negative gearing is seen as an ongoing drain on our incomes, then they will worry a lot.

Another factor that will come into play is loss aversion – people are much more likely to worry about losses than gains. Evidence from behavioural experiments shows that home-owners over-estimate the value of their properties. This makes them reluctant to sell at reduced prices in a falling market.

It also means that Australians will resist negative gearing changes if these are framed as a loss, creating political pressures for a policy u-turn. It is difficult to predict how people might respond, but behavioural economics shows that any ructions might be avoided if the negative gearing change is framed as a gain.

For instance, Treasury predicts that the additional revenue raised from restricting negative gearing could be up to A$3.9 billion. Therefore, the negative gearing changes could cover more than 80% of federal government expenditure on veterans and their families.

In the long and short term

Treasury’s modelling notes there might be downward pressure on house prices in the short term from changing negative gearing, but that this will be small overall.

But a range of models and experiments have shown that people are disproportionately focused on tangible, short-term outcomes. For example, most of us find it hard to persuade ourselves to go the gym: the short-term costs are inconvenience and discomfort and the benefits seem intangible and distant. This is called “present bias”.

Recent work in behavioural economics confirms that framing (alongside a range of other socio-psychological influences) has a strong impact on our choices. Framing will determine how we perceive the policy, which mental account we will use to process it and how the various heuristics and biases identified by economics and psychologists will play out.

In the debates around negative gearing policy changes, these behavioural insights have not been highlighted. So perhaps Treasury could have added some psychology, alongside the economics, in arguing that house price falls are likely to be limited.

Author: Research Professor at the Institute for Choice, University of South Australia

More Evidence of Poor Mortgage Lending Practice

The Australian Financial Review is reporting that New ‘liar loans’ data reveal borrowers more stretched than some lenders suspect.

One in five property borrowers are exaggerating their income and nearly half understating their spending, triggering new concerns about underwriting standards and vulnerability to sharp economic corrections, according to new analysis of loan applications by online property lender Tic:Toc Home Loans.

The number of ‘liar loans’ exceeds original estimates by investment bank UBS that last year found about 30 per cent of home loans, or $500 billion worth of loans could be affected.

Tic:Toc Home Loans’ founder and chief executive, Anthony Baum, said loan applications are representative of larger lenders in terms of location, borrower and loan size, which range from about $60,000 to $1.3 million.

Mr Baum, a senior banker for nearly 30 years, said in many cases applicants did not have to over-state their income for the required loan.

“Our portfolio looks like other organisations,” he said.

Analysis of their applications reveals about 20 per cent overstate their income, typically by about 30 per cent, and 50 per cent state their expenses are lower than the Household Expenditure Measure, also by about 30 per cent.

Property market experts claim the latest analysis, although based on a smaller sample than UBS’s survey, are credible and consistent with independent analysis of the lending standards.

“They do not surprise me,” said Richard Holden, professor economics at University of NSW Business School, who argues the potential problems are compounded by more than one-in-three loans being interest only.

Martin North, principal of Digital Finance Analytics, an independent consultancy, also backed the latest ‘liar loan’ numbers.

Mr North said standards had slipped because of lenders’ readiness to “jump over backwards” to increase business and commission incentives for mortgage brokers rewarding bigger loans.

“Not all lenders are the same but these numbers do not surprise me at all,” he said.

Mr North said there was strong evidence that salaries are overstated by between 15 and 20 per cent by borrowers using a range of tactics, such as over-stating bonuses or, for variable income earners, using peak rather than average income.

Household Financial Confidence Trudges South In December

The latest edition of the Digital Finance Analytics Household Financial Security Confidence Index, to December 2017 shows another fall, down from 96.1 last month to 95.7 this time, and remains below the neutral measure of 100.

The trend continues to drift south as flat incomes, big debt and now falling home prices all impact.

Analysis of households by their property owning status reveals that property investors are in particular turning sour, as flat net rental incomes, and rising interest rates hit many, at a time when property capital growth is stalling. Owner occupied households are faring a little better, thanks to a range of ultra cheap mortgage rates on offer at the moment, but they are also concerned about price momentum. Those without property interests remain the least confident, as the costs of renting outstrip income growth, and more are slipping into rental stress.

Looking across the states, they all slipped a little, with NSW now well behind VIC (we think the Victorian market is about 6 months behind Sydney, so will drift lower ahead). WA has not improved this time, suggesting that those talking up the market in the west may be over optimistic.

Across the age groups, young households are most concerned about their financial position, but every age group shows a small fall this month – perhaps thanks to the Christmas binge (though we think credit card debt will not rise that much this year) and retail stats may be lower than expected.

Looking in detail at the scorecard, which shows the elements which drive the index; job security is pretty stable, but savings are being raided by many to support their finances, while rates on bank deposits continue to drift lower.  Households are becoming increasingly uncomfortable with the level of debt they hold (they should at a ratio of 2:1, debt to income). Income continues to fall in real terms and costs of living are rising (child care costs and rising fuel costs are concerning many).  We also see a slide in net worth, as home prices, especially in the Sydney region decline. This despite high stock market prices at the moment.

We cannot see any circuit breakers in the mix ahead, so we expect the falling trend to continue into autumn.

By way of background, these results are derived from our household surveys, averaged across Australia. We have 52,000 households in our sample at any one time. We include detailed questions covering various aspects of a household’s financial footprint. The index measures how households are feeling about their financial health. To calculate the index we ask questions which cover a number of different dimensions. We start by asking households how confident they are feeling about their job security, whether their real income has risen or fallen in the past year, their view on their costs of living over the same period, whether they have increased their loans and other outstanding debts including credit cards and whether they are saving more than last year. Finally we ask about their overall change in net worth over the past 12 months – by net worth we mean net assets less outstanding debts.

We will update the results again next month.

Property, debt stress prompts clients to take tax risks

SMSF and accounting professionals alike are increasingly finding that clients are willing to take risky moves with their property portfolios, in an effort to reduce their mortgage stress. From SMSF Adviser.

These patterns are surfacing as instances of mortgage stress continue to climb significantly in Australian households. Research house Digital Finance Analytics (DFA) has released its mortgage stress and default analysis for December 2017, showing about 29.7 per cent of households — 921,000 — are under “mortgage stress.”

About 24,000 households are under “severe mortgage stress”, up by 3,000 from November 2017.

DFA principal Martin North believes the risk of default for Australians has increased for 2018, with an estimated 54,000 households currently at risk of 30-day debt defaults in the next 12 months.

Several accountants and financial advisers have told Accountants Daily that their clients, including high-net-worth property investors, are increasingly looking to take on more risk to sustain their levels of debt.

Director at Verante Financial Planning, and chair of the SMSF Association’s NSW state chapter, Liam Shorte, said he’s seen evidence of investors asking accountants to increase their reportable income to increase their borrowing capacity, usually where they need to refinance. Historically, clients have sought advice on how to minimise their reportable income for tax purposes.

He also told sister publication Accountants Daily that more clients are asking their parents to do a “family pledge,” or guarantee about 20 per cent of a loan to help reduce debt while refinancing.

For Lielette Calleja, director at bookkeeping firm All That Counts, mortgage stress is most pronounced with small business owners, and doesn’t necessarily only affect those at the lower end of the earning scale.

“I would have to say that small business owners are heavily affected. Your income is not always consistent, as opposed to being a PAYG. Mortgage stress is across the board I don’t believe it discriminates as it’s relative to each type of borrower. Property investors and high-net-worth individuals tend to be asset rich but lack cash flow until their development is complete and/or sold/leased out,” Ms Calleja told Accountants Daily.

Further, Ms Calleja is finding clients are modifying their behaviours and expenses to adjust to a new normal in household debt levels.

“Families that are not in a position to refinance are resorting to taking their kids out of private schools and foregoing luxury holidays, even simple things like making your own lunch instead of buying is becoming the Aussie way,” she said.

“Small business owners are coming to the conclusion that having good financials consistently all year round is critical in keeping their mortgage stress levels at bay,” she added.

Top 10 Mortgage Stress Countdown At December 2017

Following our monthly mortgage stress post, released yesterday, we have updated our video which counts down the most stressed households across the country.

As normal, there are some changes from last month, as conditions vary across the states. But overall, we see relatively more stress in Victoria and New South Wales.  We will count down to the post code with the highest levels of mortgage stress.

We also discuss the causes of mortgage stress and what households might do to mitigate the issues.