Unpaid super tally hits $3.6 billion

From Smart Company.

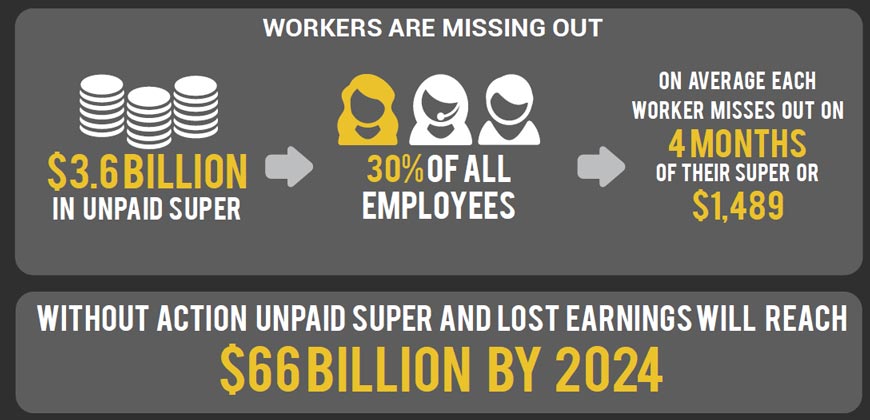
Businesses should review their obligations for compulsory superannuation contributions or potentially suffer the consequences, say experts, as a spotlight is shone on the $3.6 billion of unpaid super across the nation.

super-underpaid-dec-16

On its last sitting day on Thursday, the Senate referred the non-payment of superannuation guarantee contributions by Australian employers to the economics references committee for review in 2017. Superannuation groups have been busy modelling the scale of these non-payments, with a report from Industry Super Australia (ISA) and industry super fund Cbus released over the weekend pinning the value of unpaid super at $3.6 billion in 2013-14.

The report was completed by former Treasury official Phil Gallagher, who believes the $3.6 billion figure is “conservative”. The report highlights underpayment in the building and hospitality industries in particular, claiming the Australian Tax Office has to date been too laid back in pursuing businesses that fail to comply with the 9.5% employee super payments required by Australian law.

Over the past two years a number of studies have revealed that Australian SMEs are not focused enough on retirement planning, are sometimes tempted to put off contributing to their own superannuation and can be confused about their obligations to other staff members, particularly when employees volunteer to forgo their super. But experts warn that businesses must be vigilant in key areas of confusion, because the consequences can cost you.

Key concerns: Contractors and loopholes

The ISA report draws attention to the tendency of some businesses to incorrectly classify employees as contractors so as to avoid paying superannuation and other conditions – and that this problem increases or decreases depending on wider employment conditions.

However, David McKellar of Allied Accountants told SmartCompany that while businesses might not have to pay super contributions for a sole contractor for certain types of work, too often businesses continue to classify a worker as a contractor even after their role has come to fit the characteristics of an employee.

“In these cases, both the employer and contractor might not know there’s a liability there,” McKellar says.

The Fair Work Ombudsman directed SmartCompany towards its checklist for classifying employees and independent contractors, highlighting that contractors need to use their own equipment to complete work, work to a specific project outcome rather than on an ongoing basis, and have a high level of control over how the project is completed.

“The main thing is if the majority of the work is provided in the labor, not materials, provided by a person, then in all likelihood and most probability they will need to pay super,” senior lecturer at Deakin Business School Dr. Adrian Raftery says.

If a business owner is unsure about their responsibilities, the ATO also has a tool to calculate payments, but Raftery says some employers may be advised to pay the super guarantee to avoid facing fees for non-compliance later.

“If anything, err on the side of being conservative.”

One “loophole” the ISA report highlights as a key issue is around employees volunteering to salary sacrifice some of their wage into super. Under the current regulations, an employer is able to count this amount as part of the 9.5% that it pays into a worker’s super. However, super groups view this as contributing to further issues down the line, with many Australians already stressing over whether their retirement savings will see them through to the end of their lives.

“With access to government pensions tightening and home ownership in decline, future generations of retirees will be increasingly reliant on superannuation,” the report says.

What small businesses need to know

Small business owners have reported that they’re behind in their own retirement planning for a variety of reasons, from uncertainty over the future of the Coalition’s now-passed super changes to issues with cashflow that see them pay the business’s costs before paying themselves.

However, the costs of not upholding your obligations on super in smaller businesses can be high – even if the only person you’re not paying is yourself. While sole contractors don’t have the same requirements, the minute you operate as a business, you have to uphold your obligations, even if staff have volunteered to forgo super, says Raftery.

“Ethically, these small businesses who are struggling with super say, ‘I’ll pay all the other employees first’ and will be a bit more slack with themselves,” he says.

This is problematic because the fees that the ATO charge for late payments apply even if a business owner has chosen not to pay themselves.

The ATO highlights the interest charges that get applied when a business fails to pay the super guarantee on time.

“It’s essentially a penalty on each quarter that you’re late – however much super that you should be charging plus an interest rate of 10%, plus an admin fee per employee, per quarter,” says Raftery.

“The other thing that is really important is that if you get hit up with the super guarantee charge, you cannot claim that as a tax deduction.”

McKellar says for those in small family businesses, there’s only really one scenario where super contributions don’t need to be paid.

“The only way around it would be perhaps if someone is working for no payment,” he says.

Other than that, you must pay up. And while business owners might feel stress in the short term, when it comes to their own retirement planning, paying themselves is the best choice for tax planning, says Raftery.

“There’s a legal obligation and if you don’t pay your own and the ATO does its investigation, they won’t treat you any differently than a independent employee,” he says.

“But for their tax incentives it’s to their advantage to pay into super – otherwise they’re just being taxed at the corporate tax rate.”

The inquiry into superannuation payments will look at the accuracy of data collected by regulatory bodies around the value of payments made, as well as the ATO’s approach to compliance.

Submissions to the inquiry are open until February 17, with a view to report by March 22, 2017.

Job Ads Higher In November

ANZ says Job advertisements rose 1.7% m/m in November following a 1.0% rise in the previous month. Annual growth in job ads accelerated to 6.1% y/y, up from 5.2% y/y in October. In trend terms, job ads rose 0.5% m/m in November, slightly lower than the 0.7% rise in the previous month.

anz-job-ads-nov-16“The rise in ANZ job ads over the past four months is quite encouraging given the recent softness in the employment data. It is consistent with our view that although the pace of improvement in the labour market has slowed, conditions remain supportive of ongoing recovery.

The RBA has cited the labour market as a key risk to the economic outlook, reflecting concern over the degree of spare capacity given the high rate of underemployment. This spare capacity has the potential to weigh on wage growth and jeopardise the timing of the return of underlying inflation into the 2-3% target band next year. Moreover, the recent soft patch in activity also poses some risk to employment growth in the near term. As such, we expect that the labour market and the weakness in wage growth will be a key topic of discussion at this week’s RBA board meeting.

The strength in job ads recently, however, suggests that moderate economic growth should remain supportive of an ongoing gradual fall in the unemployment rate, given still solid business conditions and low interest rates.”

Neighbours’ fears about affordable housing are worse than any impacts

From The Conversation.

Housing affordability is a hot topic in Australia. Governments are increasingly recognising that more needs to be done to provide a greater range of affordable housing options, especially in the major cities. It is well documented, however, that proposals for affordable housing development often encounter opposition from host community members.

half-buit-house-pic-2

These community concerns tend to focus on the potentially damaging effects of such projects on property values and quality of life for existing residents. This is despite the public being generally supportive of affordable housing in principle. They would just prefer it wasn’t sited in their local area.

In reality, though, do the concerns that people have about affordable housing development materialise? Do property values go down? Does neighbours’ quality of life suffer?

Our case studies in Brisbane and Sydney provide evidence that, in most cases, they do not.

Testing for local property impacts

How did we test for the impacts of affordable housing projects? With thanks to Australian Property Monitors, we had access to property sales data throughout the Brisbane local government area (LGA), going back to 1999.

Using this data, we tested the impacts of 17 affordable housing developments on property sale prices through two different hedonic pricing models. The models were designed to test whether:

  1. The announcement and eventual construction of affordable housing projects had any impacts (positive or negative) on local property sale prices. Project announcement date was used to capture any “panic sales” that may have happened as a response to the announcements.
  2. The extent of such impacts depended on proximity to the development (by direct distance in 100-metre intervals, up to 500 metres away from the affordable housing project).

The two models were used to test these outcomes collectively for 17 affordable housing projects that were developed across Brisbane LGA between 2000 and 2009, and also on an individual project basis.

Collectively across the 17 projects, these had no significant negative impacts on local property prices. There were mild impacts on properties within 100 metres of affordable housing projects, but not at any statistically significant level.

We found that the characteristics of the individual properties sold (such as number of bedrooms, number of bathrooms) consistently had much greater influence on sale prices than proximity to affordable housing developments.

When looked at individually, the impacts of each project on local property prices were mixed. Some affordable housing projects had positive impacts and others negative.

Only a handful of the measured impacts were statistically significant, however. Even in these cases the impacts of proximity to affordable housing had much to do with other features of the neighbourhood (such as proximity to public transport hubs, water frontages and so on).

These two tests clearly showed that the impacts of affordable housing development on local property sales prices had been minimal. The impacts that were experienced were not universally negative (or positive).

Impacts on the quality of life of neighbours

What then of the impacts on neighbours’ overall quality of life? How does an affordable housing development affect things like traffic, crime, an area’s visual appearance, or sense of community?

To understand this, we conducted doorstep surveys with 141 residents who lived close to (within about 60 metres) eight affordable housing projects in Parramatta local government area.

These projects had been locally opposed but still completed. We selected the most-controversial projects and were able to achieve participation by between one-fifth and one-third of the 60 or so residents likely to have been most affected by those developments.

We wanted to know whether people’s fears at the planning stage had materialised once the developments were complete and occupied.

Across the eight projects, 78% of respondents had experienced no negative impacts as a result of affordable housing development. At only two of our eight sites had a significant number of neighbours experienced negative impacts. These impacts were mostly associated with the behaviours of a small number of individual residents.

At the other sites, the negative impacts were dispersed. Mostly, these related to minor issues such as parking and traffic.

Fears are an obstacle in themselves

Overall, our findings indicate that the feared impacts of planned affordable housing developments tend to be much greater than the impacts neighbouring residents actually experience once those developments are complete and occupied.

In other words, the perception of affordable housing is the key problem, not the affordable housing developments themselves. These are by and large unproblematic once completed.

These findings suggest that governments and developers need to devote much more attention to tackling negative public perceptions of affordable housing and its residents.


Authors: Gethin Davison, Lecturer in City Planning and Design, UNSW; Edgar Liu,Research Fellow at City Futures Research Centre, UNSW


Is Financial Risk Socially Determined?

From The St. Louis On The Economy Blog.

The authors of the In the Balance—Senior Economic Adviser William Emmons, Senior Analyst Lowell Ricketts and Intern Tasso Pettigrew, all with the St. Louis Fed’s Center for Household Financial Stability—found that eliminating so-called “bad choices” and “bad luck” reduced the likelihood of serious delinquency. With the exception of Hispanic families, this did not get rid of disparities in delinquency risk relative to the lower-risk reference group.

However, this exercise was based on the idea that the young (or less-educated or nonwhite) families’ financial and personal choices, behavior and exposure to luck could conform to those of the old (or better-educated or white) families. The authors suggested that such an approach may not be realistic.

A Lack of Choice?

“We believe a more realistic starting point for assessing the mediating role of financial and personal choices, behavior and luck in determining delinquency risk is a family’s peer group,” the authors wrote. They looked at how an individual family’s circumstances differ from its peer group, hoping to capture the “gravitational” effects of the peer group.

The odds are similar to those that were not adjusted, as seen in the figures below. (For 95 percent confidence intervals, see “Choosing to Fail or Lack of Choice? The Demographics of Loan Delinquency.”)

Probability Serious Delinquency1

ProbSeriousDelin2

In particular, they examined how a randomly chosen family fared against the average of its peer group, such as how much debt a young black or Hispanic family with at most a high school diploma has compared to the family’s peer-group norm.

“We assume that the distinctive financial or personal traits associated with a peer group ultimately derive from the structural, systemic or historical circumstances and experiences unique to that demographic group,” the authors wrote.

When assuming that individual families’ choices extend only to deviations from peer-group averages, the authors estimated that:

  • A family headed by someone under 40 years old is 5.8 times as likely to become seriously delinquent as a family headed by someone 62 years old or more.
  • Middle-aged families (those with a family head aged 40 to 61 years old) are 4.2 times as likely to become seriously delinquent as old families.
  • A family headed by someone with at most a high school diploma is 1.8 times as likely to become seriously delinquent as a family headed by someone with postgraduate education.
  • A family headed by someone with at most a four-year college degree is 1.4 times as likely to become seriously delinquent as a family headed by someone with postgraduate education.
  • A black family is 2.0 times as likely to become seriously delinquent as a white family.
  • A Hispanic family is 1.2 times as likely to become seriously delinquent as a white family.

These demographic groups still appear to have a higher delinquency risk than older, better-educated and white families. This suggests that younger, less-educated and nonwhite families may have little choice in the matter.

“The striking differences in delinquency risk across demographic groups cannot be explained simply by referring to differences in risk preferences,” Emmons, Ricketts and Pettigrew wrote. “Instead, we suggest that deeper sources of vulnerability and exposure to financial distress are at work.”

The authors also concluded: “Families with ‘delinquency-prone’ demographic characteristics—being young, less-educated and nonwhite—did not choose and cannot readily change these characteristics, so we should refrain from adding insult to injury by suggesting that they simply have brought financial problems on themselves by making risky choices.”

Each family was assigned to one of 12 peer groups, which were defined by age (young, middle-aged or old), race or ethnicity (white or black/Hispanic) and education (at most a high school diploma or any college up to a graduate/professional degree).

The Problem Of Home Ownership

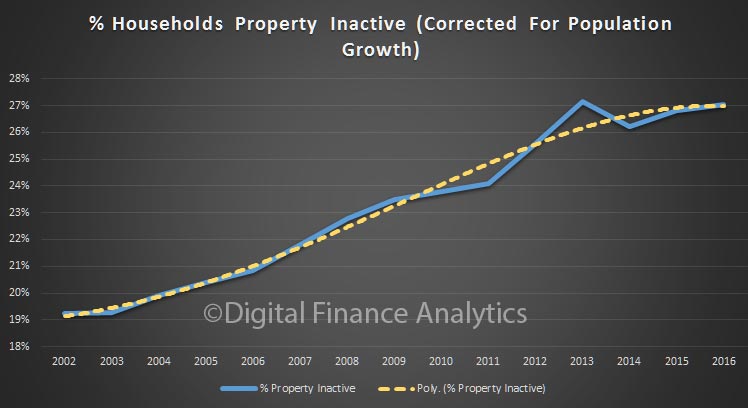
The proportion of households in Australia who own a property is falling, more a renting, or living with family or friends. We track those who are “property inactive”, and the trend, over time is consistent, and worrying.

inactive-property-2016It is harder to buy a property today, thanks to high prices, flat incomes and higher credit underwriting standards. Whilst some will go direct to the investment property sector (buying a cheaper place with the help of tax breaks); many are excluded.

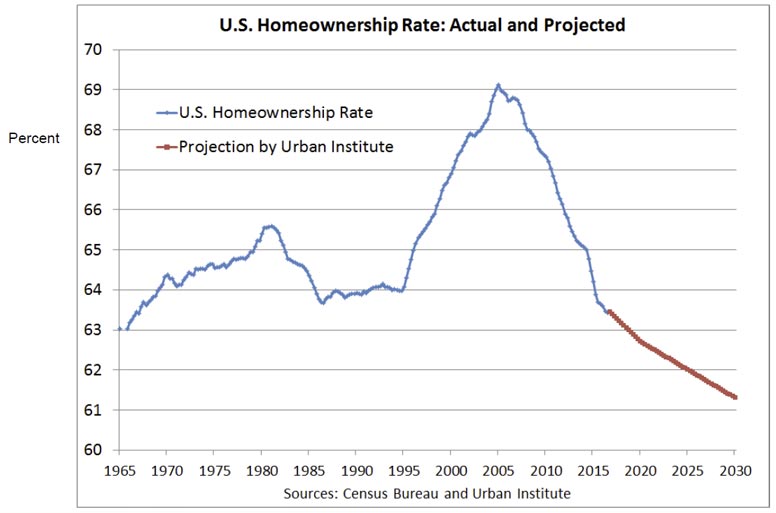
This exclusion is not just an Australian phenomenon. The Federal Reserve Bank of St. Louis just ran an interesting session on “Is Homeownership Still the American Dream?” In the US the homeownership rate has been declining for a decade. Is the American Dream slipping away? They presented this chart:

us-ownershipA range of reasons were discussed to explain the fall. Factors included: the Great Recession and foreclosure crisis; tougher to get a mortgage now (but probably too easy before the crash); older, more diverse American population; stagnation of middle-class incomes; delayed marriage and childbearing; student loans and growing attractiveness of renting for some.

Yet, there is very little association between local housing-market conditions experienced during the recent boom-bust cycle and changes in attitudes toward homeownership. The desire to be a homeowner remains remarkably strong across all age, education, racial and ethnic groups. To remain a viable option for all groups, homeownership must become more affordable and sustainable.

They went on to discuss how to address the gap.

Tax benefits are “demand distortions.” Most economists agree that tax preferences for shelter (especially homeownership) push up prices: Benefits are “capitalized” into price or rent. Tax benefits of $150 bn. annually are skewed toward homeowners in high tax brackets via tax deductibility or exclusion. Tax changes likely in 2017—lower rates and higher standard deduction—will reduce tax benefits for homeownership, perhaps slowing or reducing house prices.

There also are “supply distortions” in housing that push up prices/rents. Land-use regulations/restrictive building codes increase construction costs, making housing less plentiful and less affordable. Local governments could reduce these constraints, and housing of all types and tenures would become cheaper.

Tightening Underwriting Standards. Unsuccessful homeownership experiences stem from shocks (job loss, divorce, sickness) that expose unsustainable financing—i.e., too much debt and too little homeowners’ equity (HOE). Reduce the risk of financial distress and losing a home by encouraging or requiring higher HOE and less debt. This would increase the age of first-time homebuyers and reduce homeownership but also reduce the risk of foreclosures.

You can watch the video here.  But I think there are some important insights which are applicable to the local scene here. Not least, you cannot avoid the discussion around tax – both negative gearing and capital gains benefits need to be on the table. Supply side initiatives alone will not solve the problem.


Do Younger Australians Understand Credit?

Australia’s credit reporting framework has recently undergone a fundamental shift away from a negative only reporting system to comprehensive credit reporting (CCR). Under the changes, lenders can report additional information about borrowers including repayment history such as whether a borrower has paid all credit obligations in a given month, and whether payment was on time, late or missed.

A newly released report examines the knowledge and attitudes of millennials (consumers born between 1980 and mid-2000) towards credit.

millennials


It also considers future implications of the shift to CCR in Australia, including the potential use of non-traditional data to assess creditworthiness. Millennials comprise almost a quarter of the population and are the fastest-growing segment of the consumer lending market in Australia. As millennials apply for credit cards, personal loans, car loans and home loans in coming years, lenders will have a range of new tools to assess credit risk and determine millennials’ access to credit.

This research was commissioned by the Customer Owned Banking Association (COBA) and aims to stimulate discussion about the implications of changes to credit reporting for millennials among Australian consumers, policy makers and industry.

This report is based on a three-stage study conducted over a 12 week period, which relied on a primarily qualitative approach. This included: a comprehensive review of domestic and international literature, 15 semistructured interviews across seven key informant groups, and two focus groups with 12 millennials. The findings presented are strictly informed by the literature and the qualitative data collected; they do not reflect the views of Good Shepherd Microfinance.

Despite being the fastest-growing segment for consumer loans, global and domestic research shows that young people are more likely to be ‘thin file’ or ‘credit invisible’ and are overrepresented among financially excluded people. Credit providers rely on previous credit history to make decisions, yet without any prior credit usage, providers have limited to no visibility of the creditworthiness of this group. Their lack of access to mainstream financial products may also make this group vulnerable to predatory lending products.

Our study finds that millennials have a lack of awareness of CCR, hence it will be imperative to raise their awareness to ensure the benefits of CCR are realised. Millennials do not know what data will be collected about them and they have little idea of how their behaviour will impact their creditworthiness now and in the future. Nearly two-thirds of millennials (64%) have never heard of, or do not understand, the term ‘credit report’, according to consumer research commissioned by COBA. Targeted education and transparency of credit assessment decisions will therefore be essential.

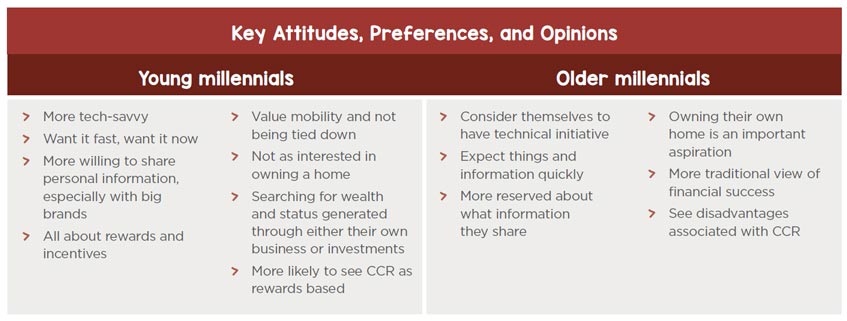
This report divides millennials into two distinct groups — the young millennials (18 to 24 years of age) and the older millennials (25 to 35 years of age). The difference between the young and the older millennials lies in their technological capabilities, their attitudes, and the degree to which they are willing to share their personal information digitally. Some millennials — especially young millennials — could more readily see the benefits associated with having a better credit rating as an incentive or reward for ‘good’ credit behaviour. Others had some reservations, seeing the potential for some groups (such as young millennials, those with low incomes, migrants, and early-school leavers) being disadvantaged as they were more likely to be creditinvisible. However, some studies argue that these groups may benefit from the introduction of CCR if payment behaviour from other sources is able to be included in credit-making decisions.

Overseas experience of credit reporting strongly supports the potential for non-traditional or alternative data to complement, rather than substitute, traditional credit data used to assess creditworthiness. Use of this data is particularly relevant for millennials as they generate broad alternative data sets about themselves through their digital behaviours including online payment and social media activity. Using alternative data to determine creditworthiness can open the door to better credit access for many millennials. As a first step, including utility and telecommunications data in credit reporting could facilitate new to credit consumers, such as millennials, to build a credit history without the necessity of borrowing.

More data captured and used by credit providers may mean greater opportunities for millennials and others who are ‘thin file’ or ‘no file’, but it also brings with it risks, particularly for young people who are generally unaware of how this data is captured and used. Potential risks include concerns that over-indebted consumers could be disproportionately impacted; data quality and integrity could lead to inaccurate or misinterpreted credit decisions; privacy and security of personal data; potential use of data for unauthorised purposes e.g. identity theft or fraud; cross-industry differences in data-capture methods and requirements; treatment of hardship or repayment history information; risk-based pricing; as well as a fear of increasing financial or social exclusion resulting from loan defaults. Millennials are a generation that is willing to take control of their personal information and CCR may provide them with an opportunity to do so. However, their lack of awareness and knowledge gaps in relation to credit puts a responsibility on all stakeholders to ensure that these are addressed through targeted education. Having more engaged and responsible consumers also benefits lenders, and can provide a positive flow-on impact on the economy as a whole.

Australia is discriminating against investors

From The Conversation.

Many Australians dream of starting their own businesses. But they face restrictions on where they can access startup capital. In Australia you must be certified as a “sophisticated investor” to invest in risky, early stage ventures that cannot yet comply with costly disclosure requirements.

Investment--PIC

A “sophisticated investor” is someone with an income of at least A$250,000 per annum or assets worth A$2.5 million. But this qualification not only discriminates against some investors, it is a very limited view of what it means to be “sophisticated”. It also ignores recent changes in how companies interact with an important group of early investors – their customers. Even more, it robs startups of valuable capital.

The argument against “sophistication”

The argument for this restriction is that investing in private companies with unregulated disclosures is risky. They are not subject to the same requirements of a public company and are potentially more difficult for a layman to evaluate. “Unsophisticated investors” should just stick to publicly listed investments because they are less risky and more transparent.

But there’s nothing particular about having money that makes you a good investor and investors get shortchanged in public markets as well.

In particular, it is well documented that, on average, shares sold to the public through an IPO significantly underperform other investments in the long-run. Even when a high quality IPO does come to the market, unsophisticated investors will struggle to get a meaningful allocation, while wealthy, well-connected investors end up with most of what they ask for.

The academic literature refers to this as the “winner’s curse”, whereby unsophisticated investors only receive shares in an IPO when sophisticated investors think it’s a lemon.

Many startups have a unique relationship with customers

But companies also have greater intimacy with their customers than ever before. Micro-investing startup Acorns recently sought to raise A$6 million in a private share issue, at least partially from its estimated 160,000 Australian users. Acorns’ users are reported to have already pledged more than A$1 million to help the startup replenish its cash and pursue further growth opportunities.

Acorns may be slightly unusual in being able to raise this money, as it is itself an investing app. It helps its users build wealth by saving “spare change” and investing this money for them. So its client base is at least familiar with the tenets of investing.

But Acorns’ ability to tap its user base as a source of capital also challenges the notion that only “sophisticated” investors are suitably qualified to participate in early stage deals. Acorns’ users are typically young tech savvy millennials who are unlikely to pass the sophisticated investor test (which is probably why they are using the app). Yet, because of their interaction with the app, these users have unique insights in evaluating Acorns’ prospects.

It raises questions as to whether the distinction between “sophisticated” and “unsophisticated” investors remains relevant in the world of app based tech startups. These startups often have aggressive go-to-market business models that attempt to capture as many users as possible relatively early in their life. Would someone that is cash rich have a better understanding of this business than a customer or user of it?

In making an early stage investment decision a “sophisticated” investor could try to determine whether an app solves a significant problem in its user’s life and thus how deeply a user will engage with it. But predicting the behaviour of app users is inherently difficult. So who better to predict it than the users themselves?

Discriminating against certain investors costs everyone

Under the current rules, a lot of “unsophisticated” users are denied access to such investment opportunities because they are simply not wealthy enough. This robs investors of an opportunity and startups of a potential source of capital. Even more, we all could lose as companies that create incredible products struggle or die for lack of funds.

For startups, drawing on customer support, as Acorns has done, would provide a source of capital that does not carry the costs and conditions that are typically attached to angel and venture capital funding. For small investors it gives them direct access to some potentially very lucrative (but very high-risk) investments that otherwise would be impossible or very costly to access.

Democratising the way startups are financed could create an environment whereby entrepreneurs, small investors and the economy as a whole all benefit from financing new and interesting endeavours. But it all starts with re-conceptualising the current arbitrary notion of “sophistication”.

Associate Professor, UNSW Australia

Sydney needs higher affordable housing targets

From The Conversation.

The release this week by the Greater Sydney Commission of city-wide draft plans mandating some measure of affordable housing in new developments is a step in the right direction. However, the target of 5-10% on rezoned land is too low to make a serious impact on the city’s affordable housing shortage. It must be more ambitious.

high-rise-pic-ii

Research highlights the central importance of affordable, stable housing to economic and social wellbeing. Yet, in Sydney, the lack of affordable housing has reached crisis point. Everyone from community housing providers to Commonwealth Treasury secretary John Fraser is pointing out that rising house prices are creating massive social and economic problems.

Housing researchers and academic housing economists across Australia agree that an essential part of the policy mix is to mandate a significant percentage of affordable homes in all new housing developments. This is known as “inclusionary zoning”.

Other global cities such as New York and London have recognised the important role of housing in their economies and have inclusionary zoning policies. Other states in Australia have also set affordable housing targets. These have not had harmful impacts on housing investment.

Fighting to keep windfall profits

Predictably, parts of the property industry are already resisting any level of inclusionary zoning. Some developers claim that affordable housing targets will increase housing costs for the majority. They argue that profits lost on affordable housing will have to be recouped elsewhere.

While we can expect this line of argument from those who profit from the status quo, it is fundamentally wrong for a simple reason. Housing developers will not bear the burden of these targets. Rather, it will be borne by land holders who currently make large windfall gains from selling land for development.

When land has been zoned to enable higher-density development, landholders reap these windfall profits without actually delivering any new housing or infrastructure.

For example, the site of a recently completed development in Sydney’s inner west was first purchased by a property company as industrial land for around A$8.5 million. Following a rezoning to higher-density residential, the site was sold again for A$48.5 million. In this case, the first buyer made a 471% windfall profit without building anything on the site.

The seller of the rezoned site of the Lewisham Estates development made a 471% windfall profit without building a thing. Inner West Council

If a fixed percentage of affordable housing becomes a condition of rezoning such sites, this will only affect the size of the landholder’s windfall gain. Developers will offer lower prices for the land, based on the mandated requirements for affordable housing.

Remember that the uplift in land value results from public policy changes that allow for housing development or higher-density housing. It is not unreasonable, then, that landowner windfalls should be limited to achieve the important public policy outcome of housing affordability.

This is why some property developers do not object to inclusionary zoning. Indeed, some have been part of the push for inclusionary zoning, through their membership of the Committee for Sydney. They recognise that so long as the “playing field” is level for all, mandatory targets for affordable housing can be achieved without making development unprofitable or housing more expensive.

Government is conflicted

The New South Wales government has been reluctant to set significant inclusionary zoning requirements for new developments in several important parts of the city. One possible reason is that the government itself stands to reap revenue from rezoning and/or redevelopment of government-owned land.

It is especially inappropriate that government-owned land should be exploited in this way. In big development schemes where government is the major landowner, such as Central-Eveleigh, the Bays Precinct and Olympic Park, public good should trump Treasury “profits” on land release. Government should not be in the business of extracting its own windfall at the cost of housing affordability.

Inclusionary zoning targets should therefore be much higher for housing developments on government-owned land, especially in major renewal precincts. Not only would developments on such sites still yield a “profit” for the taxpayer, they would deliver a social benefit to the wider community at no real cost and without impacting feasibility.

What targets should be set?

We join those in the housing sector who believe that at least 15% of housing in new private developments should be affordable. On publicly owned land, at least 30% of new housing developments should be affordable.

Of course, the details of land zoning matter. If targets are set, we must ensure the definition of “affordable” actually achieves the goal of reducing housing stress for people on low and moderate incomes while maintaining housing quality.

Substantial inclusionary zoning requirements will not make development more expensive. They will make it harder for land speculators to make large profits while making no contribution to the social and economic future of New South Wales. It is high time the foxes in the henhouse were called to account.

To Borrow, or not to Borrow?

From The Federal Bank of St. Louis Blog.

Have you ever wondered whether it makes sense to borrow for college? Or how much debt is worth taking on to get that dream home?

Well, we at the Center for Household Financial Stability did. Accordingly, we organized, along with the Private Debt Project, a research symposium back in June to see if there exist tipping points at which taking on more debt could be too financially risky. After all, if debt doesn’t lead to more income and wealth, what’s the point? Asking these questions is one of the driving forces at the Center because we don’t think enough attention is being paid to the debt side of family balance sheets.

fed-income

For the symposium, we commissioned several new papers from Fed and non-Fed economists. The  papers—along with my summary and reflection—were released last week.

The research findings were both interesting and often counterintuitive. Let me mention just a few.

My colleagues Bill Emmons and Lowell Ricketts looked at loan delinquencies. Reflecting our Center’s ongoing work on the demographics of wealth, they found that younger, less-educated and nonwhite families were more likely to tip into delinquency. No huge surprise there. But then the co-authors posed what I think is a groundbreaking framing question, including for many Fed economists: Are these struggling families at this greater risk because they make riskier financial choices or because of  structural, systemic forces that are largely shaping their financial behavior? In other words, is our tipping points question whether more financial education is primarily needed or whether a change in public policy is primarily needed?

Neil Bhutta and Benjamin Keys also discerned some alarming tipping points by looking at the nearly $1 trillion in home equity extractions between the boom years of 2002-2005. Extractors, they found, were more likely to default on their mortgages, even after controlling for credit scores and other risk factors. Even more surprising, extractors were more than twice as likely to become severely delinquent on their mortgage debts and almost 40 percent more likely to become delinquent on other kinds of debt.

We didn’t just look at the numbers but also the psychology of tipping points. Christopher Foote, Lara Loewenstein and Paul Willen found that, leading up to the financial crisis, excessive mortgage borrowing  was fueled not by a financial indicator (the amount of income needed for a mortgage) but by a psychological one (the expected increase in future housing prices).

The symposium also opened up new ways to think about tipping points: At what point, for example, is an aspiration given up because of too much debt? And do different generations—say Gen Xers and millennials—think differently about how much debt is good or bad?

Several trends suggest families will be struggling with high debt levels for years to come, and it behooves all of us to think more about when debt goes from being productive to destructive. The financial health of families and our economy may depend on it.

I hope you’ll have a chance to read all of the papers, each one novel and forward-looking.

Additional Resources

Symposium: Tipping Points: Mapping and Understanding the Impact of Debt on Household Financial Well Being and Economic Growth

On the Economy: Mortgage Debt’s Share of Total Debt Keeps Declining

On the Economy: How Consumer Debt Has Evolved in the Nation and the Eighth District

Changing dynamics in household behaviour help explain low inflation

The NZ Reserve Bank is taking account of changing household saving and spending behaviours in its inflation forecasts, Deputy Governor Geoff Bascand said in a speech to the Australia National University in Canberra.

Mr Bascand said that Australasian patterns of saving and spending are proving different from other advanced economies.

Figure 2: Gross national saving (share of GDP)

Internationally, demand dynamics have changed since the global financial crisis (GFC), challenging inflation modelling and, in some cases, inflation-targeting frameworks.

Some economists suggest that we are now in an era of “secular stagnation”, with persistent low demand due to higher saving and a reduced tendency to invest, driving down the long-term real neutral interest rate. Others point to an overhang from earlier excessive debt accumulation and suggest that demand is being depressed by a lengthy period of deleveraging (reduced borrowing).

Across advanced economies, investment has been weak and national saving rates on average haven’t altered significantly since the GFC.

But a different picture emerges in Australasia, which has witnessed an uplift in saving, especially by households, and steady output growth supported by robust investment.

Figure 11: Household debt and wealth

“In Australasia the current outlook looks a lot like that which prevailed before the 2000s. In other advanced economies, weak investment growth, coupled with a disappointing expansion in the supply side of the economy, points to a world more consistent with lower long-term growth expectations.

“To what extent heightened household saving preferences in Australasia represent a permanent shift or a prolonged deleveraging adjustment is uncertain. Some indicators provide tentative support to the view that it represents a prolonged cyclical correction.”

Mr Bascand says the rate of growth of consumption, including the relationship between consumption and wealth, is crucial to the Reserve Bank’s assessment of business cycle dynamics and inflation prospects.  Projections of demand arising from historical estimates of consumption from wealth have been over-optimistic. Weaker spending than expected out of higher housing wealth is part of the reason why inflation has been lower than forecast.

He says taking into account the increase in household saving we have seen, the links between interest rates, output and inflation appear stable.

“Currently, we are projecting per-capita consumption growth to improve and provide an impetus to output growth. The acceleration is modest compared to the previous cycle as household saving is expected to remain positive over the forecast horizon.”