Investors Burn Bright, First Time Buyers Sidelined (Again)

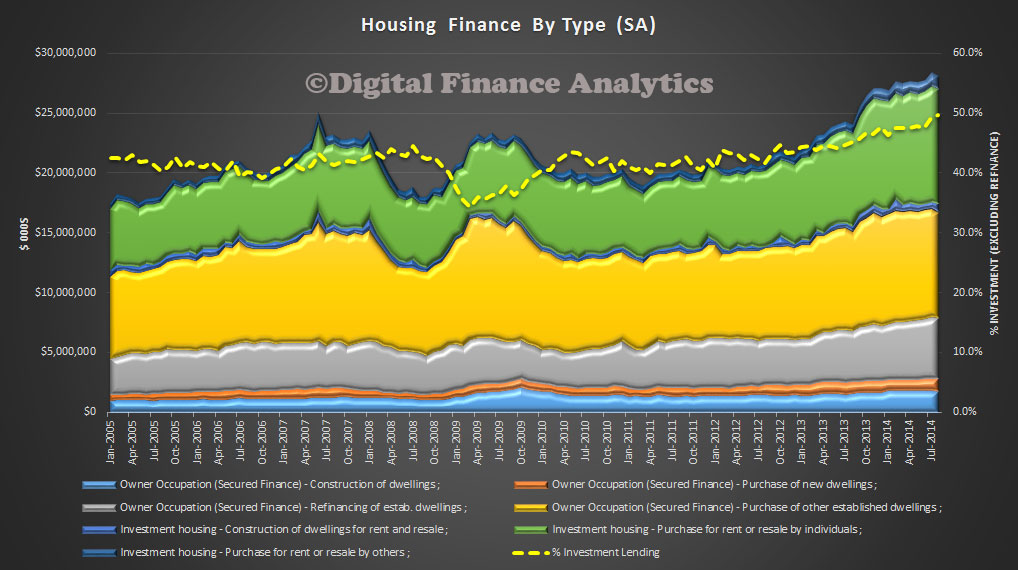
The monthly ABS housing finance data was released today for August. In a way, nothing new here, as first time buyers continue to be squeezed out, and investors dominate. The trend estimate for the total value of dwelling finance commitments excluding alterations and additions rose 0.3%. Investment housing commitments rose 0.9% while owner occupied housing commitments fell 0.1%. In seasonally adjusted terms, the total value of dwelling finance commitments excluding alterations and additions fell 1.2%.

In trend terms, the number of commitments for owner occupied housing finance fell 0.2% in August 2014. In trend terms, the number of commitments for the purchase of established dwellings fell 0.3% and the number of commitments for the construction of dwellings fell 0.2%, while the number of commitments for the purchase of new dwellings rose 1.7%. In original terms, the number of first home buyer commitments as a percentage of total owner occupied housing finance commitments fell to 11.8% in August 2014 from 12.2% in July 2014.

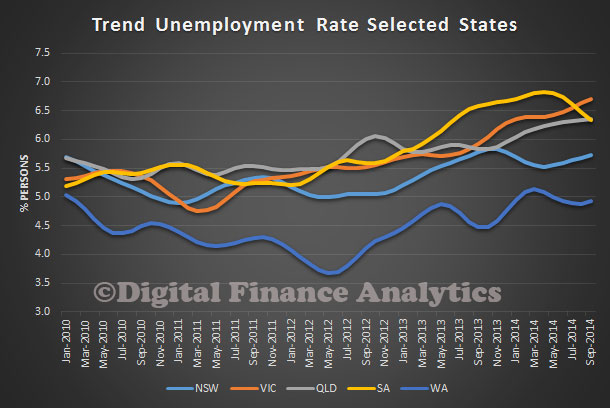
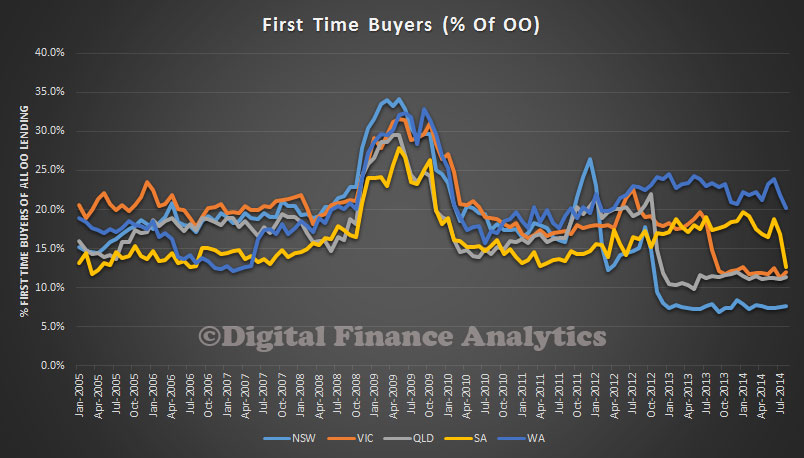
Looking at the first time buyer data, we see they are lowest in NSW and VIC (where the investment market is hottest), but we also see down trends in WA and SA. This confirms our surveys that first time buyers cannot compete.

HousingFinancePC-FTBStateAugust2014Looking at investment lending we see that nearly 50% of all lending in August (if you exclude refinance) was for investment purposes.

HousingFinanceInvAugust2014

Household Ratios By Segment

Yesterday DFA posted the most recent RBA household ratios showing that overall debt for households is higher than its ever been. Today we take the argument further, with detailed analysis across our segmentation, looking at loan to income ratios. The DFA segmentation positions households on a multi-factorial basis, including demographics, wealth and life-stage. The data here is the average across Australia by segment, there are significant state variations, which we won’t cover today. We see that the average is around 137. However, first time buyers have a more adverse ratio well above 200, and young families, just below 200. On the other hand, suburban families have a ratio around 100, and down traders are even lower. So my point is (once again) that averages can hide a world of differences. It is also worth noting that different household segments tend to live in different suburbs, so the net economic impact on an area will be different. One final point, the incomes are current ones (to take account of falling incomes in real terms) for our segments.

HouseholdRatiosSegmented

Household Debt Burden Increases Again

Using the RBA household ratios, we can look at the effect of debt on the average household. It blows up the myth of “household deleveraging”, much talked about after the GFC. Whilst the average data masks the differences between different household segments (see the segmented analysis in our survey and we know debt is becoming more concentrated in some households, whilst others pay down), it can tell a story. The first chart shows the ratio of housing debt to income, and we see it has been rising steadily since 2013, and is substantially higher than in 2000. The other point to note is that the ratio of housing debt to assets is down a bit, thanks to house prices rising faster than debt. However, households have never been so in debt.

HouseholdRatios2Another way to look at the data is to compare the ratio of interest payments to (quarterly) average income. We see that with rates currently low, the ratio is down from its high in 2008. However, it is worth noting the average home loan rate has fallen further compared with the housing interest payment to income ratio. This is because relative to income the average mortgage is bigger today – reflecting elevated prices and higher loan to value ratios.

HouseholdRatios1This is consistent with the loan to income ratios we highlighted earlier and a fall in real incomes. More evidence the RBA should act!

Unemployment Up – Probably!

The ABS released their much heralded employment data today for September, having warned yesterday about the seasonally adjusted sets.

Australia’s seasonally adjusted unemployment rate increased 0.1 percentage points to 6.1 per cent in September 2014, as announced by the Australian Bureau of Statistics (ABS) today. The seasonally adjusted labour force participation rate decreased 0.2 percentage points to 64.5 per cent in September 2014.

The ABS reported the number of people employed decreased by 29,700 to 11,592,500 in September 2014 (seasonally adjusted). The decrease in employment was driven by decreased part-time employment for both females (down 31,600 persons) and males (down 19,700 persons). In trend terms the number of people employed increased by 5,600 in September 2014.

The ABS monthly seasonally adjusted aggregate hours worked series decreased in September 2014, down 15.0 million hours (0.9%) to 1,591.3 million hours. The seasonally adjusted number of people unemployed increased by 11,000 to 746,600 in September 2014, the ABS reported.

Looking at the original state data, we see the rate higher in VIC, and lower in WA, and rising on both these states. SA has fallen a little.

TrendUnemploymentOrignalSept2014

State participation also varies, with consistently higher rates in WA, and lower in SA and NSW. Some of this reflects the demographic differences between the states as we discussed recently.

TrendParticipationOrignalSept2014We expect unemployment to continue to trend higher in coming months.


More Units Help Drive Building Approvals Higher – ABS

The ABS released their building approvals data to August 2014. The number of dwellings approved rose 1.2 per cent in August 2014, in trend terms, and has risen for three months.

Dwelling approvals increased in August in the Australian Capital Territory (13.0 per cent), Northern Territory (8.8 per cent), Queensland (2.7 per cent), South Australia (0.9 per cent), Victoria (0.6 per cent), Western Australia (0.5 per cent) and New South Wales (0.4 per cent) but decreased in Tasmania (4.3 per cent) in trend terms.

In trend terms, approvals for private sector houses were flat in August. Private sector house approvals rose in New South Wales (1.8 per cent) and Queensland (0.8 per cent), but fell in South Australia (2.9 per cent), Western Australia (0.8 per cent) and Victoria (0.5 per cent).

PrivateSectorDwellingsAugust2014The trend estimate for private sector dwellings excluding houses rose 3.1% in August and has risen for three months. The seasonally adjusted estimate for private sector dwellings excluding houses rose 9.6% in August and has risen for two months. Units account for more than 50% of approvals in NSW, whereas in WA, it is about 23%.

PCUnitsAugust2014The value of total building approved rose 0.8 per cent in August, in trend terms, and has risen for two months. The value of residential building rose 1.4 per cent while non-residential building fell 0.5 per cent in trend terms. The seasonally adjusted estimate of the value of total building approved rose 0.5% in August following a fall of 10.9% in the previous month. The value of residential building rose 3.0% and has risen for two months. The value of non-residential building fell 4.5% and has fallen for two months.

ValueBuildingWorkAugust2014

Household Income Trends Show Strongest Growth At The Top

The ABS today released their Distribution of Household Income, Consumption and Wealth data for the years from 2003 to 2012.   According to the ABS, the average gross disposable income of Australian households grew 58 per cent in the period 2003-04 to 2011-12. However, the highest income quintile grew at a rate above average, at 62 per cent. All other income quintiles grew above 50 per cent , but below the average rate of 58 per cent. We see that older Australian’s income has been growing faster than younger ones.

GrossIncomesBy-AgeBandsThe relative share of gross income is gravitating towards older households. This is a function of the growing number of older households, thanks to the demographic shifts, and the fact they hold the lions share of investments yielding income.

RelativeShareGrossIncomesBy-AgeBandsWe can also look across the income quintiles (20% bands). We see stronger income growth in the higher income groups. This is stated in perecentage terms, but in doller terms the relative amounts are significant.

GrossIncomesPCQuintilesWe can see that growth in incomes for the richest quintile is stronger than the lower ones.

GrossIncomesQuintilesThe ABS says growth in wages and salaries was by far the largest contributor to this increase, except for the lowest income quintile, where social assistance benefits were the largest contributor to their income growth.

This is an important data-set and is the first time data for household groups has been released under the framework of the national accounts. We can look at which household groups are driving the growth in income, consumption, savings and wealth in the national accounts.

For example, households with two adults and dependent children were responsible for about one-third of the growth in household gross disposable income.

Households where the reference person was aged 35 to 44 years had an increase in income tax of $9,000 – with their payments going from $17, 000 in 2003-04 to $26,000 in 2011-12 – which was above the average increase of $4,500.

Of course this data stops in 2012, so we cannot yet see the impact of falling incomes in real terms, which we have discussed previously.

FOFA Survives

Last night in the Senate, the plans to disallow significant portions of the Government’s Future of Financial Advice (FOFA) reforms were blocked by a majority of two votes. The amendments were saved with support from the Palmer United Party, Motoring Enthusiast Party, Family First and Liberal Democratic Party cross-benchers. So the latest iterations of the Future of Finance Reforms stands.

The more recent changes tweaked the wording such that advisors providing general advice (a.k.a) product sales advice cannot directly receive commissions. However, it remains quite feasible for advisors and other customer facing staff to be remunerated against a set of performance targets such as number of products sold against a target. This plays into the hands of the larger banks who control most financial advisors.

As a result, it seems that consumers will need to be watchful that product sales could be dressed up as advice. We discussed the FOFA issue in some detail recently.

The right answer would have been to dispense with general advice altogether, so that consumers could either receive clear financial advice, for which no commissions or other payments should be made; or product sales advice, when commissions and other financial incentives should be openly declared.

FOFA is still a pig’s ear. The majority of consumers seeking investment advice will be older (see the chart below), and there is a risk of undue influence from advisors and others who offer sales advice in the guise of general advice.

HSR4

Retail Trade Turnover For August Only Slightly Up – ABS

The ABS published their Retail Trade data for August. The seasonally adjusted estimate rose 0.1% in August 2014. This follows a rise of 0.4% in July 2014 and a rise of 0.6% in June 2014. In seasonally adjusted trend terms, Australian turnover rose 4.9% in August 2014 compared with August 2013. Most analysts were expecting around 0.4%, this month, so the result is below expectations.

There are considerable state variations, with Queensland remaining the weakest, and Victoria the strongest amongst the larger states. In terms of the states and territories in August 2014, Northern Territory rose (1.7%), Victoria (0.7%),  Western Australia (0.1%), South Australia (0.0%), Tasmania (0.0%), New South Wales fell  (-0.1%), Australian Capital Territory (-0.4%) and Queensland (-0.6%); all in seasonally adjusted terms.

RetailTurnoverByStateAugust2014The industry variations were as follows. Other retailing rose (1.6%), Food retailing (0.3%), Clothing, footwear and personal accessory retailing (0.3%), Cafes, restaurants and takeaway food services (0.2%), Household goods fell (-0.8%) and Department stores (-2.9%) in seasonally adjusted terms.

RetailTurnoverByCategoryAugust2014Many households are keeping their wallets tight shut, we think falling wages in real terms and large mortgages are partly to blame, even at current low interest rates.

DFA On Ross Greenwood’s Money Show Discussing Mortgage Stress

Following on from the Nine coverage of our mortgage stress analysis, Ross Greenwood and I discussed our stress findings last night on his 2GB radio show. You can hear the entire discussion, courtesy of 2GB.

Here is the stress map for the Sydney region, showing the changes in stress levels from today, compared with an average mortgage rate sitting at 7%. The darker blue colours are where the most significant changes are expected to impact. You can read about the DFA modelling approach to mortgage stress here.

SydneyStressChange

Mortgage Stress Coverage on Nine

Last night Ross Greenwood ran a piece on Mortgage Stress, using the DFA Mortgage Stress Data, which we had recently updated to take account of the latest economic data and surveys. You can watch a video of the report, courtesy of NineMSN.

I covered the results of the updated modelling recently, and you can view some of the stress maps on the blog.

MortgageStressSept2014My point is that even at current low interest rates, some households today are already finding it hard to make ends meet, but should mortgage rates rise, (the long term average is a rate of around 7%, not the current 4.5%), then the number of households in difficulty would increase significantly in specific areas of some Australian cities. This flows on to dampening economic activity, and lower house prices, and links directly back to yesterdays data on real income falls in some segments. Those who are first time buyers, or young families are most exposed. In our surveys we found that less than half these households had a firm grip on their income and expenditure, and many of these did not run a household budget, relying on credit cards to plug the gap. Recent media coverage of DFA work is listed elsewhere on the blog.